
Key Insights
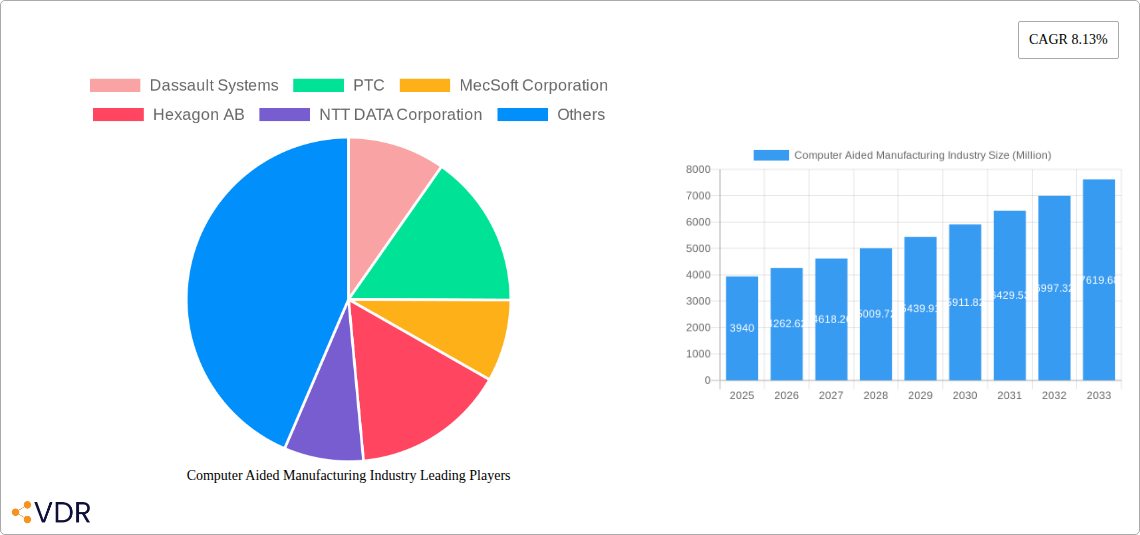
The Computer-Aided Manufacturing (CAM) industry is experiencing robust growth, projected to reach a market size of $3.94 billion in 2025, exhibiting a Compound Annual Growth Rate (CAGR) of 8.13% from 2019 to 2033. This expansion is driven by several key factors. Firstly, increasing automation across various sectors like aerospace & defense, automotive, and medical devices necessitates sophisticated CAM software for efficient production. Secondly, the rising adoption of Industry 4.0 principles, emphasizing digitalization and data-driven decision-making, fuels demand for advanced CAM solutions. Furthermore, the trend towards customized manufacturing and smaller production runs benefits from CAM's ability to optimize individual processes, reducing lead times and improving overall efficiency. However, challenges remain, including the high initial investment required for implementing CAM systems and the need for skilled personnel to operate and maintain these technologies. Despite these restraints, the long-term outlook for the CAM market remains positive, driven by continuous technological advancements, such as the integration of artificial intelligence and machine learning for enhanced process optimization and predictive maintenance. The market is highly competitive, with established players like Dassault Systèmes, Siemens AG, and Autodesk Inc. alongside specialized CAM software providers like MecSoft Corporation and SolidCAM Ltd. Regional growth will likely be strongest in North America and Asia Pacific, fueled by robust industrial activity and technological adoption rates. The continued focus on improving operational efficiency and enhancing product quality across various industries will solidify the importance of CAM technologies over the forecast period.
The competitive landscape is characterized by a mix of large multinational corporations and specialized software providers. Major players are constantly innovating to offer integrated solutions that encompass design, simulation, and manufacturing processes. This integrated approach offers end-users a streamlined workflow, improving overall productivity and reducing errors. The expansion into emerging markets, particularly within Asia Pacific, presents significant growth opportunities for existing and new entrants. However, successful market penetration requires strategic partnerships with local distributors and integrators to address regional specific needs and support effective implementation. Future growth will likely depend on continued investments in research and development, focusing on areas like cloud-based CAM solutions, augmented reality integration, and improved user interfaces to make the technology accessible to a wider range of manufacturers.
Computer Aided Manufacturing (CAM) Industry Market Report: 2019-2033
This comprehensive report provides an in-depth analysis of the Computer Aided Manufacturing (CAM) industry, encompassing market dynamics, growth trends, competitive landscape, and future outlook. With a focus on key segments and leading players, this report is an essential resource for industry professionals, investors, and researchers seeking to understand and capitalize on opportunities within this rapidly evolving sector. The study period covers 2019-2033, with a base year of 2025 and a forecast period of 2025-2033.
Computer Aided Manufacturing Industry Market Dynamics & Structure
The CAM market is characterized by a moderately concentrated landscape, with several major players vying for market share. Technological innovation, particularly in areas like AI and 3D printing, is a significant driver of growth. Regulatory frameworks impacting manufacturing processes and data security influence market operations. Competitive pressures arise from both established CAM providers and emerging players offering specialized solutions. The end-user demographics are diverse, encompassing various industries with varying levels of CAM adoption. Mergers and acquisitions (M&A) activity reflects consolidation trends within the sector. The market is expected to be worth xx Million USD by 2033.
- Market Concentration: Moderately concentrated, with top 5 players holding approximately xx% market share in 2025.
- Technological Innovation: AI integration, advanced simulation capabilities, and cloud-based solutions are key drivers.
- Regulatory Frameworks: Compliance with data privacy regulations and manufacturing standards influences market dynamics.
- Competitive Substitutes: Traditional manual manufacturing methods and specialized software solutions pose competition.
- End-User Demographics: Automotive, aerospace, and medical sectors represent significant market segments.
- M&A Trends: Consolidation through acquisitions and partnerships is anticipated to increase over the forecast period. xx M&A deals projected between 2025 and 2033.
Computer Aided Manufacturing Industry Growth Trends & Insights
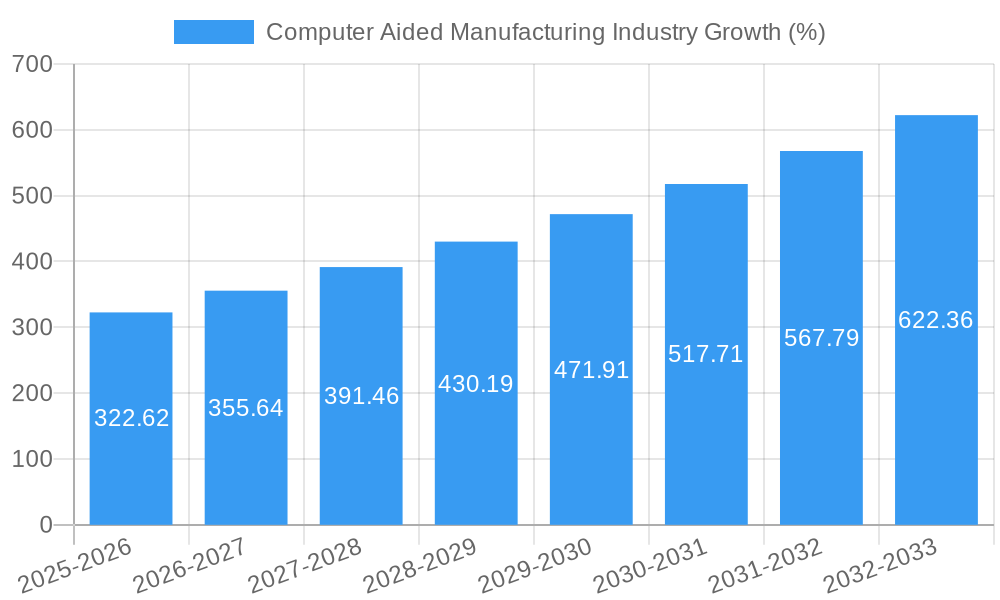
The CAM market has experienced significant growth throughout the historical period (2019-2024), driven by increasing adoption across diverse industries. The market size is projected to expand at a Compound Annual Growth Rate (CAGR) of xx% from 2025 to 2033, reaching xx Million USD by 2033. Technological advancements, particularly the integration of AI and machine learning, are accelerating automation and efficiency gains, enhancing the appeal of CAM solutions. Consumer behavior shifts towards customized and high-precision manufacturing further fuel market expansion. The increasing adoption of Industry 4.0 principles and digital transformation initiatives in manufacturing are also contributing factors. Market penetration in key sectors like automotive and aerospace is steadily increasing, and further growth is anticipated in emerging sectors like micro-manufacturing and personalized medicine.
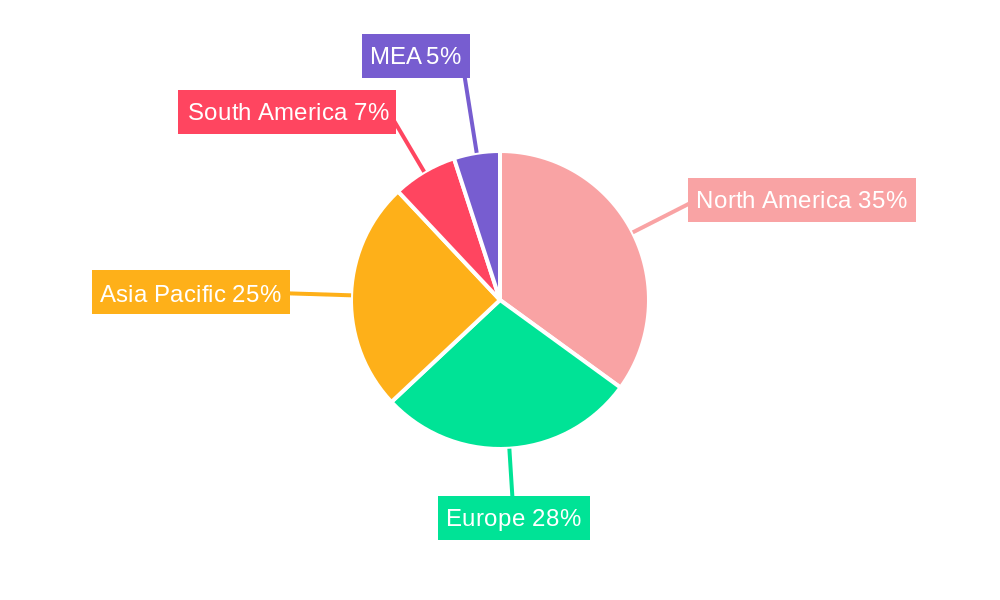
Dominant Regions, Countries, or Segments in Computer Aided Manufacturing Industry
The North American region currently holds the largest market share in the CAM industry, driven by high adoption rates in the aerospace and automotive sectors. However, the Asia-Pacific region is projected to witness the fastest growth rate over the forecast period, fueled by rapid industrialization and expanding manufacturing capabilities in countries like China and India. Within end-user industries, the automotive segment currently dominates, but the aerospace & defense and medical sectors are expected to exhibit significant growth due to rising demand for advanced manufacturing technologies and increased regulatory requirements.
- North America: High adoption rates, particularly in aerospace and automotive. Market size: xx Million USD in 2025, Market Share: xx%.
- Europe: Strong presence of established CAM vendors and growing adoption across various industries. Market size: xx Million USD in 2025, Market Share: xx%.
- Asia-Pacific: Fastest-growing region, driven by industrialization and expanding manufacturing capabilities in China and India. Market size: xx Million USD in 2025, Market Share: xx%.
- Automotive: Largest end-user segment, driven by high demand for automation and precision manufacturing. Market size: xx Million USD in 2025, Market Share: xx%.
- Aerospace & Defense: Significant growth potential due to increasing complexity and stringent quality standards. Market size: xx Million USD in 2025, Market Share: xx%.
- Medical: Expanding market driven by the need for customized medical devices and implants. Market size: xx Million USD in 2025, Market Share: xx%.
Computer Aided Manufacturing Industry Product Landscape
The CAM software market offers a diverse range of products catering to various manufacturing processes and industry needs. Innovations include AI-powered optimization tools, advanced simulation capabilities, and cloud-based collaborative platforms. Key performance metrics encompass ease of use, processing speed, accuracy, and integration with other manufacturing systems. Unique selling propositions often focus on specific industry expertise, ease of use, and specialized functionalities. Recent advancements leverage technologies such as Generative Design and Digital Twins to accelerate product development and optimize manufacturing processes.
Key Drivers, Barriers & Challenges in Computer Aided Manufacturing Industry
Key Drivers:
- Increased automation needs across industries.
- Growing demand for customized and high-precision products.
- Technological advancements such as AI and machine learning.
- Government initiatives promoting Industry 4.0 and digital transformation.
Key Challenges:
- High initial investment costs for software and hardware.
- Skill gaps in operating and maintaining CAM systems.
- Data security concerns and the need for robust cybersecurity measures.
- Integration complexities with existing manufacturing systems. This results in approximately xx Million USD in lost revenue annually across the industry.
Emerging Opportunities in Computer Aided Manufacturing Industry
- Expansion into new and emerging markets, particularly in developing economies.
- Development of CAM solutions tailored to specific industry verticals, such as micro-manufacturing and additive manufacturing.
- Integration of extended reality (XR) technologies for improved training and remote collaboration.
- Increased focus on sustainability and environmentally friendly manufacturing processes.
Growth Accelerators in the Computer Aided Manufacturing Industry Industry
The long-term growth of the CAM market will be fueled by continuous technological breakthroughs, strategic partnerships between software providers and manufacturing equipment suppliers, and expansion into new geographic markets. The growing adoption of cloud-based solutions and the integration of artificial intelligence will drive efficiency gains and enhance the capabilities of CAM software.
Key Players Shaping the Computer Aided Manufacturing Industry Market
- Dassault Systèmes
- PTC
- MecSoft Corporation
- Hexagon AB
- NTT DATA Corporation
- Siemens AG
- SolidCAM Ltd
- OPEN MIND Technologies AG
- Autodesk Inc
- 3D Systems Inc
- BobCAD-CAM
- SmartCAMcnc
- ZWSOFTCO LTD (Guangzhou)
- HCL Technologies Limited
- CNC Software LLC (Mastercam)
Notable Milestones in Computer Aided Manufacturing Industry Sector
- November 2023: Microlight3D launched Luminis software, a CAM software designed for microFAB-3D, enabling 3D printing of objects 100x smaller than a hair strand. This signals a significant advancement in micro-manufacturing capabilities.
- May 2023: NVIDIA introduced NVIDIA Omniverse, integrating CAD apps, AI frameworks, and simulation tools, enabling virtual factory creation and digitalized manufacturing workflows. This significantly impacts workflow optimization and quality control.
In-Depth Computer Aided Manufacturing Industry Market Outlook
The future of the CAM market is bright, with significant growth potential driven by technological innovation and increasing industry adoption. Strategic partnerships, expansion into new markets, and a continued focus on software development will shape the competitive landscape. The market's expansion into emerging areas, like micro-manufacturing and additive manufacturing, alongside the integration of AI and other advanced technologies, will drive further growth and create new opportunities for both established players and emerging innovators.
Computer Aided Manufacturing Industry Segmentation
-
1. Deployment Model
- 1.1. On-Premises
- 1.2. Cloud-Based
-
2. End-User Industry
- 2.1. Aerospace & Defense
- 2.2. Automotive
- 2.3. Medical
- 2.4. Energy & Utilities
- 2.5. Other End-User Industries
Computer Aided Manufacturing Industry Segmentation By Geography
-
1. North America
- 1.1. United States
- 1.2. Canada
-
2. Europe
- 2.1. Germany
- 2.2. Switzerland
- 2.3. Spain
- 2.4. Austria
- 2.5. Belgium
- 2.6. Netherlands
- 2.7. United Kingdom
- 2.8. France
- 2.9. Italy
- 2.10. Sweden
- 2.11. Poland
-
3. Asia
- 3.1. China
- 3.2. Japan
- 3.3. South Korea
- 3.4. India
- 4. Australia and New Zealand
-
5. Latin America
- 5.1. Brazil
- 5.2. Mexico
-
6. Middle East and Africa
- 6.1. United Arab Emirates
- 6.2. Saudi Arabia
- 6.3. South Africa
Computer Aided Manufacturing Industry REPORT HIGHLIGHTS
| Aspects | Details |
|---|---|
| Study Period | 2019-2033 |
| Base Year | 2024 |
| Estimated Year | 2025 |
| Forecast Period | 2025-2033 |
| Historical Period | 2019-2024 |
| Growth Rate | CAGR of 8.13% from 2019-2033 |
| Segmentation |
|
Table of Contents
- 1. Introduction
- 1.1. Research Scope
- 1.2. Market Segmentation
- 1.3. Research Methodology
- 1.4. Definitions and Assumptions
- 2. Executive Summary
- 2.1. Introduction
- 3. Market Dynamics
- 3.1. Introduction
- 3.2. Market Drivers
- 3.2.1. Increasing Adoption of Industry 4.; Growing Utilization of CAM Software in the Packaging Machinery Sector
- 3.3. Market Restrains
- 3.3.1. Wide Availability of Open Source CAM Software
- 3.4. Market Trends
- 3.4.1. Automotive is Expected to Hold a Major Market Share
- 4. Market Factor Analysis
- 4.1. Porters Five Forces
- 4.2. Supply/Value Chain
- 4.3. PESTEL analysis
- 4.4. Market Entropy
- 4.5. Patent/Trademark Analysis
- 5. Global Computer Aided Manufacturing Industry Analysis, Insights and Forecast, 2019-2031
- 5.1. Market Analysis, Insights and Forecast - by Deployment Model
- 5.1.1. On-Premises
- 5.1.2. Cloud-Based
- 5.2. Market Analysis, Insights and Forecast - by End-User Industry
- 5.2.1. Aerospace & Defense
- 5.2.2. Automotive
- 5.2.3. Medical
- 5.2.4. Energy & Utilities
- 5.2.5. Other End-User Industries
- 5.3. Market Analysis, Insights and Forecast - by Region
- 5.3.1. North America
- 5.3.2. Europe
- 5.3.3. Asia
- 5.3.4. Australia and New Zealand
- 5.3.5. Latin America
- 5.3.6. Middle East and Africa
- 5.1. Market Analysis, Insights and Forecast - by Deployment Model
- 6. North America Computer Aided Manufacturing Industry Analysis, Insights and Forecast, 2019-2031
- 6.1. Market Analysis, Insights and Forecast - by Deployment Model
- 6.1.1. On-Premises
- 6.1.2. Cloud-Based
- 6.2. Market Analysis, Insights and Forecast - by End-User Industry
- 6.2.1. Aerospace & Defense
- 6.2.2. Automotive
- 6.2.3. Medical
- 6.2.4. Energy & Utilities
- 6.2.5. Other End-User Industries
- 6.1. Market Analysis, Insights and Forecast - by Deployment Model
- 7. Europe Computer Aided Manufacturing Industry Analysis, Insights and Forecast, 2019-2031
- 7.1. Market Analysis, Insights and Forecast - by Deployment Model
- 7.1.1. On-Premises
- 7.1.2. Cloud-Based
- 7.2. Market Analysis, Insights and Forecast - by End-User Industry
- 7.2.1. Aerospace & Defense
- 7.2.2. Automotive
- 7.2.3. Medical
- 7.2.4. Energy & Utilities
- 7.2.5. Other End-User Industries
- 7.1. Market Analysis, Insights and Forecast - by Deployment Model
- 8. Asia Computer Aided Manufacturing Industry Analysis, Insights and Forecast, 2019-2031
- 8.1. Market Analysis, Insights and Forecast - by Deployment Model
- 8.1.1. On-Premises
- 8.1.2. Cloud-Based
- 8.2. Market Analysis, Insights and Forecast - by End-User Industry
- 8.2.1. Aerospace & Defense
- 8.2.2. Automotive
- 8.2.3. Medical
- 8.2.4. Energy & Utilities
- 8.2.5. Other End-User Industries
- 8.1. Market Analysis, Insights and Forecast - by Deployment Model
- 9. Australia and New Zealand Computer Aided Manufacturing Industry Analysis, Insights and Forecast, 2019-2031
- 9.1. Market Analysis, Insights and Forecast - by Deployment Model
- 9.1.1. On-Premises
- 9.1.2. Cloud-Based
- 9.2. Market Analysis, Insights and Forecast - by End-User Industry
- 9.2.1. Aerospace & Defense
- 9.2.2. Automotive
- 9.2.3. Medical
- 9.2.4. Energy & Utilities
- 9.2.5. Other End-User Industries
- 9.1. Market Analysis, Insights and Forecast - by Deployment Model
- 10. Latin America Computer Aided Manufacturing Industry Analysis, Insights and Forecast, 2019-2031
- 10.1. Market Analysis, Insights and Forecast - by Deployment Model
- 10.1.1. On-Premises
- 10.1.2. Cloud-Based
- 10.2. Market Analysis, Insights and Forecast - by End-User Industry
- 10.2.1. Aerospace & Defense
- 10.2.2. Automotive
- 10.2.3. Medical
- 10.2.4. Energy & Utilities
- 10.2.5. Other End-User Industries
- 10.1. Market Analysis, Insights and Forecast - by Deployment Model
- 11. Middle East and Africa Computer Aided Manufacturing Industry Analysis, Insights and Forecast, 2019-2031
- 11.1. Market Analysis, Insights and Forecast - by Deployment Model
- 11.1.1. On-Premises
- 11.1.2. Cloud-Based
- 11.2. Market Analysis, Insights and Forecast - by End-User Industry
- 11.2.1. Aerospace & Defense
- 11.2.2. Automotive
- 11.2.3. Medical
- 11.2.4. Energy & Utilities
- 11.2.5. Other End-User Industries
- 11.1. Market Analysis, Insights and Forecast - by Deployment Model
- 12. North America Computer Aided Manufacturing Industry Analysis, Insights and Forecast, 2019-2031
- 12.1. Market Analysis, Insights and Forecast - By Country/Sub-region
- 12.1.1 United States
- 12.1.2 Canada
- 12.1.3 Mexico
- 13. Europe Computer Aided Manufacturing Industry Analysis, Insights and Forecast, 2019-2031
- 13.1. Market Analysis, Insights and Forecast - By Country/Sub-region
- 13.1.1 Germany
- 13.1.2 United Kingdom
- 13.1.3 France
- 13.1.4 Spain
- 13.1.5 Italy
- 13.1.6 Spain
- 13.1.7 Belgium
- 13.1.8 Netherland
- 13.1.9 Nordics
- 13.1.10 Rest of Europe
- 14. Asia Pacific Computer Aided Manufacturing Industry Analysis, Insights and Forecast, 2019-2031
- 14.1. Market Analysis, Insights and Forecast - By Country/Sub-region
- 14.1.1 China
- 14.1.2 Japan
- 14.1.3 India
- 14.1.4 South Korea
- 14.1.5 Southeast Asia
- 14.1.6 Australia
- 14.1.7 Indonesia
- 14.1.8 Phillipes
- 14.1.9 Singapore
- 14.1.10 Thailandc
- 14.1.11 Rest of Asia Pacific
- 15. South America Computer Aided Manufacturing Industry Analysis, Insights and Forecast, 2019-2031
- 15.1. Market Analysis, Insights and Forecast - By Country/Sub-region
- 15.1.1 Brazil
- 15.1.2 Argentina
- 15.1.3 Peru
- 15.1.4 Chile
- 15.1.5 Colombia
- 15.1.6 Ecuador
- 15.1.7 Venezuela
- 15.1.8 Rest of South America
- 16. North America Computer Aided Manufacturing Industry Analysis, Insights and Forecast, 2019-2031
- 16.1. Market Analysis, Insights and Forecast - By Country/Sub-region
- 16.1.1 United States
- 16.1.2 Canada
- 16.1.3 Mexico
- 17. MEA Computer Aided Manufacturing Industry Analysis, Insights and Forecast, 2019-2031
- 17.1. Market Analysis, Insights and Forecast - By Country/Sub-region
- 17.1.1 United Arab Emirates
- 17.1.2 Saudi Arabia
- 17.1.3 South Africa
- 17.1.4 Rest of Middle East and Africa
- 18. Competitive Analysis
- 18.1. Global Market Share Analysis 2024
- 18.2. Company Profiles
- 18.2.1 Dassault Systems
- 18.2.1.1. Overview
- 18.2.1.2. Products
- 18.2.1.3. SWOT Analysis
- 18.2.1.4. Recent Developments
- 18.2.1.5. Financials (Based on Availability)
- 18.2.2 PTC
- 18.2.2.1. Overview
- 18.2.2.2. Products
- 18.2.2.3. SWOT Analysis
- 18.2.2.4. Recent Developments
- 18.2.2.5. Financials (Based on Availability)
- 18.2.3 MecSoft Corporation
- 18.2.3.1. Overview
- 18.2.3.2. Products
- 18.2.3.3. SWOT Analysis
- 18.2.3.4. Recent Developments
- 18.2.3.5. Financials (Based on Availability)
- 18.2.4 Hexagon AB
- 18.2.4.1. Overview
- 18.2.4.2. Products
- 18.2.4.3. SWOT Analysis
- 18.2.4.4. Recent Developments
- 18.2.4.5. Financials (Based on Availability)
- 18.2.5 NTT DATA Corporation
- 18.2.5.1. Overview
- 18.2.5.2. Products
- 18.2.5.3. SWOT Analysis
- 18.2.5.4. Recent Developments
- 18.2.5.5. Financials (Based on Availability)
- 18.2.6 Siemens AG
- 18.2.6.1. Overview
- 18.2.6.2. Products
- 18.2.6.3. SWOT Analysis
- 18.2.6.4. Recent Developments
- 18.2.6.5. Financials (Based on Availability)
- 18.2.7 SolidCAM Ltd
- 18.2.7.1. Overview
- 18.2.7.2. Products
- 18.2.7.3. SWOT Analysis
- 18.2.7.4. Recent Developments
- 18.2.7.5. Financials (Based on Availability)
- 18.2.8 OPEN MIND Technologies AG
- 18.2.8.1. Overview
- 18.2.8.2. Products
- 18.2.8.3. SWOT Analysis
- 18.2.8.4. Recent Developments
- 18.2.8.5. Financials (Based on Availability)
- 18.2.9 Autodesk Inc
- 18.2.9.1. Overview
- 18.2.9.2. Products
- 18.2.9.3. SWOT Analysis
- 18.2.9.4. Recent Developments
- 18.2.9.5. Financials (Based on Availability)
- 18.2.10 3D Systems Inc
- 18.2.10.1. Overview
- 18.2.10.2. Products
- 18.2.10.3. SWOT Analysis
- 18.2.10.4. Recent Developments
- 18.2.10.5. Financials (Based on Availability)
- 18.2.11 BobCAD-CAM
- 18.2.11.1. Overview
- 18.2.11.2. Products
- 18.2.11.3. SWOT Analysis
- 18.2.11.4. Recent Developments
- 18.2.11.5. Financials (Based on Availability)
- 18.2.12 SmartCAMcnc
- 18.2.12.1. Overview
- 18.2.12.2. Products
- 18.2.12.3. SWOT Analysis
- 18.2.12.4. Recent Developments
- 18.2.12.5. Financials (Based on Availability)
- 18.2.13 ZWSOFTCO LTD (Guangzhou)
- 18.2.13.1. Overview
- 18.2.13.2. Products
- 18.2.13.3. SWOT Analysis
- 18.2.13.4. Recent Developments
- 18.2.13.5. Financials (Based on Availability)
- 18.2.14 HCL Technologies Limited
- 18.2.14.1. Overview
- 18.2.14.2. Products
- 18.2.14.3. SWOT Analysis
- 18.2.14.4. Recent Developments
- 18.2.14.5. Financials (Based on Availability)
- 18.2.15 CNC Software LLC (Mastercam)
- 18.2.15.1. Overview
- 18.2.15.2. Products
- 18.2.15.3. SWOT Analysis
- 18.2.15.4. Recent Developments
- 18.2.15.5. Financials (Based on Availability)
- 18.2.1 Dassault Systems
List of Figures
- Figure 1: Global Computer Aided Manufacturing Industry Revenue Breakdown (Million, %) by Region 2024 & 2032
- Figure 2: North America Computer Aided Manufacturing Industry Revenue (Million), by Country 2024 & 2032
- Figure 3: North America Computer Aided Manufacturing Industry Revenue Share (%), by Country 2024 & 2032
- Figure 4: Europe Computer Aided Manufacturing Industry Revenue (Million), by Country 2024 & 2032
- Figure 5: Europe Computer Aided Manufacturing Industry Revenue Share (%), by Country 2024 & 2032
- Figure 6: Asia Pacific Computer Aided Manufacturing Industry Revenue (Million), by Country 2024 & 2032
- Figure 7: Asia Pacific Computer Aided Manufacturing Industry Revenue Share (%), by Country 2024 & 2032
- Figure 8: South America Computer Aided Manufacturing Industry Revenue (Million), by Country 2024 & 2032
- Figure 9: South America Computer Aided Manufacturing Industry Revenue Share (%), by Country 2024 & 2032
- Figure 10: North America Computer Aided Manufacturing Industry Revenue (Million), by Country 2024 & 2032
- Figure 11: North America Computer Aided Manufacturing Industry Revenue Share (%), by Country 2024 & 2032
- Figure 12: MEA Computer Aided Manufacturing Industry Revenue (Million), by Country 2024 & 2032
- Figure 13: MEA Computer Aided Manufacturing Industry Revenue Share (%), by Country 2024 & 2032
- Figure 14: North America Computer Aided Manufacturing Industry Revenue (Million), by Deployment Model 2024 & 2032
- Figure 15: North America Computer Aided Manufacturing Industry Revenue Share (%), by Deployment Model 2024 & 2032
- Figure 16: North America Computer Aided Manufacturing Industry Revenue (Million), by End-User Industry 2024 & 2032
- Figure 17: North America Computer Aided Manufacturing Industry Revenue Share (%), by End-User Industry 2024 & 2032
- Figure 18: North America Computer Aided Manufacturing Industry Revenue (Million), by Country 2024 & 2032
- Figure 19: North America Computer Aided Manufacturing Industry Revenue Share (%), by Country 2024 & 2032
- Figure 20: Europe Computer Aided Manufacturing Industry Revenue (Million), by Deployment Model 2024 & 2032
- Figure 21: Europe Computer Aided Manufacturing Industry Revenue Share (%), by Deployment Model 2024 & 2032
- Figure 22: Europe Computer Aided Manufacturing Industry Revenue (Million), by End-User Industry 2024 & 2032
- Figure 23: Europe Computer Aided Manufacturing Industry Revenue Share (%), by End-User Industry 2024 & 2032
- Figure 24: Europe Computer Aided Manufacturing Industry Revenue (Million), by Country 2024 & 2032
- Figure 25: Europe Computer Aided Manufacturing Industry Revenue Share (%), by Country 2024 & 2032
- Figure 26: Asia Computer Aided Manufacturing Industry Revenue (Million), by Deployment Model 2024 & 2032
- Figure 27: Asia Computer Aided Manufacturing Industry Revenue Share (%), by Deployment Model 2024 & 2032
- Figure 28: Asia Computer Aided Manufacturing Industry Revenue (Million), by End-User Industry 2024 & 2032
- Figure 29: Asia Computer Aided Manufacturing Industry Revenue Share (%), by End-User Industry 2024 & 2032
- Figure 30: Asia Computer Aided Manufacturing Industry Revenue (Million), by Country 2024 & 2032
- Figure 31: Asia Computer Aided Manufacturing Industry Revenue Share (%), by Country 2024 & 2032
- Figure 32: Australia and New Zealand Computer Aided Manufacturing Industry Revenue (Million), by Deployment Model 2024 & 2032
- Figure 33: Australia and New Zealand Computer Aided Manufacturing Industry Revenue Share (%), by Deployment Model 2024 & 2032
- Figure 34: Australia and New Zealand Computer Aided Manufacturing Industry Revenue (Million), by End-User Industry 2024 & 2032
- Figure 35: Australia and New Zealand Computer Aided Manufacturing Industry Revenue Share (%), by End-User Industry 2024 & 2032
- Figure 36: Australia and New Zealand Computer Aided Manufacturing Industry Revenue (Million), by Country 2024 & 2032
- Figure 37: Australia and New Zealand Computer Aided Manufacturing Industry Revenue Share (%), by Country 2024 & 2032
- Figure 38: Latin America Computer Aided Manufacturing Industry Revenue (Million), by Deployment Model 2024 & 2032
- Figure 39: Latin America Computer Aided Manufacturing Industry Revenue Share (%), by Deployment Model 2024 & 2032
- Figure 40: Latin America Computer Aided Manufacturing Industry Revenue (Million), by End-User Industry 2024 & 2032
- Figure 41: Latin America Computer Aided Manufacturing Industry Revenue Share (%), by End-User Industry 2024 & 2032
- Figure 42: Latin America Computer Aided Manufacturing Industry Revenue (Million), by Country 2024 & 2032
- Figure 43: Latin America Computer Aided Manufacturing Industry Revenue Share (%), by Country 2024 & 2032
- Figure 44: Middle East and Africa Computer Aided Manufacturing Industry Revenue (Million), by Deployment Model 2024 & 2032
- Figure 45: Middle East and Africa Computer Aided Manufacturing Industry Revenue Share (%), by Deployment Model 2024 & 2032
- Figure 46: Middle East and Africa Computer Aided Manufacturing Industry Revenue (Million), by End-User Industry 2024 & 2032
- Figure 47: Middle East and Africa Computer Aided Manufacturing Industry Revenue Share (%), by End-User Industry 2024 & 2032
- Figure 48: Middle East and Africa Computer Aided Manufacturing Industry Revenue (Million), by Country 2024 & 2032
- Figure 49: Middle East and Africa Computer Aided Manufacturing Industry Revenue Share (%), by Country 2024 & 2032
List of Tables
- Table 1: Global Computer Aided Manufacturing Industry Revenue Million Forecast, by Region 2019 & 2032
- Table 2: Global Computer Aided Manufacturing Industry Revenue Million Forecast, by Deployment Model 2019 & 2032
- Table 3: Global Computer Aided Manufacturing Industry Revenue Million Forecast, by End-User Industry 2019 & 2032
- Table 4: Global Computer Aided Manufacturing Industry Revenue Million Forecast, by Region 2019 & 2032
- Table 5: Global Computer Aided Manufacturing Industry Revenue Million Forecast, by Country 2019 & 2032
- Table 6: United States Computer Aided Manufacturing Industry Revenue (Million) Forecast, by Application 2019 & 2032
- Table 7: Canada Computer Aided Manufacturing Industry Revenue (Million) Forecast, by Application 2019 & 2032
- Table 8: Mexico Computer Aided Manufacturing Industry Revenue (Million) Forecast, by Application 2019 & 2032
- Table 9: Global Computer Aided Manufacturing Industry Revenue Million Forecast, by Country 2019 & 2032
- Table 10: Germany Computer Aided Manufacturing Industry Revenue (Million) Forecast, by Application 2019 & 2032
- Table 11: United Kingdom Computer Aided Manufacturing Industry Revenue (Million) Forecast, by Application 2019 & 2032
- Table 12: France Computer Aided Manufacturing Industry Revenue (Million) Forecast, by Application 2019 & 2032
- Table 13: Spain Computer Aided Manufacturing Industry Revenue (Million) Forecast, by Application 2019 & 2032
- Table 14: Italy Computer Aided Manufacturing Industry Revenue (Million) Forecast, by Application 2019 & 2032
- Table 15: Spain Computer Aided Manufacturing Industry Revenue (Million) Forecast, by Application 2019 & 2032
- Table 16: Belgium Computer Aided Manufacturing Industry Revenue (Million) Forecast, by Application 2019 & 2032
- Table 17: Netherland Computer Aided Manufacturing Industry Revenue (Million) Forecast, by Application 2019 & 2032
- Table 18: Nordics Computer Aided Manufacturing Industry Revenue (Million) Forecast, by Application 2019 & 2032
- Table 19: Rest of Europe Computer Aided Manufacturing Industry Revenue (Million) Forecast, by Application 2019 & 2032
- Table 20: Global Computer Aided Manufacturing Industry Revenue Million Forecast, by Country 2019 & 2032
- Table 21: China Computer Aided Manufacturing Industry Revenue (Million) Forecast, by Application 2019 & 2032
- Table 22: Japan Computer Aided Manufacturing Industry Revenue (Million) Forecast, by Application 2019 & 2032
- Table 23: India Computer Aided Manufacturing Industry Revenue (Million) Forecast, by Application 2019 & 2032
- Table 24: South Korea Computer Aided Manufacturing Industry Revenue (Million) Forecast, by Application 2019 & 2032
- Table 25: Southeast Asia Computer Aided Manufacturing Industry Revenue (Million) Forecast, by Application 2019 & 2032
- Table 26: Australia Computer Aided Manufacturing Industry Revenue (Million) Forecast, by Application 2019 & 2032
- Table 27: Indonesia Computer Aided Manufacturing Industry Revenue (Million) Forecast, by Application 2019 & 2032
- Table 28: Phillipes Computer Aided Manufacturing Industry Revenue (Million) Forecast, by Application 2019 & 2032
- Table 29: Singapore Computer Aided Manufacturing Industry Revenue (Million) Forecast, by Application 2019 & 2032
- Table 30: Thailandc Computer Aided Manufacturing Industry Revenue (Million) Forecast, by Application 2019 & 2032
- Table 31: Rest of Asia Pacific Computer Aided Manufacturing Industry Revenue (Million) Forecast, by Application 2019 & 2032
- Table 32: Global Computer Aided Manufacturing Industry Revenue Million Forecast, by Country 2019 & 2032
- Table 33: Brazil Computer Aided Manufacturing Industry Revenue (Million) Forecast, by Application 2019 & 2032
- Table 34: Argentina Computer Aided Manufacturing Industry Revenue (Million) Forecast, by Application 2019 & 2032
- Table 35: Peru Computer Aided Manufacturing Industry Revenue (Million) Forecast, by Application 2019 & 2032
- Table 36: Chile Computer Aided Manufacturing Industry Revenue (Million) Forecast, by Application 2019 & 2032
- Table 37: Colombia Computer Aided Manufacturing Industry Revenue (Million) Forecast, by Application 2019 & 2032
- Table 38: Ecuador Computer Aided Manufacturing Industry Revenue (Million) Forecast, by Application 2019 & 2032
- Table 39: Venezuela Computer Aided Manufacturing Industry Revenue (Million) Forecast, by Application 2019 & 2032
- Table 40: Rest of South America Computer Aided Manufacturing Industry Revenue (Million) Forecast, by Application 2019 & 2032
- Table 41: Global Computer Aided Manufacturing Industry Revenue Million Forecast, by Country 2019 & 2032
- Table 42: United States Computer Aided Manufacturing Industry Revenue (Million) Forecast, by Application 2019 & 2032
- Table 43: Canada Computer Aided Manufacturing Industry Revenue (Million) Forecast, by Application 2019 & 2032
- Table 44: Mexico Computer Aided Manufacturing Industry Revenue (Million) Forecast, by Application 2019 & 2032
- Table 45: Global Computer Aided Manufacturing Industry Revenue Million Forecast, by Country 2019 & 2032
- Table 46: United Arab Emirates Computer Aided Manufacturing Industry Revenue (Million) Forecast, by Application 2019 & 2032
- Table 47: Saudi Arabia Computer Aided Manufacturing Industry Revenue (Million) Forecast, by Application 2019 & 2032
- Table 48: South Africa Computer Aided Manufacturing Industry Revenue (Million) Forecast, by Application 2019 & 2032
- Table 49: Rest of Middle East and Africa Computer Aided Manufacturing Industry Revenue (Million) Forecast, by Application 2019 & 2032
- Table 50: Global Computer Aided Manufacturing Industry Revenue Million Forecast, by Deployment Model 2019 & 2032
- Table 51: Global Computer Aided Manufacturing Industry Revenue Million Forecast, by End-User Industry 2019 & 2032
- Table 52: Global Computer Aided Manufacturing Industry Revenue Million Forecast, by Country 2019 & 2032
- Table 53: United States Computer Aided Manufacturing Industry Revenue (Million) Forecast, by Application 2019 & 2032
- Table 54: Canada Computer Aided Manufacturing Industry Revenue (Million) Forecast, by Application 2019 & 2032
- Table 55: Global Computer Aided Manufacturing Industry Revenue Million Forecast, by Deployment Model 2019 & 2032
- Table 56: Global Computer Aided Manufacturing Industry Revenue Million Forecast, by End-User Industry 2019 & 2032
- Table 57: Global Computer Aided Manufacturing Industry Revenue Million Forecast, by Country 2019 & 2032
- Table 58: Germany Computer Aided Manufacturing Industry Revenue (Million) Forecast, by Application 2019 & 2032
- Table 59: Switzerland Computer Aided Manufacturing Industry Revenue (Million) Forecast, by Application 2019 & 2032
- Table 60: Spain Computer Aided Manufacturing Industry Revenue (Million) Forecast, by Application 2019 & 2032
- Table 61: Austria Computer Aided Manufacturing Industry Revenue (Million) Forecast, by Application 2019 & 2032
- Table 62: Belgium Computer Aided Manufacturing Industry Revenue (Million) Forecast, by Application 2019 & 2032
- Table 63: Netherlands Computer Aided Manufacturing Industry Revenue (Million) Forecast, by Application 2019 & 2032
- Table 64: United Kingdom Computer Aided Manufacturing Industry Revenue (Million) Forecast, by Application 2019 & 2032
- Table 65: France Computer Aided Manufacturing Industry Revenue (Million) Forecast, by Application 2019 & 2032
- Table 66: Italy Computer Aided Manufacturing Industry Revenue (Million) Forecast, by Application 2019 & 2032
- Table 67: Sweden Computer Aided Manufacturing Industry Revenue (Million) Forecast, by Application 2019 & 2032
- Table 68: Poland Computer Aided Manufacturing Industry Revenue (Million) Forecast, by Application 2019 & 2032
- Table 69: Global Computer Aided Manufacturing Industry Revenue Million Forecast, by Deployment Model 2019 & 2032
- Table 70: Global Computer Aided Manufacturing Industry Revenue Million Forecast, by End-User Industry 2019 & 2032
- Table 71: Global Computer Aided Manufacturing Industry Revenue Million Forecast, by Country 2019 & 2032
- Table 72: China Computer Aided Manufacturing Industry Revenue (Million) Forecast, by Application 2019 & 2032
- Table 73: Japan Computer Aided Manufacturing Industry Revenue (Million) Forecast, by Application 2019 & 2032
- Table 74: South Korea Computer Aided Manufacturing Industry Revenue (Million) Forecast, by Application 2019 & 2032
- Table 75: India Computer Aided Manufacturing Industry Revenue (Million) Forecast, by Application 2019 & 2032
- Table 76: Global Computer Aided Manufacturing Industry Revenue Million Forecast, by Deployment Model 2019 & 2032
- Table 77: Global Computer Aided Manufacturing Industry Revenue Million Forecast, by End-User Industry 2019 & 2032
- Table 78: Global Computer Aided Manufacturing Industry Revenue Million Forecast, by Country 2019 & 2032
- Table 79: Global Computer Aided Manufacturing Industry Revenue Million Forecast, by Deployment Model 2019 & 2032
- Table 80: Global Computer Aided Manufacturing Industry Revenue Million Forecast, by End-User Industry 2019 & 2032
- Table 81: Global Computer Aided Manufacturing Industry Revenue Million Forecast, by Country 2019 & 2032
- Table 82: Brazil Computer Aided Manufacturing Industry Revenue (Million) Forecast, by Application 2019 & 2032
- Table 83: Mexico Computer Aided Manufacturing Industry Revenue (Million) Forecast, by Application 2019 & 2032
- Table 84: Global Computer Aided Manufacturing Industry Revenue Million Forecast, by Deployment Model 2019 & 2032
- Table 85: Global Computer Aided Manufacturing Industry Revenue Million Forecast, by End-User Industry 2019 & 2032
- Table 86: Global Computer Aided Manufacturing Industry Revenue Million Forecast, by Country 2019 & 2032
- Table 87: United Arab Emirates Computer Aided Manufacturing Industry Revenue (Million) Forecast, by Application 2019 & 2032
- Table 88: Saudi Arabia Computer Aided Manufacturing Industry Revenue (Million) Forecast, by Application 2019 & 2032
- Table 89: South Africa Computer Aided Manufacturing Industry Revenue (Million) Forecast, by Application 2019 & 2032
Frequently Asked Questions
1. What is the projected Compound Annual Growth Rate (CAGR) of the Computer Aided Manufacturing Industry?
The projected CAGR is approximately 8.13%.
2. Which companies are prominent players in the Computer Aided Manufacturing Industry?
Key companies in the market include Dassault Systems, PTC, MecSoft Corporation, Hexagon AB, NTT DATA Corporation, Siemens AG, SolidCAM Ltd, OPEN MIND Technologies AG, Autodesk Inc, 3D Systems Inc, BobCAD-CAM, SmartCAMcnc , ZWSOFTCO LTD (Guangzhou), HCL Technologies Limited, CNC Software LLC (Mastercam).
3. What are the main segments of the Computer Aided Manufacturing Industry?
The market segments include Deployment Model, End-User Industry.
4. Can you provide details about the market size?
The market size is estimated to be USD 3.94 Million as of 2022.
5. What are some drivers contributing to market growth?
Increasing Adoption of Industry 4.; Growing Utilization of CAM Software in the Packaging Machinery Sector.
6. What are the notable trends driving market growth?
Automotive is Expected to Hold a Major Market Share.
7. Are there any restraints impacting market growth?
Wide Availability of Open Source CAM Software.
8. Can you provide examples of recent developments in the market?
November 2023 - Microlight3D launched Luminis software, a computer-aided manufacturing (CAM) software built explicitly for the microFAB-3D. Luminis combines the ability to prepare objects for printing and control the printer, aiding to 3D print objects to 100× smaller than a strand of hair. Luminis features 3D visualization for the capturing of 40 fps - 60 fps data under the same load. The software enables printing prototypes of technologies used in micro-robotics, microfluidics, micro-optics, and cell culture and tissue engineering.
9. What pricing options are available for accessing the report?
Pricing options include single-user, multi-user, and enterprise licenses priced at USD 4750, USD 5250, and USD 8750 respectively.
10. Is the market size provided in terms of value or volume?
The market size is provided in terms of value, measured in Million.
11. Are there any specific market keywords associated with the report?
Yes, the market keyword associated with the report is "Computer Aided Manufacturing Industry," which aids in identifying and referencing the specific market segment covered.
12. How do I determine which pricing option suits my needs best?
The pricing options vary based on user requirements and access needs. Individual users may opt for single-user licenses, while businesses requiring broader access may choose multi-user or enterprise licenses for cost-effective access to the report.
13. Are there any additional resources or data provided in the Computer Aided Manufacturing Industry report?
While the report offers comprehensive insights, it's advisable to review the specific contents or supplementary materials provided to ascertain if additional resources or data are available.
14. How can I stay updated on further developments or reports in the Computer Aided Manufacturing Industry?
To stay informed about further developments, trends, and reports in the Computer Aided Manufacturing Industry, consider subscribing to industry newsletters, following relevant companies and organizations, or regularly checking reputable industry news sources and publications.
Methodology
Step 1 - Identification of Relevant Samples Size from Population Database


Step 2 - Approaches for Defining Global Market Size (Value, Volume* & Price*)

Note*: In applicable scenarios
Step 3 - Data Sources
Primary Research
- Web Analytics
- Survey Reports
- Research Institute
- Latest Research Reports
- Opinion Leaders
Secondary Research
- Annual Reports
- White Paper
- Latest Press Release
- Industry Association
- Paid Database
- Investor Presentations

Step 4 - Data Triangulation
Involves using different sources of information in order to increase the validity of a study
These sources are likely to be stakeholders in a program - participants, other researchers, program staff, other community members, and so on.
Then we put all data in single framework & apply various statistical tools to find out the dynamic on the market.
During the analysis stage, feedback from the stakeholder groups would be compared to determine areas of agreement as well as areas of divergence


