
Key Insights
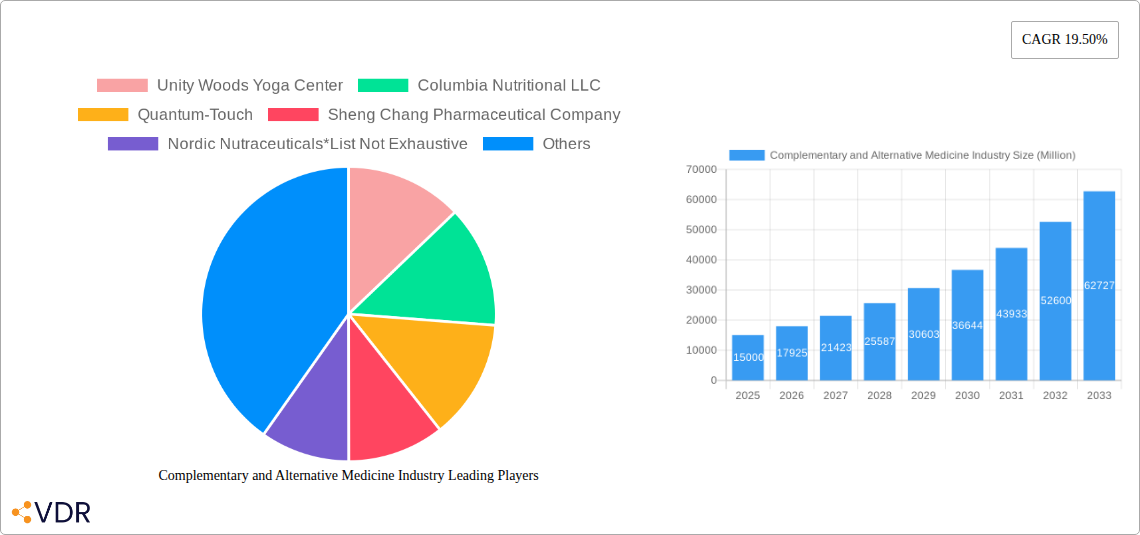
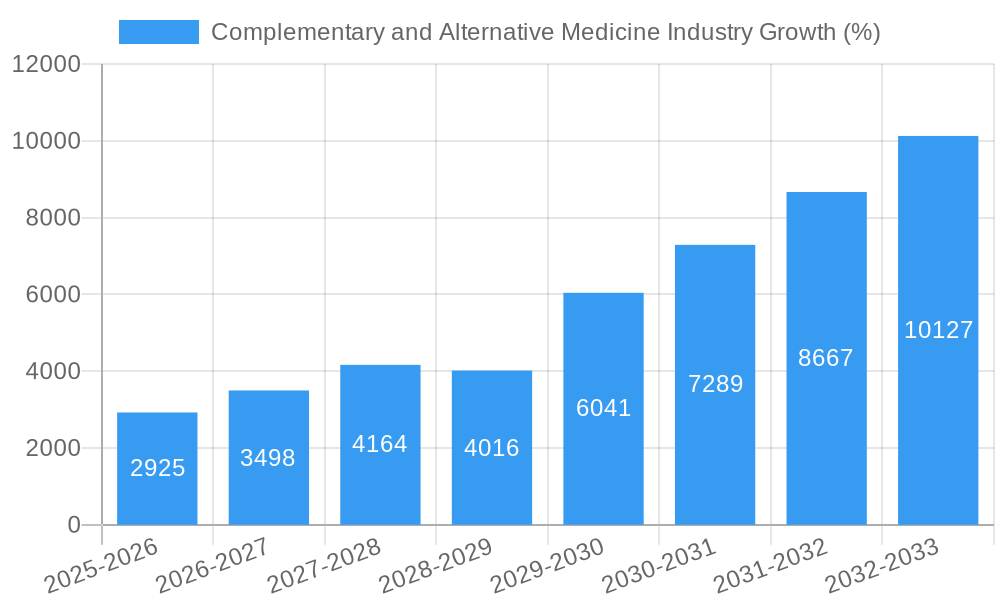
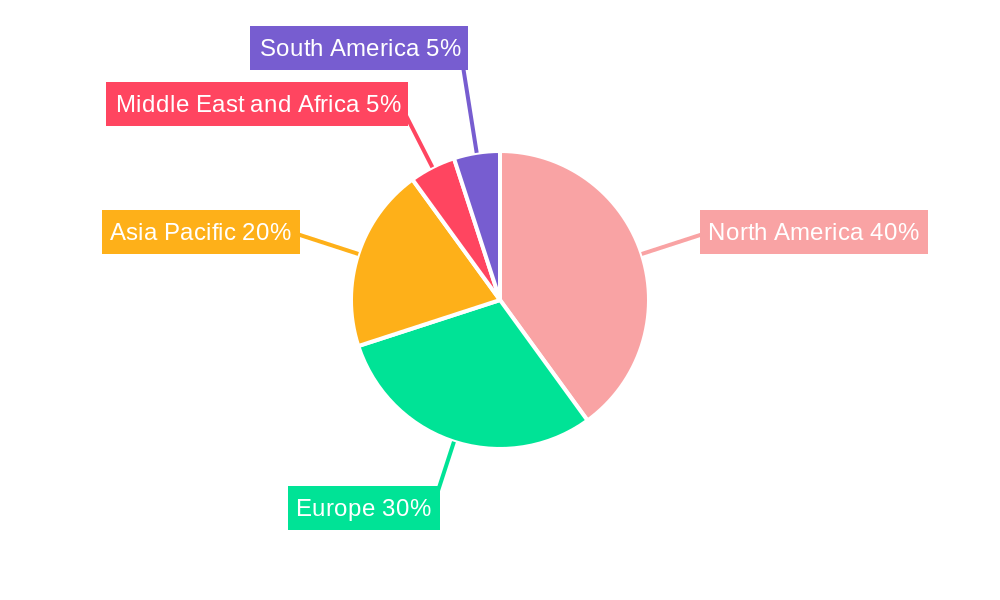
The Complementary and Alternative Medicine (CAM) industry is experiencing robust growth, projected at a Compound Annual Growth Rate (CAGR) of 19.50% from 2025 to 2033. This expansion is fueled by several key drivers. Rising prevalence of chronic diseases like arthritis, cancer, diabetes, and cardiovascular conditions, coupled with increasing dissatisfaction with conventional treatments and a growing preference for holistic approaches, are significantly boosting demand. Furthermore, the increasing availability of CAM therapies through diverse distribution channels, including direct sales, online platforms, and distance correspondence programs, is expanding market reach. The segment encompassing traditional alternative therapeutics holds a significant market share, reflecting a strong consumer preference for established practices. Mind and body therapies are also gaining traction, indicating a growing focus on mental and physical well-being. Geographic variations exist, with North America and Europe currently holding substantial market shares, though the Asia-Pacific region is expected to exhibit significant growth potential in the coming years driven by rising disposable incomes and increased awareness of CAM benefits. However, regulatory hurdles and inconsistent evidence-based support for certain therapies present restraints to market expansion. Further research and standardization are crucial for ensuring efficacy and safety, driving wider acceptance and promoting industry growth.
The market segmentation reveals diverse therapeutic approaches. Traditional alternative therapies, including herbal remedies and acupuncture, represent a substantial portion of the market, while the segments of body therapy (massage, chiropractic), mind therapy (yoga, meditation), and sensory therapy (aromatherapy) showcase expanding areas of interest and investment. The distribution channels reflect the evolving landscape of CAM access. Direct sales continue to be prominent, while the rapid growth of online sales and distance correspondence channels demonstrates the impact of digitalization on market access and convenience for consumers. Leading players in the industry include established companies specializing in nutraceuticals, herbal remedies, and yoga studios, highlighting the diverse nature of the CAM market and the range of consumer preferences. Future growth depends on ongoing innovation, regulatory clarity, and consumer education regarding the efficacy and safety of diverse CAM therapies.
Complementary and Alternative Medicine (CAM) Industry Market Report: 2019-2033
This comprehensive report provides a detailed analysis of the Complementary and Alternative Medicine (CAM) industry, encompassing market dynamics, growth trends, regional performance, product landscape, and key players. The report covers the period 2019-2033, with a focus on the forecast period 2025-2033, utilizing 2025 as the base year. The study delves into various segments including Traditional Alternative Therapeutics, Body Therapy, Mind Therapy, and Sensory Therapy, analyzing their performance across different application areas (Arthritis, Cancer, Diabetes, Cardiovascular, Neurology, Other) and distribution channels (Direct Sales, Online Sales, Distance Correspondence). This report is invaluable for industry professionals, investors, and researchers seeking a comprehensive understanding of this rapidly evolving market. The total market size in 2025 is estimated at xx Million.
Complementary and Alternative Medicine Industry Market Dynamics & Structure
The CAM industry is characterized by a fragmented market structure with a large number of small and medium-sized enterprises (SMEs) alongside larger players. Market concentration is low, with no single dominant player controlling a significant market share. Technological innovation, particularly in areas like digital therapeutics and personalized medicine, is a major driver. However, regulatory frameworks vary significantly across regions, creating challenges for standardization and market access. The industry also faces competition from conventional medicine, albeit often complementary rather than directly substitutive. End-user demographics are expanding, with increasing adoption across age groups and health conditions. M&A activity has been moderate, with a xx deals recorded in 2024, primarily focused on consolidation within specific segments.
- Market Concentration: Low, fragmented market with numerous SMEs.
- Technological Innovation: Significant driver, particularly in digital therapeutics and personalized medicine.
- Regulatory Framework: Varies significantly across regions, posing challenges for standardization.
- Competitive Substitutes: Conventional medicine often complements rather than directly competes.
- End-User Demographics: Expanding across age groups and health conditions.
- M&A Trends: Moderate activity, primarily focused on consolidation within segments; xx deals in 2024.
Complementary and Alternative Medicine Industry Growth Trends & Insights
The CAM market is experiencing robust growth, driven by increasing consumer awareness of holistic wellness and dissatisfaction with conventional healthcare approaches. The market size has exhibited a Compound Annual Growth Rate (CAGR) of xx% during the historical period (2019-2024) and is projected to reach xx Million by 2033, with a forecast CAGR of xx% (2025-2033). Technological disruptions, such as telehealth platforms and wearable health sensors, are facilitating access and personalized interventions. Consumer behavior shifts towards preventive healthcare and self-management of chronic conditions are further accelerating market growth. Market penetration varies widely across segments and regions, with higher penetration observed in developed countries.
Dominant Regions, Countries, or Segments in Complementary and Alternative Medicine Industry
North America currently holds the largest market share in the CAM industry, driven by high consumer spending on wellness products and services, favorable regulatory environments in certain areas, and a strong presence of established players. Within applications, the Arthritis segment is the largest, followed by Cancer and Cardiovascular health. Online sales are the fastest-growing distribution channel, reflecting increasing digital adoption.
- Leading Region: North America
- Dominant Application: Arthritis
- Fastest Growing Distribution Channel: Online Sales
- Key Drivers in North America: High consumer spending on wellness, favorable regulatory environment (in certain areas), and strong presence of established companies.
- Growth Potential: Significant growth potential exists in emerging markets, driven by rising disposable incomes and increasing health awareness.
Complementary and Alternative Medicine Industry Product Landscape
The CAM product landscape is diverse, encompassing traditional therapies like herbal medicine and acupuncture, alongside newer modalities such as aromatherapy and sound therapy. Product innovation focuses on improving efficacy, safety, and convenience. Recent examples include Adoratherapy's Alkemie Chakra Healing collection and Coworth Park's Hebridean sound treatment. These innovations highlight the increasing integration of technology and evidence-based practices within the CAM sector. Unique selling propositions often emphasize natural ingredients, holistic approaches, and personalized care.
Key Drivers, Barriers & Challenges in Complementary and Alternative Medicine Industry
Key Drivers:
- Rising consumer awareness of holistic wellness.
- Increasing prevalence of chronic diseases.
- Growing dissatisfaction with conventional medicine.
- Technological advancements in digital therapeutics and personalized medicine.
Key Challenges:
- Lack of standardized regulations and quality control in some areas.
- Difficulty in obtaining insurance coverage for CAM treatments.
- Competition from conventional medicine.
- Supply chain disruptions impacting the availability of raw materials (xx% impact estimated in 2024).
Emerging Opportunities in Complementary and Alternative Medicine Industry
- Integration of CAM with conventional medicine.
- Expansion into untapped markets in developing countries.
- Development of personalized CAM therapies.
- Growing demand for digital health solutions in CAM.
Growth Accelerators in the Complementary and Alternative Medicine Industry Industry
Strategic partnerships between CAM practitioners and conventional healthcare providers are key to growth, creating pathways for wider adoption and integration. Technological breakthroughs in areas like AI and machine learning are enhancing diagnostics and treatment personalization, fueling further market expansion.
Key Players Shaping the Complementary and Alternative Medicine Industry Market
- Unity Woods Yoga Center
- Columbia Nutritional LLC
- Quantum-Touch
- Sheng Chang Pharmaceutical Company
- Nordic Nutraceuticals
- Ramamani Iyengar Memorial Yoga Institute
- Pure encapsulations LLC
- Herb Pharm
- Yoga Tree Studios Inc
- John Schumacher Unity Woods Yoga Centre
- Healing Company Ltd
- Ayush Ayurvedic Pte Ltd
Notable Milestones in Complementary and Alternative Medicine Industry Sector
- December 2022: Adoratherapy launched its Alkemie Chakra Healing collection, expanding the aromatherapy market with diverse products.
- October 2022: Coworth Park introduced a Hebridean sound treatment, showcasing the growing interest in sound therapy for relaxation and wellness.
In-Depth Complementary and Alternative Medicine Industry Market Outlook
The CAM industry is poised for sustained growth, driven by the convergence of technological advancements, evolving consumer preferences, and increasing integration with conventional healthcare. Strategic partnerships, innovative product development, and expansion into new markets will be crucial for capturing significant market share and unlocking the industry's vast potential. Further research into the efficacy and safety of CAM treatments is vital to bolster consumer confidence and regulatory acceptance.
Complementary and Alternative Medicine Industry Segmentation
-
1. Type
- 1.1. Traditional Alternative Therapeutics
- 1.2. Body Therapy
- 1.3. Mind Therapy
- 1.4. Sensory Therapy
- 1.5. Other Types
-
2. Application
- 2.1. Arthritis
- 2.2. Cancer
- 2.3. Diabetes
- 2.4. Cardiovascular
- 2.5. Neurlogy
- 2.6. Other Applications
-
3. Distribution Channel
- 3.1. Direct Sales
- 3.2. Online Sales
- 3.3. Distance Correspondance
Complementary and Alternative Medicine Industry Segmentation By Geography
-
1. North America
- 1.1. United States
- 1.2. Canada
- 1.3. Mexico
-
2. Europe
- 2.1. Germany
- 2.2. United Kingdom
- 2.3. France
- 2.4. Italy
- 2.5. Spain
- 2.6. Rest of Europe
-
3. Asia Pacific
- 3.1. China
- 3.2. Japan
- 3.3. India
- 3.4. Australia
- 3.5. South Korea
- 3.6. Rest of Asia Pacific
-
4. Middle East and Africa
- 4.1. GCC
- 4.2. South Africa
- 4.3. Rest of Middle East and Africa
-
5. South America
- 5.1. Brazil
- 5.2. Argentina
- 5.3. Rest of South America
Complementary and Alternative Medicine Industry REPORT HIGHLIGHTS
| Aspects | Details |
|---|---|
| Study Period | 2019-2033 |
| Base Year | 2024 |
| Estimated Year | 2025 |
| Forecast Period | 2025-2033 |
| Historical Period | 2019-2024 |
| Growth Rate | CAGR of 19.50% from 2019-2033 |
| Segmentation |
|
Table of Contents
- 1. Introduction
- 1.1. Research Scope
- 1.2. Market Segmentation
- 1.3. Research Methodology
- 1.4. Definitions and Assumptions
- 2. Executive Summary
- 2.1. Introduction
- 3. Market Dynamics
- 3.1. Introduction
- 3.2. Market Drivers
- 3.2.1. Increasing Awareness About the Benefits of Complementary and Alternative Medicines; Growing Government Initiative and Growing Acceptance
- 3.3. Market Restrains
- 3.3.1. Lack of Proper Scientific Evidence and Less Understanding About Alternative Medicine
- 3.4. Market Trends
- 3.4.1. Cancer Is Expected to Hold a Significant Share Over the Forecast Period
- 4. Market Factor Analysis
- 4.1. Porters Five Forces
- 4.2. Supply/Value Chain
- 4.3. PESTEL analysis
- 4.4. Market Entropy
- 4.5. Patent/Trademark Analysis
- 5. Global Complementary and Alternative Medicine Industry Analysis, Insights and Forecast, 2019-2031
- 5.1. Market Analysis, Insights and Forecast - by Type
- 5.1.1. Traditional Alternative Therapeutics
- 5.1.2. Body Therapy
- 5.1.3. Mind Therapy
- 5.1.4. Sensory Therapy
- 5.1.5. Other Types
- 5.2. Market Analysis, Insights and Forecast - by Application
- 5.2.1. Arthritis
- 5.2.2. Cancer
- 5.2.3. Diabetes
- 5.2.4. Cardiovascular
- 5.2.5. Neurlogy
- 5.2.6. Other Applications
- 5.3. Market Analysis, Insights and Forecast - by Distribution Channel
- 5.3.1. Direct Sales
- 5.3.2. Online Sales
- 5.3.3. Distance Correspondance
- 5.4. Market Analysis, Insights and Forecast - by Region
- 5.4.1. North America
- 5.4.2. Europe
- 5.4.3. Asia Pacific
- 5.4.4. Middle East and Africa
- 5.4.5. South America
- 5.1. Market Analysis, Insights and Forecast - by Type
- 6. North America Complementary and Alternative Medicine Industry Analysis, Insights and Forecast, 2019-2031
- 6.1. Market Analysis, Insights and Forecast - by Type
- 6.1.1. Traditional Alternative Therapeutics
- 6.1.2. Body Therapy
- 6.1.3. Mind Therapy
- 6.1.4. Sensory Therapy
- 6.1.5. Other Types
- 6.2. Market Analysis, Insights and Forecast - by Application
- 6.2.1. Arthritis
- 6.2.2. Cancer
- 6.2.3. Diabetes
- 6.2.4. Cardiovascular
- 6.2.5. Neurlogy
- 6.2.6. Other Applications
- 6.3. Market Analysis, Insights and Forecast - by Distribution Channel
- 6.3.1. Direct Sales
- 6.3.2. Online Sales
- 6.3.3. Distance Correspondance
- 6.1. Market Analysis, Insights and Forecast - by Type
- 7. Europe Complementary and Alternative Medicine Industry Analysis, Insights and Forecast, 2019-2031
- 7.1. Market Analysis, Insights and Forecast - by Type
- 7.1.1. Traditional Alternative Therapeutics
- 7.1.2. Body Therapy
- 7.1.3. Mind Therapy
- 7.1.4. Sensory Therapy
- 7.1.5. Other Types
- 7.2. Market Analysis, Insights and Forecast - by Application
- 7.2.1. Arthritis
- 7.2.2. Cancer
- 7.2.3. Diabetes
- 7.2.4. Cardiovascular
- 7.2.5. Neurlogy
- 7.2.6. Other Applications
- 7.3. Market Analysis, Insights and Forecast - by Distribution Channel
- 7.3.1. Direct Sales
- 7.3.2. Online Sales
- 7.3.3. Distance Correspondance
- 7.1. Market Analysis, Insights and Forecast - by Type
- 8. Asia Pacific Complementary and Alternative Medicine Industry Analysis, Insights and Forecast, 2019-2031
- 8.1. Market Analysis, Insights and Forecast - by Type
- 8.1.1. Traditional Alternative Therapeutics
- 8.1.2. Body Therapy
- 8.1.3. Mind Therapy
- 8.1.4. Sensory Therapy
- 8.1.5. Other Types
- 8.2. Market Analysis, Insights and Forecast - by Application
- 8.2.1. Arthritis
- 8.2.2. Cancer
- 8.2.3. Diabetes
- 8.2.4. Cardiovascular
- 8.2.5. Neurlogy
- 8.2.6. Other Applications
- 8.3. Market Analysis, Insights and Forecast - by Distribution Channel
- 8.3.1. Direct Sales
- 8.3.2. Online Sales
- 8.3.3. Distance Correspondance
- 8.1. Market Analysis, Insights and Forecast - by Type
- 9. Middle East and Africa Complementary and Alternative Medicine Industry Analysis, Insights and Forecast, 2019-2031
- 9.1. Market Analysis, Insights and Forecast - by Type
- 9.1.1. Traditional Alternative Therapeutics
- 9.1.2. Body Therapy
- 9.1.3. Mind Therapy
- 9.1.4. Sensory Therapy
- 9.1.5. Other Types
- 9.2. Market Analysis, Insights and Forecast - by Application
- 9.2.1. Arthritis
- 9.2.2. Cancer
- 9.2.3. Diabetes
- 9.2.4. Cardiovascular
- 9.2.5. Neurlogy
- 9.2.6. Other Applications
- 9.3. Market Analysis, Insights and Forecast - by Distribution Channel
- 9.3.1. Direct Sales
- 9.3.2. Online Sales
- 9.3.3. Distance Correspondance
- 9.1. Market Analysis, Insights and Forecast - by Type
- 10. South America Complementary and Alternative Medicine Industry Analysis, Insights and Forecast, 2019-2031
- 10.1. Market Analysis, Insights and Forecast - by Type
- 10.1.1. Traditional Alternative Therapeutics
- 10.1.2. Body Therapy
- 10.1.3. Mind Therapy
- 10.1.4. Sensory Therapy
- 10.1.5. Other Types
- 10.2. Market Analysis, Insights and Forecast - by Application
- 10.2.1. Arthritis
- 10.2.2. Cancer
- 10.2.3. Diabetes
- 10.2.4. Cardiovascular
- 10.2.5. Neurlogy
- 10.2.6. Other Applications
- 10.3. Market Analysis, Insights and Forecast - by Distribution Channel
- 10.3.1. Direct Sales
- 10.3.2. Online Sales
- 10.3.3. Distance Correspondance
- 10.1. Market Analysis, Insights and Forecast - by Type
- 11. North America Complementary and Alternative Medicine Industry Analysis, Insights and Forecast, 2019-2031
- 11.1. Market Analysis, Insights and Forecast - By Country/Sub-region
- 11.1.1 United States
- 11.1.2 Canada
- 11.1.3 Mexico
- 12. Europe Complementary and Alternative Medicine Industry Analysis, Insights and Forecast, 2019-2031
- 12.1. Market Analysis, Insights and Forecast - By Country/Sub-region
- 12.1.1 Germany
- 12.1.2 United Kingdom
- 12.1.3 France
- 12.1.4 Italy
- 12.1.5 Spain
- 12.1.6 Rest of Europe
- 13. Asia Pacific Complementary and Alternative Medicine Industry Analysis, Insights and Forecast, 2019-2031
- 13.1. Market Analysis, Insights and Forecast - By Country/Sub-region
- 13.1.1 China
- 13.1.2 Japan
- 13.1.3 India
- 13.1.4 Australia
- 13.1.5 South Korea
- 13.1.6 Rest of Asia Pacific
- 14. Middle East and Africa Complementary and Alternative Medicine Industry Analysis, Insights and Forecast, 2019-2031
- 14.1. Market Analysis, Insights and Forecast - By Country/Sub-region
- 14.1.1 GCC
- 14.1.2 South Africa
- 14.1.3 Rest of Middle East and Africa
- 15. South America Complementary and Alternative Medicine Industry Analysis, Insights and Forecast, 2019-2031
- 15.1. Market Analysis, Insights and Forecast - By Country/Sub-region
- 15.1.1 Brazil
- 15.1.2 Argentina
- 15.1.3 Rest of South America
- 16. Competitive Analysis
- 16.1. Global Market Share Analysis 2024
- 16.2. Company Profiles
- 16.2.1 Unity Woods Yoga Center
- 16.2.1.1. Overview
- 16.2.1.2. Products
- 16.2.1.3. SWOT Analysis
- 16.2.1.4. Recent Developments
- 16.2.1.5. Financials (Based on Availability)
- 16.2.2 Columbia Nutritional LLC
- 16.2.2.1. Overview
- 16.2.2.2. Products
- 16.2.2.3. SWOT Analysis
- 16.2.2.4. Recent Developments
- 16.2.2.5. Financials (Based on Availability)
- 16.2.3 Quantum-Touch
- 16.2.3.1. Overview
- 16.2.3.2. Products
- 16.2.3.3. SWOT Analysis
- 16.2.3.4. Recent Developments
- 16.2.3.5. Financials (Based on Availability)
- 16.2.4 Sheng Chang Pharmaceutical Company
- 16.2.4.1. Overview
- 16.2.4.2. Products
- 16.2.4.3. SWOT Analysis
- 16.2.4.4. Recent Developments
- 16.2.4.5. Financials (Based on Availability)
- 16.2.5 Nordic Nutraceuticals*List Not Exhaustive
- 16.2.5.1. Overview
- 16.2.5.2. Products
- 16.2.5.3. SWOT Analysis
- 16.2.5.4. Recent Developments
- 16.2.5.5. Financials (Based on Availability)
- 16.2.6 Ramamani Iyengar Memorial Yoga Institute
- 16.2.6.1. Overview
- 16.2.6.2. Products
- 16.2.6.3. SWOT Analysis
- 16.2.6.4. Recent Developments
- 16.2.6.5. Financials (Based on Availability)
- 16.2.7 Pure encapsulations LLC
- 16.2.7.1. Overview
- 16.2.7.2. Products
- 16.2.7.3. SWOT Analysis
- 16.2.7.4. Recent Developments
- 16.2.7.5. Financials (Based on Availability)
- 16.2.8 Herb Pharm
- 16.2.8.1. Overview
- 16.2.8.2. Products
- 16.2.8.3. SWOT Analysis
- 16.2.8.4. Recent Developments
- 16.2.8.5. Financials (Based on Availability)
- 16.2.9 Yoga Tree Studios Inc
- 16.2.9.1. Overview
- 16.2.9.2. Products
- 16.2.9.3. SWOT Analysis
- 16.2.9.4. Recent Developments
- 16.2.9.5. Financials (Based on Availability)
- 16.2.10 John Schumacher Unity Woods Yoga Centre
- 16.2.10.1. Overview
- 16.2.10.2. Products
- 16.2.10.3. SWOT Analysis
- 16.2.10.4. Recent Developments
- 16.2.10.5. Financials (Based on Availability)
- 16.2.11 Healing Company Ltd
- 16.2.11.1. Overview
- 16.2.11.2. Products
- 16.2.11.3. SWOT Analysis
- 16.2.11.4. Recent Developments
- 16.2.11.5. Financials (Based on Availability)
- 16.2.12 Ayush Ayurvedic Pte Ltd
- 16.2.12.1. Overview
- 16.2.12.2. Products
- 16.2.12.3. SWOT Analysis
- 16.2.12.4. Recent Developments
- 16.2.12.5. Financials (Based on Availability)
- 16.2.1 Unity Woods Yoga Center
List of Figures
- Figure 1: Global Complementary and Alternative Medicine Industry Revenue Breakdown (Million, %) by Region 2024 & 2032
- Figure 2: North America Complementary and Alternative Medicine Industry Revenue (Million), by Country 2024 & 2032
- Figure 3: North America Complementary and Alternative Medicine Industry Revenue Share (%), by Country 2024 & 2032
- Figure 4: Europe Complementary and Alternative Medicine Industry Revenue (Million), by Country 2024 & 2032
- Figure 5: Europe Complementary and Alternative Medicine Industry Revenue Share (%), by Country 2024 & 2032
- Figure 6: Asia Pacific Complementary and Alternative Medicine Industry Revenue (Million), by Country 2024 & 2032
- Figure 7: Asia Pacific Complementary and Alternative Medicine Industry Revenue Share (%), by Country 2024 & 2032
- Figure 8: Middle East and Africa Complementary and Alternative Medicine Industry Revenue (Million), by Country 2024 & 2032
- Figure 9: Middle East and Africa Complementary and Alternative Medicine Industry Revenue Share (%), by Country 2024 & 2032
- Figure 10: South America Complementary and Alternative Medicine Industry Revenue (Million), by Country 2024 & 2032
- Figure 11: South America Complementary and Alternative Medicine Industry Revenue Share (%), by Country 2024 & 2032
- Figure 12: North America Complementary and Alternative Medicine Industry Revenue (Million), by Type 2024 & 2032
- Figure 13: North America Complementary and Alternative Medicine Industry Revenue Share (%), by Type 2024 & 2032
- Figure 14: North America Complementary and Alternative Medicine Industry Revenue (Million), by Application 2024 & 2032
- Figure 15: North America Complementary and Alternative Medicine Industry Revenue Share (%), by Application 2024 & 2032
- Figure 16: North America Complementary and Alternative Medicine Industry Revenue (Million), by Distribution Channel 2024 & 2032
- Figure 17: North America Complementary and Alternative Medicine Industry Revenue Share (%), by Distribution Channel 2024 & 2032
- Figure 18: North America Complementary and Alternative Medicine Industry Revenue (Million), by Country 2024 & 2032
- Figure 19: North America Complementary and Alternative Medicine Industry Revenue Share (%), by Country 2024 & 2032
- Figure 20: Europe Complementary and Alternative Medicine Industry Revenue (Million), by Type 2024 & 2032
- Figure 21: Europe Complementary and Alternative Medicine Industry Revenue Share (%), by Type 2024 & 2032
- Figure 22: Europe Complementary and Alternative Medicine Industry Revenue (Million), by Application 2024 & 2032
- Figure 23: Europe Complementary and Alternative Medicine Industry Revenue Share (%), by Application 2024 & 2032
- Figure 24: Europe Complementary and Alternative Medicine Industry Revenue (Million), by Distribution Channel 2024 & 2032
- Figure 25: Europe Complementary and Alternative Medicine Industry Revenue Share (%), by Distribution Channel 2024 & 2032
- Figure 26: Europe Complementary and Alternative Medicine Industry Revenue (Million), by Country 2024 & 2032
- Figure 27: Europe Complementary and Alternative Medicine Industry Revenue Share (%), by Country 2024 & 2032
- Figure 28: Asia Pacific Complementary and Alternative Medicine Industry Revenue (Million), by Type 2024 & 2032
- Figure 29: Asia Pacific Complementary and Alternative Medicine Industry Revenue Share (%), by Type 2024 & 2032
- Figure 30: Asia Pacific Complementary and Alternative Medicine Industry Revenue (Million), by Application 2024 & 2032
- Figure 31: Asia Pacific Complementary and Alternative Medicine Industry Revenue Share (%), by Application 2024 & 2032
- Figure 32: Asia Pacific Complementary and Alternative Medicine Industry Revenue (Million), by Distribution Channel 2024 & 2032
- Figure 33: Asia Pacific Complementary and Alternative Medicine Industry Revenue Share (%), by Distribution Channel 2024 & 2032
- Figure 34: Asia Pacific Complementary and Alternative Medicine Industry Revenue (Million), by Country 2024 & 2032
- Figure 35: Asia Pacific Complementary and Alternative Medicine Industry Revenue Share (%), by Country 2024 & 2032
- Figure 36: Middle East and Africa Complementary and Alternative Medicine Industry Revenue (Million), by Type 2024 & 2032
- Figure 37: Middle East and Africa Complementary and Alternative Medicine Industry Revenue Share (%), by Type 2024 & 2032
- Figure 38: Middle East and Africa Complementary and Alternative Medicine Industry Revenue (Million), by Application 2024 & 2032
- Figure 39: Middle East and Africa Complementary and Alternative Medicine Industry Revenue Share (%), by Application 2024 & 2032
- Figure 40: Middle East and Africa Complementary and Alternative Medicine Industry Revenue (Million), by Distribution Channel 2024 & 2032
- Figure 41: Middle East and Africa Complementary and Alternative Medicine Industry Revenue Share (%), by Distribution Channel 2024 & 2032
- Figure 42: Middle East and Africa Complementary and Alternative Medicine Industry Revenue (Million), by Country 2024 & 2032
- Figure 43: Middle East and Africa Complementary and Alternative Medicine Industry Revenue Share (%), by Country 2024 & 2032
- Figure 44: South America Complementary and Alternative Medicine Industry Revenue (Million), by Type 2024 & 2032
- Figure 45: South America Complementary and Alternative Medicine Industry Revenue Share (%), by Type 2024 & 2032
- Figure 46: South America Complementary and Alternative Medicine Industry Revenue (Million), by Application 2024 & 2032
- Figure 47: South America Complementary and Alternative Medicine Industry Revenue Share (%), by Application 2024 & 2032
- Figure 48: South America Complementary and Alternative Medicine Industry Revenue (Million), by Distribution Channel 2024 & 2032
- Figure 49: South America Complementary and Alternative Medicine Industry Revenue Share (%), by Distribution Channel 2024 & 2032
- Figure 50: South America Complementary and Alternative Medicine Industry Revenue (Million), by Country 2024 & 2032
- Figure 51: South America Complementary and Alternative Medicine Industry Revenue Share (%), by Country 2024 & 2032
List of Tables
- Table 1: Global Complementary and Alternative Medicine Industry Revenue Million Forecast, by Region 2019 & 2032
- Table 2: Global Complementary and Alternative Medicine Industry Revenue Million Forecast, by Type 2019 & 2032
- Table 3: Global Complementary and Alternative Medicine Industry Revenue Million Forecast, by Application 2019 & 2032
- Table 4: Global Complementary and Alternative Medicine Industry Revenue Million Forecast, by Distribution Channel 2019 & 2032
- Table 5: Global Complementary and Alternative Medicine Industry Revenue Million Forecast, by Region 2019 & 2032
- Table 6: Global Complementary and Alternative Medicine Industry Revenue Million Forecast, by Country 2019 & 2032
- Table 7: United States Complementary and Alternative Medicine Industry Revenue (Million) Forecast, by Application 2019 & 2032
- Table 8: Canada Complementary and Alternative Medicine Industry Revenue (Million) Forecast, by Application 2019 & 2032
- Table 9: Mexico Complementary and Alternative Medicine Industry Revenue (Million) Forecast, by Application 2019 & 2032
- Table 10: Global Complementary and Alternative Medicine Industry Revenue Million Forecast, by Country 2019 & 2032
- Table 11: Germany Complementary and Alternative Medicine Industry Revenue (Million) Forecast, by Application 2019 & 2032
- Table 12: United Kingdom Complementary and Alternative Medicine Industry Revenue (Million) Forecast, by Application 2019 & 2032
- Table 13: France Complementary and Alternative Medicine Industry Revenue (Million) Forecast, by Application 2019 & 2032
- Table 14: Italy Complementary and Alternative Medicine Industry Revenue (Million) Forecast, by Application 2019 & 2032
- Table 15: Spain Complementary and Alternative Medicine Industry Revenue (Million) Forecast, by Application 2019 & 2032
- Table 16: Rest of Europe Complementary and Alternative Medicine Industry Revenue (Million) Forecast, by Application 2019 & 2032
- Table 17: Global Complementary and Alternative Medicine Industry Revenue Million Forecast, by Country 2019 & 2032
- Table 18: China Complementary and Alternative Medicine Industry Revenue (Million) Forecast, by Application 2019 & 2032
- Table 19: Japan Complementary and Alternative Medicine Industry Revenue (Million) Forecast, by Application 2019 & 2032
- Table 20: India Complementary and Alternative Medicine Industry Revenue (Million) Forecast, by Application 2019 & 2032
- Table 21: Australia Complementary and Alternative Medicine Industry Revenue (Million) Forecast, by Application 2019 & 2032
- Table 22: South Korea Complementary and Alternative Medicine Industry Revenue (Million) Forecast, by Application 2019 & 2032
- Table 23: Rest of Asia Pacific Complementary and Alternative Medicine Industry Revenue (Million) Forecast, by Application 2019 & 2032
- Table 24: Global Complementary and Alternative Medicine Industry Revenue Million Forecast, by Country 2019 & 2032
- Table 25: GCC Complementary and Alternative Medicine Industry Revenue (Million) Forecast, by Application 2019 & 2032
- Table 26: South Africa Complementary and Alternative Medicine Industry Revenue (Million) Forecast, by Application 2019 & 2032
- Table 27: Rest of Middle East and Africa Complementary and Alternative Medicine Industry Revenue (Million) Forecast, by Application 2019 & 2032
- Table 28: Global Complementary and Alternative Medicine Industry Revenue Million Forecast, by Country 2019 & 2032
- Table 29: Brazil Complementary and Alternative Medicine Industry Revenue (Million) Forecast, by Application 2019 & 2032
- Table 30: Argentina Complementary and Alternative Medicine Industry Revenue (Million) Forecast, by Application 2019 & 2032
- Table 31: Rest of South America Complementary and Alternative Medicine Industry Revenue (Million) Forecast, by Application 2019 & 2032
- Table 32: Global Complementary and Alternative Medicine Industry Revenue Million Forecast, by Type 2019 & 2032
- Table 33: Global Complementary and Alternative Medicine Industry Revenue Million Forecast, by Application 2019 & 2032
- Table 34: Global Complementary and Alternative Medicine Industry Revenue Million Forecast, by Distribution Channel 2019 & 2032
- Table 35: Global Complementary and Alternative Medicine Industry Revenue Million Forecast, by Country 2019 & 2032
- Table 36: United States Complementary and Alternative Medicine Industry Revenue (Million) Forecast, by Application 2019 & 2032
- Table 37: Canada Complementary and Alternative Medicine Industry Revenue (Million) Forecast, by Application 2019 & 2032
- Table 38: Mexico Complementary and Alternative Medicine Industry Revenue (Million) Forecast, by Application 2019 & 2032
- Table 39: Global Complementary and Alternative Medicine Industry Revenue Million Forecast, by Type 2019 & 2032
- Table 40: Global Complementary and Alternative Medicine Industry Revenue Million Forecast, by Application 2019 & 2032
- Table 41: Global Complementary and Alternative Medicine Industry Revenue Million Forecast, by Distribution Channel 2019 & 2032
- Table 42: Global Complementary and Alternative Medicine Industry Revenue Million Forecast, by Country 2019 & 2032
- Table 43: Germany Complementary and Alternative Medicine Industry Revenue (Million) Forecast, by Application 2019 & 2032
- Table 44: United Kingdom Complementary and Alternative Medicine Industry Revenue (Million) Forecast, by Application 2019 & 2032
- Table 45: France Complementary and Alternative Medicine Industry Revenue (Million) Forecast, by Application 2019 & 2032
- Table 46: Italy Complementary and Alternative Medicine Industry Revenue (Million) Forecast, by Application 2019 & 2032
- Table 47: Spain Complementary and Alternative Medicine Industry Revenue (Million) Forecast, by Application 2019 & 2032
- Table 48: Rest of Europe Complementary and Alternative Medicine Industry Revenue (Million) Forecast, by Application 2019 & 2032
- Table 49: Global Complementary and Alternative Medicine Industry Revenue Million Forecast, by Type 2019 & 2032
- Table 50: Global Complementary and Alternative Medicine Industry Revenue Million Forecast, by Application 2019 & 2032
- Table 51: Global Complementary and Alternative Medicine Industry Revenue Million Forecast, by Distribution Channel 2019 & 2032
- Table 52: Global Complementary and Alternative Medicine Industry Revenue Million Forecast, by Country 2019 & 2032
- Table 53: China Complementary and Alternative Medicine Industry Revenue (Million) Forecast, by Application 2019 & 2032
- Table 54: Japan Complementary and Alternative Medicine Industry Revenue (Million) Forecast, by Application 2019 & 2032
- Table 55: India Complementary and Alternative Medicine Industry Revenue (Million) Forecast, by Application 2019 & 2032
- Table 56: Australia Complementary and Alternative Medicine Industry Revenue (Million) Forecast, by Application 2019 & 2032
- Table 57: South Korea Complementary and Alternative Medicine Industry Revenue (Million) Forecast, by Application 2019 & 2032
- Table 58: Rest of Asia Pacific Complementary and Alternative Medicine Industry Revenue (Million) Forecast, by Application 2019 & 2032
- Table 59: Global Complementary and Alternative Medicine Industry Revenue Million Forecast, by Type 2019 & 2032
- Table 60: Global Complementary and Alternative Medicine Industry Revenue Million Forecast, by Application 2019 & 2032
- Table 61: Global Complementary and Alternative Medicine Industry Revenue Million Forecast, by Distribution Channel 2019 & 2032
- Table 62: Global Complementary and Alternative Medicine Industry Revenue Million Forecast, by Country 2019 & 2032
- Table 63: GCC Complementary and Alternative Medicine Industry Revenue (Million) Forecast, by Application 2019 & 2032
- Table 64: South Africa Complementary and Alternative Medicine Industry Revenue (Million) Forecast, by Application 2019 & 2032
- Table 65: Rest of Middle East and Africa Complementary and Alternative Medicine Industry Revenue (Million) Forecast, by Application 2019 & 2032
- Table 66: Global Complementary and Alternative Medicine Industry Revenue Million Forecast, by Type 2019 & 2032
- Table 67: Global Complementary and Alternative Medicine Industry Revenue Million Forecast, by Application 2019 & 2032
- Table 68: Global Complementary and Alternative Medicine Industry Revenue Million Forecast, by Distribution Channel 2019 & 2032
- Table 69: Global Complementary and Alternative Medicine Industry Revenue Million Forecast, by Country 2019 & 2032
- Table 70: Brazil Complementary and Alternative Medicine Industry Revenue (Million) Forecast, by Application 2019 & 2032
- Table 71: Argentina Complementary and Alternative Medicine Industry Revenue (Million) Forecast, by Application 2019 & 2032
- Table 72: Rest of South America Complementary and Alternative Medicine Industry Revenue (Million) Forecast, by Application 2019 & 2032
Frequently Asked Questions
1. What is the projected Compound Annual Growth Rate (CAGR) of the Complementary and Alternative Medicine Industry?
The projected CAGR is approximately 19.50%.
2. Which companies are prominent players in the Complementary and Alternative Medicine Industry?
Key companies in the market include Unity Woods Yoga Center, Columbia Nutritional LLC, Quantum-Touch, Sheng Chang Pharmaceutical Company, Nordic Nutraceuticals*List Not Exhaustive, Ramamani Iyengar Memorial Yoga Institute, Pure encapsulations LLC, Herb Pharm, Yoga Tree Studios Inc, John Schumacher Unity Woods Yoga Centre, Healing Company Ltd, Ayush Ayurvedic Pte Ltd.
3. What are the main segments of the Complementary and Alternative Medicine Industry?
The market segments include Type, Application, Distribution Channel.
4. Can you provide details about the market size?
The market size is estimated to be USD XX Million as of 2022.
5. What are some drivers contributing to market growth?
Increasing Awareness About the Benefits of Complementary and Alternative Medicines; Growing Government Initiative and Growing Acceptance.
6. What are the notable trends driving market growth?
Cancer Is Expected to Hold a Significant Share Over the Forecast Period.
7. Are there any restraints impacting market growth?
Lack of Proper Scientific Evidence and Less Understanding About Alternative Medicine.
8. Can you provide examples of recent developments in the market?
December 2022: Adoratherapy launched its Alkemie Chakra Healing collection, featuring aroma perfume sprays, dry touch body oils, body lotions, and lotion candles all with the same scents. The scents were formulated to balance and heal using aromatherapy principles, in which essential oils are active ingredients.
9. What pricing options are available for accessing the report?
Pricing options include single-user, multi-user, and enterprise licenses priced at USD 4750, USD 5250, and USD 8750 respectively.
10. Is the market size provided in terms of value or volume?
The market size is provided in terms of value, measured in Million.
11. Are there any specific market keywords associated with the report?
Yes, the market keyword associated with the report is "Complementary and Alternative Medicine Industry," which aids in identifying and referencing the specific market segment covered.
12. How do I determine which pricing option suits my needs best?
The pricing options vary based on user requirements and access needs. Individual users may opt for single-user licenses, while businesses requiring broader access may choose multi-user or enterprise licenses for cost-effective access to the report.
13. Are there any additional resources or data provided in the Complementary and Alternative Medicine Industry report?
While the report offers comprehensive insights, it's advisable to review the specific contents or supplementary materials provided to ascertain if additional resources or data are available.
14. How can I stay updated on further developments or reports in the Complementary and Alternative Medicine Industry?
To stay informed about further developments, trends, and reports in the Complementary and Alternative Medicine Industry, consider subscribing to industry newsletters, following relevant companies and organizations, or regularly checking reputable industry news sources and publications.
Methodology
Step 1 - Identification of Relevant Samples Size from Population Database


Step 2 - Approaches for Defining Global Market Size (Value, Volume* & Price*)

Note*: In applicable scenarios
Step 3 - Data Sources
Primary Research
- Web Analytics
- Survey Reports
- Research Institute
- Latest Research Reports
- Opinion Leaders
Secondary Research
- Annual Reports
- White Paper
- Latest Press Release
- Industry Association
- Paid Database
- Investor Presentations

Step 4 - Data Triangulation
Involves using different sources of information in order to increase the validity of a study
These sources are likely to be stakeholders in a program - participants, other researchers, program staff, other community members, and so on.
Then we put all data in single framework & apply various statistical tools to find out the dynamic on the market.
During the analysis stage, feedback from the stakeholder groups would be compared to determine areas of agreement as well as areas of divergence


