
Key Insights
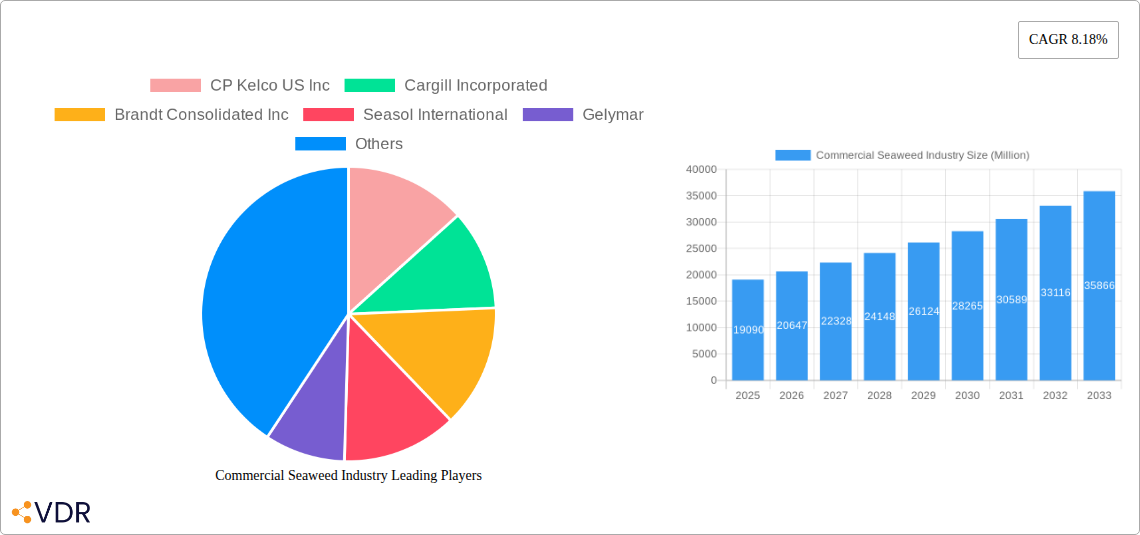
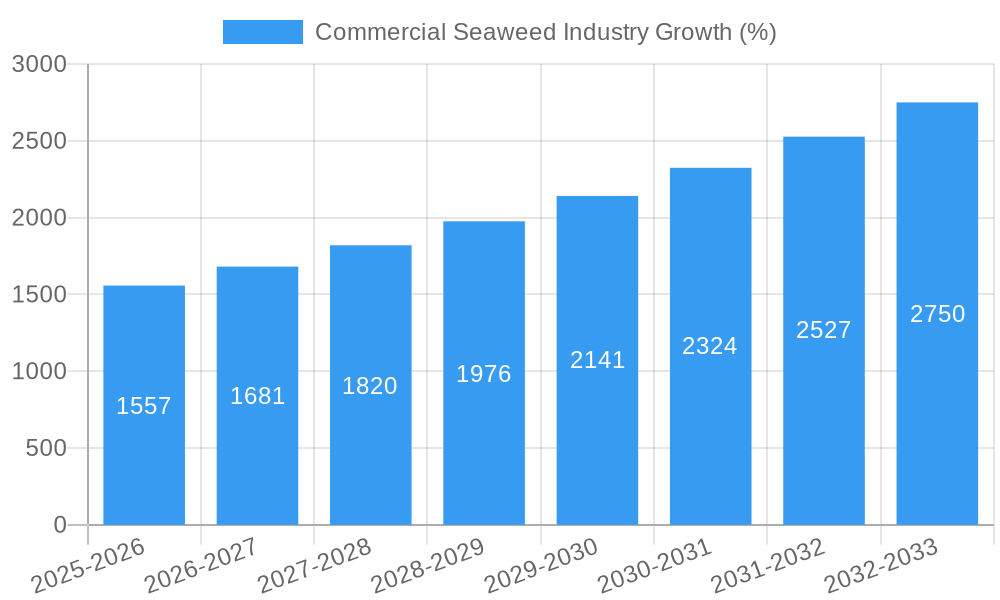
The global commercial seaweed industry, valued at $19.09 billion in 2025, is experiencing robust growth, projected to expand at a compound annual growth rate (CAGR) of 8.18% from 2025 to 2033. This expansion is driven by several key factors. Increasing consumer demand for sustainable and healthy food alternatives is fueling the adoption of seaweed in food and beverages, as well as dietary supplements. The pharmaceutical industry's growing interest in seaweed's bioactive compounds for drug development contributes significantly to market growth. Furthermore, the versatility of seaweed, enabling applications in cosmetics, biofuels, and agricultural biostimulants, broadens its market reach. Geographic expansion, particularly in Asia-Pacific, a region known for its longstanding seaweed cultivation practices and consumption, further contributes to market expansion. However, challenges remain, including the seasonal nature of seaweed harvests, potential supply chain disruptions, and the need for further research to unlock seaweed's full potential across diverse applications. Consistent innovation in seaweed cultivation techniques and processing methods, alongside efforts to enhance consumer awareness of seaweed’s benefits, will be crucial for sustaining this upward trajectory.
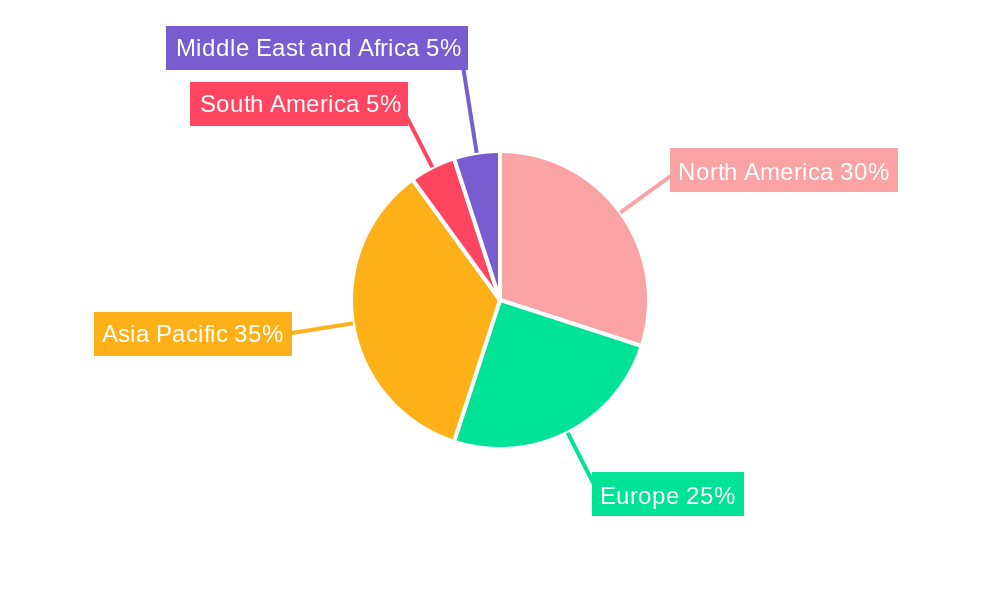
The market segmentation reveals a significant contribution from the food and beverage sector, followed by dietary supplements and pharmaceuticals. Brown seaweed currently holds the largest product type share due to its wide-ranging applications and established market presence. North America and Europe represent significant regional markets, benefiting from established distribution channels and growing consumer awareness. However, the Asia-Pacific region is expected to experience the most substantial growth due to its large population, existing seaweed cultivation infrastructure, and rising disposable incomes. Competition in the industry is fierce, with a blend of established multinational corporations and smaller specialized companies contributing to innovation and market diversification. The forecast period of 2025-2033 suggests a promising future for the commercial seaweed industry, dependent on consistent investment in research and development, sustainable cultivation practices, and effective marketing campaigns.
Commercial Seaweed Industry Market Report: 2019-2033
This comprehensive report provides an in-depth analysis of the Commercial Seaweed Industry, encompassing market dynamics, growth trends, regional segmentation, product landscape, key players, and future outlook. The study period covers 2019-2033, with a base year of 2025 and a forecast period of 2025-2033. This report is essential for industry professionals, investors, and researchers seeking a complete understanding of this burgeoning market. The parent market is the broader seafood industry, while the child market focuses specifically on commercial seaweed cultivation and processing.
Commercial Seaweed Industry Market Dynamics & Structure
The commercial seaweed industry is characterized by a moderately concentrated market structure, with several key players holding significant market share. The total market value in 2025 is estimated at xx Million. While CP Kelco US Inc., Cargill Incorporated, and Acadian Seaplants lead the pack, a significant number of smaller players contribute to the market's overall diversity. Technological innovation, driven by advancements in seaweed cultivation techniques and extraction methods, is a key driver. Regulatory frameworks vary across regions, impacting production and trade. Market growth is also influenced by the availability of competitive product substitutes (e.g., other gelling agents) and end-user demographics, primarily focused on the food and beverage, pharmaceutical, and dietary supplement sectors. The industry witnesses frequent mergers and acquisitions (M&A), further shaping the competitive landscape. The M&A activity is estimated to have involved approximately xx deals in the past five years, though the exact number is difficult to confirm due to data restrictions.
- Market Concentration: Moderately concentrated, with a few major players holding significant market share (estimated at xx% combined).
- Technological Innovation: Focus on sustainable cultivation, efficient harvesting, and advanced extraction methods.
- Regulatory Frameworks: Vary significantly across regions, influencing both production costs and market access.
- Competitive Substitutes: Other gelling agents and thickening materials pose competition.
- End-User Demographics: Primarily Food & Beverage (xx%), Dietary Supplements (xx%), Pharmaceuticals (xx%), and Other Applications (xx%).
- M&A Activity: Moderate level of M&A activity observed in recent years; exact deal volume unavailable.
Commercial Seaweed Industry Growth Trends & Insights
The commercial seaweed industry has witnessed substantial growth over the historical period (2019-2024), with the market size expanding from xx Million in 2019 to xx Million in 2024. This reflects a Compound Annual Growth Rate (CAGR) of xx%. This robust growth is attributed to several factors, including increased consumer awareness of seaweed's health benefits, expanding applications in various industries (especially food and pharmaceuticals), and government initiatives promoting sustainable aquaculture. Technological advancements in seaweed cultivation and processing are further enhancing efficiency and yield. The market penetration rate in key regions is steadily increasing, driven by factors such as rising disposable incomes and a growing preference for natural and sustainable products. However, challenges including seasonal variations in seaweed production and the need for improved infrastructure remain. The forecast period (2025-2033) is expected to show continued growth, with a projected CAGR of xx%, reaching xx Million by 2033.
Dominant Regions, Countries, or Segments in Commercial Seaweed Industry
Asia-Pacific currently dominates the global commercial seaweed market, with significant contributions from China, Japan, and South Korea. This dominance is driven by established seaweed cultivation practices, high consumption rates, and favorable government policies supporting the industry's growth. Within product types, Brown Seaweed holds the largest market share, due to its widespread use in food and industrial applications. Similarly, the Food and Beverage application segment accounts for the largest portion of market revenue.
- Key Drivers in Asia-Pacific: Established cultivation practices, high consumption, government support, and a large population.
- Brown Seaweed Dominance: Wide use in food and industrial applications.
- Food & Beverage Application: High demand driven by culinary traditions and increasing use as a food ingredient.
- Other Dominant Regions: Europe and North America are showing significant growth potential, driven by increased consumer demand for sustainable and healthy food options.
Commercial Seaweed Industry Product Landscape
The commercial seaweed industry offers a diverse range of products, including various types of seaweed (brown, green, and red) processed into powders, extracts, hydrocolloids, and other forms. Innovations in extraction methods enhance the bioavailability of bioactive compounds, while new applications in cosmetics, biofuels, and animal feed are emerging. Unique selling propositions often center on the sustainability and health benefits of seaweed, alongside its functional properties as a thickening agent or gelling agent. For instance, Cargill's WavePure® ADG 8250, based on Gracilaria seaweed, demonstrates a commitment to innovation in the food sector.
Key Drivers, Barriers & Challenges in Commercial Seaweed Industry
Key Drivers:
- Growing demand for natural and sustainable food ingredients.
- Increasing awareness of seaweed's nutritional and health benefits.
- Expanding applications across various industries.
- Government support and investment in sustainable aquaculture.
Challenges & Restraints:
- Seasonal variations in seaweed production.
- Dependence on weather conditions and climate change impacts.
- Limited infrastructure for large-scale seaweed cultivation in certain regions.
- Regulatory hurdles and varying standards across different countries.
- Competition from other gelling agents and thickening materials. This has resulted in an estimated xx% decrease in market share for some players in recent years.
Emerging Opportunities in Commercial Seaweed Industry
Untapped markets in developing countries offer significant growth potential, alongside the expanding use of seaweed in new applications like bioplastics and bioremediation. Evolving consumer preferences toward plant-based and sustainable products are driving market growth, while innovations in seaweed-based food products and dietary supplements create exciting opportunities. The development of new functional foods and nutraceuticals further contributes to this expanding market.
Growth Accelerators in the Commercial Seaweed Industry
Technological breakthroughs in seaweed cultivation and processing, coupled with strategic partnerships between seaweed producers, food manufacturers, and researchers, are key growth accelerators. Government incentives and investments in sustainable aquaculture, combined with market expansion strategies targeting new regions and applications, further drive long-term growth prospects. The increasing recognition of seaweed's versatility and sustainability is a major factor in attracting investment and fostering innovation.
Key Players Shaping the Commercial Seaweed Industry Market
- CP Kelco US Inc
- Cargill Incorporated
- Brandt Consolidated Inc
- Seasol International
- Gelymar
- E I du Pont de Nemours & Company
- Rhodomaxx
- Algaia SA
- Dycolor Seaweed Industries
- Acadian Seaplants
Notable Milestones in Commercial Seaweed Industry Sector
- September 2022: Launch of Cadalmin™ LivCure extract, a seaweed-based nutraceutical product for liver health.
- March 2021: Proliferation of seaweed farming startups in Australia, driven by rising opportunities and government support.
- February 2021: Cargill launches WavePure® ADG 8250, a seaweed-based ingredient for dairy desserts.
In-Depth Commercial Seaweed Industry Market Outlook
The commercial seaweed industry is poised for continued robust growth, driven by several factors highlighted in this report. Future market potential lies in exploring untapped markets, developing innovative applications, and capitalizing on consumer preferences for sustainable and healthy products. Strategic partnerships and technological advancements will play a critical role in shaping the industry's future, with Asia-Pacific remaining a key region for growth, followed by a strong potential in Europe and North America. This presents significant opportunities for established players and emerging startups to contribute to the expansion of this dynamic and promising sector.
Commercial Seaweed Industry Segmentation
-
1. Product Type
- 1.1. Brown Seaweed
- 1.2. Green Seaweed
- 1.3. Red Seaweed
-
2. Application
- 2.1. Food and Beverages
- 2.2. Dietary Supplements
- 2.3. Pharmaceuticals
- 2.4. Other Applications
Commercial Seaweed Industry Segmentation By Geography
-
1. North America
- 1.1. United States
- 1.2. Canada
- 1.3. Mexico
- 1.4. Rest of North America
-
2. Europe
- 2.1. Germany
- 2.2. United Kingdom
- 2.3. France
- 2.4. Spain
- 2.5. Russia
- 2.6. Italy
- 2.7. Rest of Europe
-
3. Asia Pacific
- 3.1. China
- 3.2. India
- 3.3. Japan
- 3.4. Australia
- 3.5. Rest of Asia Pacific
-
4. South America
- 4.1. Brazil
- 4.2. Argentina
- 4.3. Rest of South America
-
5. Middle East and Africa
- 5.1. United Arab Emirates
- 5.2. South Africa
- 5.3. Rest Middle East and Africa
Commercial Seaweed Industry REPORT HIGHLIGHTS
| Aspects | Details |
|---|---|
| Study Period | 2019-2033 |
| Base Year | 2024 |
| Estimated Year | 2025 |
| Forecast Period | 2025-2033 |
| Historical Period | 2019-2024 |
| Growth Rate | CAGR of 8.18% from 2019-2033 |
| Segmentation |
|
Table of Contents
- 1. Introduction
- 1.1. Research Scope
- 1.2. Market Segmentation
- 1.3. Research Methodology
- 1.4. Definitions and Assumptions
- 2. Executive Summary
- 2.1. Introduction
- 3. Market Dynamics
- 3.1. Introduction
- 3.2. Market Drivers
- 3.2.1. Increasing Demand for Low-Fat and Low-Calorie Food; Increasing Product Innovation
- 3.3. Market Restrains
- 3.3.1. ; Threat of New Entrants; Bargaining Power of Buyers/Consumers; Bargaining Power of Suppliers; Threat of Substitute Products; Degree Of Competition
- 3.4. Market Trends
- 3.4.1. Increased Usage of Seaweed in Food Sector due to it Functional Properties and Nutritional Benefits
- 4. Market Factor Analysis
- 4.1. Porters Five Forces
- 4.2. Supply/Value Chain
- 4.3. PESTEL analysis
- 4.4. Market Entropy
- 4.5. Patent/Trademark Analysis
- 5. Global Commercial Seaweed Industry Analysis, Insights and Forecast, 2019-2031
- 5.1. Market Analysis, Insights and Forecast - by Product Type
- 5.1.1. Brown Seaweed
- 5.1.2. Green Seaweed
- 5.1.3. Red Seaweed
- 5.2. Market Analysis, Insights and Forecast - by Application
- 5.2.1. Food and Beverages
- 5.2.2. Dietary Supplements
- 5.2.3. Pharmaceuticals
- 5.2.4. Other Applications
- 5.3. Market Analysis, Insights and Forecast - by Region
- 5.3.1. North America
- 5.3.2. Europe
- 5.3.3. Asia Pacific
- 5.3.4. South America
- 5.3.5. Middle East and Africa
- 5.1. Market Analysis, Insights and Forecast - by Product Type
- 6. North America Commercial Seaweed Industry Analysis, Insights and Forecast, 2019-2031
- 6.1. Market Analysis, Insights and Forecast - by Product Type
- 6.1.1. Brown Seaweed
- 6.1.2. Green Seaweed
- 6.1.3. Red Seaweed
- 6.2. Market Analysis, Insights and Forecast - by Application
- 6.2.1. Food and Beverages
- 6.2.2. Dietary Supplements
- 6.2.3. Pharmaceuticals
- 6.2.4. Other Applications
- 6.1. Market Analysis, Insights and Forecast - by Product Type
- 7. Europe Commercial Seaweed Industry Analysis, Insights and Forecast, 2019-2031
- 7.1. Market Analysis, Insights and Forecast - by Product Type
- 7.1.1. Brown Seaweed
- 7.1.2. Green Seaweed
- 7.1.3. Red Seaweed
- 7.2. Market Analysis, Insights and Forecast - by Application
- 7.2.1. Food and Beverages
- 7.2.2. Dietary Supplements
- 7.2.3. Pharmaceuticals
- 7.2.4. Other Applications
- 7.1. Market Analysis, Insights and Forecast - by Product Type
- 8. Asia Pacific Commercial Seaweed Industry Analysis, Insights and Forecast, 2019-2031
- 8.1. Market Analysis, Insights and Forecast - by Product Type
- 8.1.1. Brown Seaweed
- 8.1.2. Green Seaweed
- 8.1.3. Red Seaweed
- 8.2. Market Analysis, Insights and Forecast - by Application
- 8.2.1. Food and Beverages
- 8.2.2. Dietary Supplements
- 8.2.3. Pharmaceuticals
- 8.2.4. Other Applications
- 8.1. Market Analysis, Insights and Forecast - by Product Type
- 9. South America Commercial Seaweed Industry Analysis, Insights and Forecast, 2019-2031
- 9.1. Market Analysis, Insights and Forecast - by Product Type
- 9.1.1. Brown Seaweed
- 9.1.2. Green Seaweed
- 9.1.3. Red Seaweed
- 9.2. Market Analysis, Insights and Forecast - by Application
- 9.2.1. Food and Beverages
- 9.2.2. Dietary Supplements
- 9.2.3. Pharmaceuticals
- 9.2.4. Other Applications
- 9.1. Market Analysis, Insights and Forecast - by Product Type
- 10. Middle East and Africa Commercial Seaweed Industry Analysis, Insights and Forecast, 2019-2031
- 10.1. Market Analysis, Insights and Forecast - by Product Type
- 10.1.1. Brown Seaweed
- 10.1.2. Green Seaweed
- 10.1.3. Red Seaweed
- 10.2. Market Analysis, Insights and Forecast - by Application
- 10.2.1. Food and Beverages
- 10.2.2. Dietary Supplements
- 10.2.3. Pharmaceuticals
- 10.2.4. Other Applications
- 10.1. Market Analysis, Insights and Forecast - by Product Type
- 11. North America Commercial Seaweed Industry Analysis, Insights and Forecast, 2019-2031
- 11.1. Market Analysis, Insights and Forecast - By Country/Sub-region
- 11.1.1 United States
- 11.1.2 Canada
- 11.1.3 Mexico
- 11.1.4 Rest of North America
- 12. Europe Commercial Seaweed Industry Analysis, Insights and Forecast, 2019-2031
- 12.1. Market Analysis, Insights and Forecast - By Country/Sub-region
- 12.1.1 Germany
- 12.1.2 United Kingdom
- 12.1.3 France
- 12.1.4 Spain
- 12.1.5 Russia
- 12.1.6 Italy
- 12.1.7 Rest of Europe
- 13. Asia Pacific Commercial Seaweed Industry Analysis, Insights and Forecast, 2019-2031
- 13.1. Market Analysis, Insights and Forecast - By Country/Sub-region
- 13.1.1 China
- 13.1.2 India
- 13.1.3 Japan
- 13.1.4 Australia
- 13.1.5 Rest of Asia Pacific
- 14. South America Commercial Seaweed Industry Analysis, Insights and Forecast, 2019-2031
- 14.1. Market Analysis, Insights and Forecast - By Country/Sub-region
- 14.1.1 Brazil
- 14.1.2 Argentina
- 14.1.3 Rest of South America
- 15. Middle East and Africa Commercial Seaweed Industry Analysis, Insights and Forecast, 2019-2031
- 15.1. Market Analysis, Insights and Forecast - By Country/Sub-region
- 15.1.1 United Arab Emirates
- 15.1.2 South Africa
- 15.1.3 Rest Middle East and Africa
- 16. Competitive Analysis
- 16.1. Global Market Share Analysis 2024
- 16.2. Company Profiles
- 16.2.1 CP Kelco US Inc
- 16.2.1.1. Overview
- 16.2.1.2. Products
- 16.2.1.3. SWOT Analysis
- 16.2.1.4. Recent Developments
- 16.2.1.5. Financials (Based on Availability)
- 16.2.2 Cargill Incorporated
- 16.2.2.1. Overview
- 16.2.2.2. Products
- 16.2.2.3. SWOT Analysis
- 16.2.2.4. Recent Developments
- 16.2.2.5. Financials (Based on Availability)
- 16.2.3 Brandt Consolidated Inc
- 16.2.3.1. Overview
- 16.2.3.2. Products
- 16.2.3.3. SWOT Analysis
- 16.2.3.4. Recent Developments
- 16.2.3.5. Financials (Based on Availability)
- 16.2.4 Seasol International
- 16.2.4.1. Overview
- 16.2.4.2. Products
- 16.2.4.3. SWOT Analysis
- 16.2.4.4. Recent Developments
- 16.2.4.5. Financials (Based on Availability)
- 16.2.5 Gelymar
- 16.2.5.1. Overview
- 16.2.5.2. Products
- 16.2.5.3. SWOT Analysis
- 16.2.5.4. Recent Developments
- 16.2.5.5. Financials (Based on Availability)
- 16.2.6 E I du Pont de Nemours & Company
- 16.2.6.1. Overview
- 16.2.6.2. Products
- 16.2.6.3. SWOT Analysis
- 16.2.6.4. Recent Developments
- 16.2.6.5. Financials (Based on Availability)
- 16.2.7 Rhodomaxx
- 16.2.7.1. Overview
- 16.2.7.2. Products
- 16.2.7.3. SWOT Analysis
- 16.2.7.4. Recent Developments
- 16.2.7.5. Financials (Based on Availability)
- 16.2.8 Algaia SA*List Not Exhaustive
- 16.2.8.1. Overview
- 16.2.8.2. Products
- 16.2.8.3. SWOT Analysis
- 16.2.8.4. Recent Developments
- 16.2.8.5. Financials (Based on Availability)
- 16.2.9 Dycolor Seaweed Industries
- 16.2.9.1. Overview
- 16.2.9.2. Products
- 16.2.9.3. SWOT Analysis
- 16.2.9.4. Recent Developments
- 16.2.9.5. Financials (Based on Availability)
- 16.2.10 Acadian Seaplants
- 16.2.10.1. Overview
- 16.2.10.2. Products
- 16.2.10.3. SWOT Analysis
- 16.2.10.4. Recent Developments
- 16.2.10.5. Financials (Based on Availability)
- 16.2.1 CP Kelco US Inc
List of Figures
- Figure 1: Global Commercial Seaweed Industry Revenue Breakdown (Million, %) by Region 2024 & 2032
- Figure 2: North America Commercial Seaweed Industry Revenue (Million), by Country 2024 & 2032
- Figure 3: North America Commercial Seaweed Industry Revenue Share (%), by Country 2024 & 2032
- Figure 4: Europe Commercial Seaweed Industry Revenue (Million), by Country 2024 & 2032
- Figure 5: Europe Commercial Seaweed Industry Revenue Share (%), by Country 2024 & 2032
- Figure 6: Asia Pacific Commercial Seaweed Industry Revenue (Million), by Country 2024 & 2032
- Figure 7: Asia Pacific Commercial Seaweed Industry Revenue Share (%), by Country 2024 & 2032
- Figure 8: South America Commercial Seaweed Industry Revenue (Million), by Country 2024 & 2032
- Figure 9: South America Commercial Seaweed Industry Revenue Share (%), by Country 2024 & 2032
- Figure 10: Middle East and Africa Commercial Seaweed Industry Revenue (Million), by Country 2024 & 2032
- Figure 11: Middle East and Africa Commercial Seaweed Industry Revenue Share (%), by Country 2024 & 2032
- Figure 12: North America Commercial Seaweed Industry Revenue (Million), by Product Type 2024 & 2032
- Figure 13: North America Commercial Seaweed Industry Revenue Share (%), by Product Type 2024 & 2032
- Figure 14: North America Commercial Seaweed Industry Revenue (Million), by Application 2024 & 2032
- Figure 15: North America Commercial Seaweed Industry Revenue Share (%), by Application 2024 & 2032
- Figure 16: North America Commercial Seaweed Industry Revenue (Million), by Country 2024 & 2032
- Figure 17: North America Commercial Seaweed Industry Revenue Share (%), by Country 2024 & 2032
- Figure 18: Europe Commercial Seaweed Industry Revenue (Million), by Product Type 2024 & 2032
- Figure 19: Europe Commercial Seaweed Industry Revenue Share (%), by Product Type 2024 & 2032
- Figure 20: Europe Commercial Seaweed Industry Revenue (Million), by Application 2024 & 2032
- Figure 21: Europe Commercial Seaweed Industry Revenue Share (%), by Application 2024 & 2032
- Figure 22: Europe Commercial Seaweed Industry Revenue (Million), by Country 2024 & 2032
- Figure 23: Europe Commercial Seaweed Industry Revenue Share (%), by Country 2024 & 2032
- Figure 24: Asia Pacific Commercial Seaweed Industry Revenue (Million), by Product Type 2024 & 2032
- Figure 25: Asia Pacific Commercial Seaweed Industry Revenue Share (%), by Product Type 2024 & 2032
- Figure 26: Asia Pacific Commercial Seaweed Industry Revenue (Million), by Application 2024 & 2032
- Figure 27: Asia Pacific Commercial Seaweed Industry Revenue Share (%), by Application 2024 & 2032
- Figure 28: Asia Pacific Commercial Seaweed Industry Revenue (Million), by Country 2024 & 2032
- Figure 29: Asia Pacific Commercial Seaweed Industry Revenue Share (%), by Country 2024 & 2032
- Figure 30: South America Commercial Seaweed Industry Revenue (Million), by Product Type 2024 & 2032
- Figure 31: South America Commercial Seaweed Industry Revenue Share (%), by Product Type 2024 & 2032
- Figure 32: South America Commercial Seaweed Industry Revenue (Million), by Application 2024 & 2032
- Figure 33: South America Commercial Seaweed Industry Revenue Share (%), by Application 2024 & 2032
- Figure 34: South America Commercial Seaweed Industry Revenue (Million), by Country 2024 & 2032
- Figure 35: South America Commercial Seaweed Industry Revenue Share (%), by Country 2024 & 2032
- Figure 36: Middle East and Africa Commercial Seaweed Industry Revenue (Million), by Product Type 2024 & 2032
- Figure 37: Middle East and Africa Commercial Seaweed Industry Revenue Share (%), by Product Type 2024 & 2032
- Figure 38: Middle East and Africa Commercial Seaweed Industry Revenue (Million), by Application 2024 & 2032
- Figure 39: Middle East and Africa Commercial Seaweed Industry Revenue Share (%), by Application 2024 & 2032
- Figure 40: Middle East and Africa Commercial Seaweed Industry Revenue (Million), by Country 2024 & 2032
- Figure 41: Middle East and Africa Commercial Seaweed Industry Revenue Share (%), by Country 2024 & 2032
List of Tables
- Table 1: Global Commercial Seaweed Industry Revenue Million Forecast, by Region 2019 & 2032
- Table 2: Global Commercial Seaweed Industry Revenue Million Forecast, by Product Type 2019 & 2032
- Table 3: Global Commercial Seaweed Industry Revenue Million Forecast, by Application 2019 & 2032
- Table 4: Global Commercial Seaweed Industry Revenue Million Forecast, by Region 2019 & 2032
- Table 5: Global Commercial Seaweed Industry Revenue Million Forecast, by Country 2019 & 2032
- Table 6: United States Commercial Seaweed Industry Revenue (Million) Forecast, by Application 2019 & 2032
- Table 7: Canada Commercial Seaweed Industry Revenue (Million) Forecast, by Application 2019 & 2032
- Table 8: Mexico Commercial Seaweed Industry Revenue (Million) Forecast, by Application 2019 & 2032
- Table 9: Rest of North America Commercial Seaweed Industry Revenue (Million) Forecast, by Application 2019 & 2032
- Table 10: Global Commercial Seaweed Industry Revenue Million Forecast, by Country 2019 & 2032
- Table 11: Germany Commercial Seaweed Industry Revenue (Million) Forecast, by Application 2019 & 2032
- Table 12: United Kingdom Commercial Seaweed Industry Revenue (Million) Forecast, by Application 2019 & 2032
- Table 13: France Commercial Seaweed Industry Revenue (Million) Forecast, by Application 2019 & 2032
- Table 14: Spain Commercial Seaweed Industry Revenue (Million) Forecast, by Application 2019 & 2032
- Table 15: Russia Commercial Seaweed Industry Revenue (Million) Forecast, by Application 2019 & 2032
- Table 16: Italy Commercial Seaweed Industry Revenue (Million) Forecast, by Application 2019 & 2032
- Table 17: Rest of Europe Commercial Seaweed Industry Revenue (Million) Forecast, by Application 2019 & 2032
- Table 18: Global Commercial Seaweed Industry Revenue Million Forecast, by Country 2019 & 2032
- Table 19: China Commercial Seaweed Industry Revenue (Million) Forecast, by Application 2019 & 2032
- Table 20: India Commercial Seaweed Industry Revenue (Million) Forecast, by Application 2019 & 2032
- Table 21: Japan Commercial Seaweed Industry Revenue (Million) Forecast, by Application 2019 & 2032
- Table 22: Australia Commercial Seaweed Industry Revenue (Million) Forecast, by Application 2019 & 2032
- Table 23: Rest of Asia Pacific Commercial Seaweed Industry Revenue (Million) Forecast, by Application 2019 & 2032
- Table 24: Global Commercial Seaweed Industry Revenue Million Forecast, by Country 2019 & 2032
- Table 25: Brazil Commercial Seaweed Industry Revenue (Million) Forecast, by Application 2019 & 2032
- Table 26: Argentina Commercial Seaweed Industry Revenue (Million) Forecast, by Application 2019 & 2032
- Table 27: Rest of South America Commercial Seaweed Industry Revenue (Million) Forecast, by Application 2019 & 2032
- Table 28: Global Commercial Seaweed Industry Revenue Million Forecast, by Country 2019 & 2032
- Table 29: United Arab Emirates Commercial Seaweed Industry Revenue (Million) Forecast, by Application 2019 & 2032
- Table 30: South Africa Commercial Seaweed Industry Revenue (Million) Forecast, by Application 2019 & 2032
- Table 31: Rest Middle East and Africa Commercial Seaweed Industry Revenue (Million) Forecast, by Application 2019 & 2032
- Table 32: Global Commercial Seaweed Industry Revenue Million Forecast, by Product Type 2019 & 2032
- Table 33: Global Commercial Seaweed Industry Revenue Million Forecast, by Application 2019 & 2032
- Table 34: Global Commercial Seaweed Industry Revenue Million Forecast, by Country 2019 & 2032
- Table 35: United States Commercial Seaweed Industry Revenue (Million) Forecast, by Application 2019 & 2032
- Table 36: Canada Commercial Seaweed Industry Revenue (Million) Forecast, by Application 2019 & 2032
- Table 37: Mexico Commercial Seaweed Industry Revenue (Million) Forecast, by Application 2019 & 2032
- Table 38: Rest of North America Commercial Seaweed Industry Revenue (Million) Forecast, by Application 2019 & 2032
- Table 39: Global Commercial Seaweed Industry Revenue Million Forecast, by Product Type 2019 & 2032
- Table 40: Global Commercial Seaweed Industry Revenue Million Forecast, by Application 2019 & 2032
- Table 41: Global Commercial Seaweed Industry Revenue Million Forecast, by Country 2019 & 2032
- Table 42: Germany Commercial Seaweed Industry Revenue (Million) Forecast, by Application 2019 & 2032
- Table 43: United Kingdom Commercial Seaweed Industry Revenue (Million) Forecast, by Application 2019 & 2032
- Table 44: France Commercial Seaweed Industry Revenue (Million) Forecast, by Application 2019 & 2032
- Table 45: Spain Commercial Seaweed Industry Revenue (Million) Forecast, by Application 2019 & 2032
- Table 46: Russia Commercial Seaweed Industry Revenue (Million) Forecast, by Application 2019 & 2032
- Table 47: Italy Commercial Seaweed Industry Revenue (Million) Forecast, by Application 2019 & 2032
- Table 48: Rest of Europe Commercial Seaweed Industry Revenue (Million) Forecast, by Application 2019 & 2032
- Table 49: Global Commercial Seaweed Industry Revenue Million Forecast, by Product Type 2019 & 2032
- Table 50: Global Commercial Seaweed Industry Revenue Million Forecast, by Application 2019 & 2032
- Table 51: Global Commercial Seaweed Industry Revenue Million Forecast, by Country 2019 & 2032
- Table 52: China Commercial Seaweed Industry Revenue (Million) Forecast, by Application 2019 & 2032
- Table 53: India Commercial Seaweed Industry Revenue (Million) Forecast, by Application 2019 & 2032
- Table 54: Japan Commercial Seaweed Industry Revenue (Million) Forecast, by Application 2019 & 2032
- Table 55: Australia Commercial Seaweed Industry Revenue (Million) Forecast, by Application 2019 & 2032
- Table 56: Rest of Asia Pacific Commercial Seaweed Industry Revenue (Million) Forecast, by Application 2019 & 2032
- Table 57: Global Commercial Seaweed Industry Revenue Million Forecast, by Product Type 2019 & 2032
- Table 58: Global Commercial Seaweed Industry Revenue Million Forecast, by Application 2019 & 2032
- Table 59: Global Commercial Seaweed Industry Revenue Million Forecast, by Country 2019 & 2032
- Table 60: Brazil Commercial Seaweed Industry Revenue (Million) Forecast, by Application 2019 & 2032
- Table 61: Argentina Commercial Seaweed Industry Revenue (Million) Forecast, by Application 2019 & 2032
- Table 62: Rest of South America Commercial Seaweed Industry Revenue (Million) Forecast, by Application 2019 & 2032
- Table 63: Global Commercial Seaweed Industry Revenue Million Forecast, by Product Type 2019 & 2032
- Table 64: Global Commercial Seaweed Industry Revenue Million Forecast, by Application 2019 & 2032
- Table 65: Global Commercial Seaweed Industry Revenue Million Forecast, by Country 2019 & 2032
- Table 66: United Arab Emirates Commercial Seaweed Industry Revenue (Million) Forecast, by Application 2019 & 2032
- Table 67: South Africa Commercial Seaweed Industry Revenue (Million) Forecast, by Application 2019 & 2032
- Table 68: Rest Middle East and Africa Commercial Seaweed Industry Revenue (Million) Forecast, by Application 2019 & 2032
Frequently Asked Questions
1. What is the projected Compound Annual Growth Rate (CAGR) of the Commercial Seaweed Industry?
The projected CAGR is approximately 8.18%.
2. Which companies are prominent players in the Commercial Seaweed Industry?
Key companies in the market include CP Kelco US Inc, Cargill Incorporated, Brandt Consolidated Inc, Seasol International, Gelymar, E I du Pont de Nemours & Company, Rhodomaxx, Algaia SA*List Not Exhaustive, Dycolor Seaweed Industries, Acadian Seaplants.
3. What are the main segments of the Commercial Seaweed Industry?
The market segments include Product Type, Application.
4. Can you provide details about the market size?
The market size is estimated to be USD 19.09 Million as of 2022.
5. What are some drivers contributing to market growth?
Increasing Demand for Low-Fat and Low-Calorie Food; Increasing Product Innovation.
6. What are the notable trends driving market growth?
Increased Usage of Seaweed in Food Sector due to it Functional Properties and Nutritional Benefits.
7. Are there any restraints impacting market growth?
; Threat of New Entrants; Bargaining Power of Buyers/Consumers; Bargaining Power of Suppliers; Threat of Substitute Products; Degree Of Competition.
8. Can you provide examples of recent developments in the market?
September 2022: CadalminTM LivCure extract, a patent-protected nutraceutical product developed by the ICAR-Central Marine Fisheries Research Institute (CMFRI) from seaweeds to combat non-alcoholic fatty liver disease, will be available in the market soon. The product contains 100% natural bioactive ingredients extracted from select seaweeds. The product is made using eco-friendly green technology to improve liver health and is the 9th nutraceutical developed by CMFRI
9. What pricing options are available for accessing the report?
Pricing options include single-user, multi-user, and enterprise licenses priced at USD 4750, USD 5250, and USD 8750 respectively.
10. Is the market size provided in terms of value or volume?
The market size is provided in terms of value, measured in Million.
11. Are there any specific market keywords associated with the report?
Yes, the market keyword associated with the report is "Commercial Seaweed Industry," which aids in identifying and referencing the specific market segment covered.
12. How do I determine which pricing option suits my needs best?
The pricing options vary based on user requirements and access needs. Individual users may opt for single-user licenses, while businesses requiring broader access may choose multi-user or enterprise licenses for cost-effective access to the report.
13. Are there any additional resources or data provided in the Commercial Seaweed Industry report?
While the report offers comprehensive insights, it's advisable to review the specific contents or supplementary materials provided to ascertain if additional resources or data are available.
14. How can I stay updated on further developments or reports in the Commercial Seaweed Industry?
To stay informed about further developments, trends, and reports in the Commercial Seaweed Industry, consider subscribing to industry newsletters, following relevant companies and organizations, or regularly checking reputable industry news sources and publications.
Methodology
Step 1 - Identification of Relevant Samples Size from Population Database


Step 2 - Approaches for Defining Global Market Size (Value, Volume* & Price*)

Note*: In applicable scenarios
Step 3 - Data Sources
Primary Research
- Web Analytics
- Survey Reports
- Research Institute
- Latest Research Reports
- Opinion Leaders
Secondary Research
- Annual Reports
- White Paper
- Latest Press Release
- Industry Association
- Paid Database
- Investor Presentations

Step 4 - Data Triangulation
Involves using different sources of information in order to increase the validity of a study
These sources are likely to be stakeholders in a program - participants, other researchers, program staff, other community members, and so on.
Then we put all data in single framework & apply various statistical tools to find out the dynamic on the market.
During the analysis stage, feedback from the stakeholder groups would be compared to determine areas of agreement as well as areas of divergence


