

Key Insights
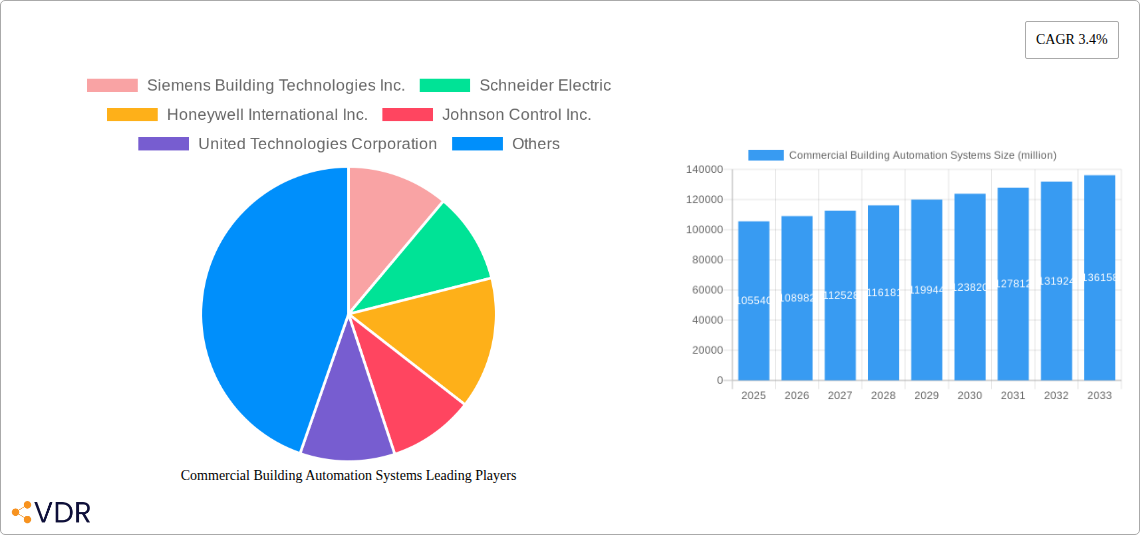
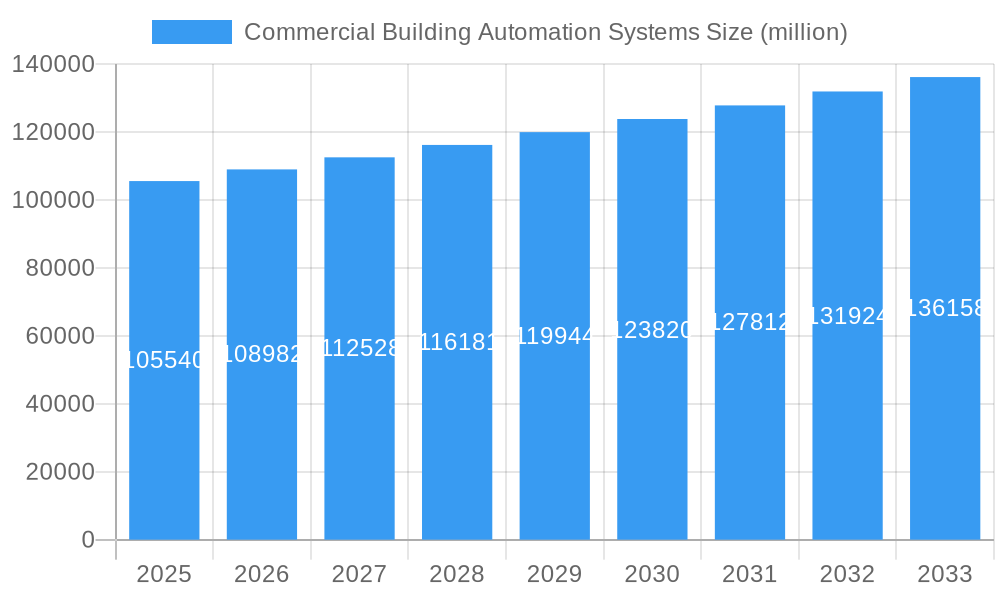
The global Commercial Building Automation Systems (BAS) market is poised for robust growth, projected to reach an estimated market size of $105,540 million by 2025, with a steady Compound Annual Growth Rate (CAGR) of 3.4% anticipated through 2033. This expansion is primarily driven by an increasing emphasis on energy efficiency, sustainability mandates, and the growing adoption of smart building technologies across diverse commercial sectors. As a critical component of modern infrastructure, BAS solutions are integral to optimizing building operations, reducing operational costs, and enhancing occupant comfort and safety. The market is characterized by a strong demand for HVAC controls, a significant segment that directly impacts energy consumption, followed closely by lighting controls, fire & life safety systems, and security & access controls, all crucial for modern building management. The integration of Building Energy Management Systems (BEMS) is also gaining considerable traction, empowering facility managers with comprehensive insights and control over their building's performance.
Commercial Building Automation Systems Market Size (In Billion)
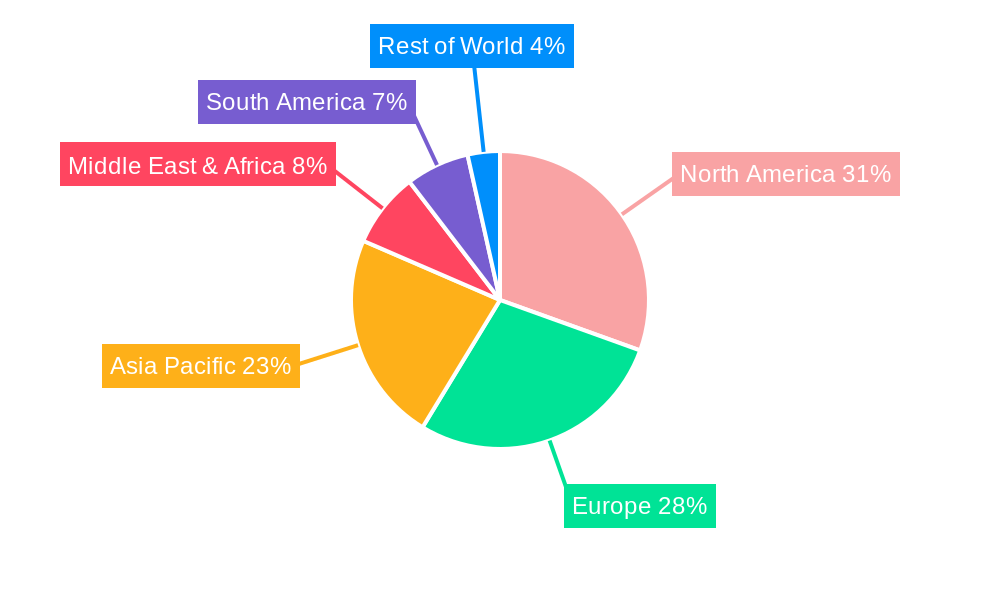
The market's trajectory is further shaped by evolving trends such as the integration of artificial intelligence (AI) and the Internet of Things (IoT) for predictive maintenance and enhanced automation capabilities. The increasing need for cybersecurity in interconnected building systems, alongside the growing demand for retrofitting older buildings with advanced BAS, presents significant opportunities. While market growth is generally positive, potential restraints include the high initial investment costs for some advanced solutions and the need for skilled personnel to implement and manage complex BAS. However, the long-term benefits of reduced energy consumption, improved operational efficiency, and compliance with environmental regulations are expected to outweigh these challenges. Geographically, North America and Europe currently represent substantial market shares due to established smart building infrastructure and stringent energy efficiency standards. The Asia Pacific region is emerging as a significant growth driver, fueled by rapid urbanization, increased construction activities, and the adoption of cutting-edge technologies in developing economies like China and India.
Commercial Building Automation Systems Company Market Share
Commercial Building Automation Systems Market Dynamics & Structure
The global Commercial Building Automation Systems (BAS) market is characterized by a moderately concentrated landscape, with key players like Siemens Building Technologies Inc., Schneider Electric, Honeywell International Inc., Johnson Controls Inc., and United Technologies Corporation holding significant market share. Technological innovation remains a primary driver, fueled by the increasing demand for energy efficiency, occupant comfort, and enhanced security. The integration of IoT, AI, and cloud computing is revolutionizing BAS capabilities, enabling predictive maintenance, smart energy management, and personalized occupant experiences. Regulatory frameworks, particularly those focused on energy conservation and building safety standards, are also shaping market growth. While competitive product substitutes exist, such as standalone smart devices, comprehensive BAS offers integrated solutions that are increasingly favored. End-user demographics are shifting, with a growing preference for smart, sustainable, and data-driven building management across all segments. Mergers and acquisitions (M&A) trends are active, with larger players acquiring innovative startups to expand their technological portfolios and market reach. For instance, the past few years have seen several strategic acquisitions aimed at bolstering AI and cybersecurity capabilities within BAS. The barriers to entry are moderate, primarily due to the high capital investment required for R&D and the need for specialized expertise. The market size for Commercial Building Automation Systems is projected to reach approximately $35,000 million by 2025, with a projected compound annual growth rate (CAGR) of around 8.5% during the forecast period (2025–2033).
- Market Concentration: Dominated by a few large multinational corporations, but with growing influence of specialized solution providers.
- Technological Innovation Drivers: IoT integration, AI-powered analytics, cloud-based platforms, cybersecurity enhancements, energy efficiency mandates.
- Regulatory Frameworks: Energy Star certifications, LEED standards, building code updates, data privacy regulations.
- Competitive Product Substitutes: Standalone smart thermostats, individual security systems, basic lighting control systems.
- End-User Demographics: Increasing demand from facility managers, building owners, and end-occupants for comfort, security, and cost savings.
- M&A Trends: Active consolidation to gain technological edge, expand service offerings, and broaden geographical reach.
Commercial Building Automation Systems Growth Trends & Insights
The global Commercial Building Automation Systems (BAS) market is poised for robust growth, driven by an escalating demand for intelligent, energy-efficient, and secure built environments. The market size for Commercial Building Automation Systems, which stood at approximately $25,000 million in 2024, is projected to expand significantly to an estimated $35,000 million by 2025. This growth trajectory is further underscored by a projected Compound Annual Growth Rate (CAGR) of approximately 8.5% for the forecast period spanning from 2025 to 2033. Adoption rates for advanced BAS solutions are accelerating across various end-user segments, including commercial offices, healthcare facilities, and retail spaces, as organizations increasingly recognize the long-term economic and environmental benefits. Technological disruptions, such as the widespread integration of the Internet of Things (IoT), artificial intelligence (AI), and machine learning (ML), are fundamentally reshaping the BAS landscape. These advancements are enabling predictive maintenance, optimizing energy consumption through sophisticated algorithms, and enhancing occupant comfort and safety through personalized control. Consumer behavior shifts are also playing a crucial role, with a growing emphasis on sustainability, occupant well-being, and data-driven decision-making. Building owners and facility managers are actively seeking solutions that can provide granular insights into building performance, reduce operational costs, and improve the overall tenant experience. The market penetration of sophisticated BAS is steadily increasing, moving beyond basic HVAC and lighting controls to encompass integrated security, access control, and energy management systems. The historical period from 2019 to 2024 witnessed a steady rise in BAS adoption, driven by a growing awareness of energy efficiency benefits and increasing construction of smart buildings. The base year of 2025 is expected to see substantial market value, laying a strong foundation for the substantial growth anticipated in the subsequent forecast period. The ongoing digital transformation in the built environment, coupled with stringent government regulations on energy consumption, will continue to be primary catalysts for the sustained expansion of the commercial BAS market.
Dominant Regions, Countries, or Segments in Commercial Building Automation Systems
North America currently stands as the dominant region in the Commercial Building Automation Systems (BAS) market, driven by a confluence of strong economic policies, advanced technological infrastructure, and a mature market for smart building solutions. The United States, in particular, exhibits high adoption rates due to its proactive stance on energy efficiency standards and a significant commercial real estate sector. Key drivers in this region include stringent building codes mandating energy conservation, substantial investments in smart city initiatives, and a high concentration of forward-thinking corporations that prioritize sustainable operations and enhanced occupant comfort. The country's well-established HVAC Controls and Lighting Controls segments are cornerstones of its BAS market dominance, alongside a robust demand for Security & Access Controls and Fire & Life Safety Systems in commercial establishments.
Application Dominance:
- Office Buildings: Represent a significant portion of the market due to the extensive adoption of BAS for optimizing energy usage, improving employee productivity, and ensuring a comfortable working environment. The market value for this segment is projected to reach approximately $10,000 million by 2025.
- Hospitals and Healthcare Facilities: Driven by the critical need for precise environmental control, enhanced security, and energy management to ensure patient well-being and operational efficiency. This segment is expected to grow at a CAGR of 9.0% during the forecast period, with an estimated market value of $7,000 million by 2025.
- Factories and Plants: Increasingly adopting BAS for process optimization, energy efficiency, and safety compliance, contributing significantly to market growth.
Type Dominance:
- HVAC Controls: Remain the largest segment within BAS, accounting for a substantial market share due to their critical role in energy consumption and occupant comfort. The market value for HVAC Controls is estimated at $12,000 million by 2025.
- Building Energy Management Systems (BEMS): Experiencing rapid growth as organizations seek to gain comprehensive insights into their energy consumption and implement cost-saving strategies. BEMS are projected to have a CAGR of 9.2% from 2025 to 2033.
- Security & Access Controls: Integral to modern building management, driven by evolving security threats and the need for integrated security solutions.
The ongoing digitalization of commercial spaces, coupled with government incentives and a growing awareness of the return on investment (ROI) associated with BAS, are further solidifying the dominance of these segments and regions. The estimated market value for commercial building automation systems in North America is projected to be around $15,000 million by 2025, with a significant contribution from the aforementioned segments and applications.
Commercial Building Automation Systems Product Landscape
The commercial building automation systems (BAS) product landscape is characterized by a surge in intelligent, integrated, and data-driven solutions. Innovations are heavily focused on IoT connectivity, enabling seamless communication between devices and platforms. Advanced HVAC controls now incorporate predictive analytics for optimizing energy consumption based on occupancy patterns and weather forecasts, leading to significant cost savings. Lighting controls are evolving beyond simple on/off functions to include dynamic daylight harvesting and occupancy-based dimming, further enhancing energy efficiency. Fire & Life Safety Systems are becoming smarter, with integrated sensors and advanced analytics for faster and more accurate threat detection and response. Security & Access Controls are leveraging AI for facial recognition and behavioral analysis, providing enhanced security layers. Building Energy Management Systems (BEMS) are at the forefront of integrating all these components, offering a unified platform for monitoring, controlling, and optimizing building performance. Unique selling propositions include enhanced cybersecurity features, cloud-based accessibility for remote management, and user-friendly interfaces designed for facility managers of all technical expertise levels. The market is seeing a rise in modular and scalable solutions, allowing buildings to adapt to changing needs and technological advancements.
Key Drivers, Barriers & Challenges in Commercial Building Automation Systems
Key Drivers: The Commercial Building Automation Systems (BAS) market is propelled by several key drivers. Firstly, the escalating global demand for energy efficiency and sustainability, driven by environmental concerns and stringent government regulations, is a primary catalyst. This is further amplified by rising energy costs, encouraging building owners to invest in systems that optimize consumption. The growing adoption of IoT and AI technologies enables more sophisticated control, predictive maintenance, and data analytics, leading to smarter and more efficient buildings. The increasing focus on occupant comfort and productivity in commercial spaces also drives demand for personalized environmental controls. Furthermore, the need for enhanced building security and safety, coupled with the integration of fire and life safety systems, contributes significantly to market growth. The projected market size for Commercial Building Automation Systems in 2025 is $35,000 million, highlighting the impact of these drivers.
Barriers & Challenges: Despite the strong growth prospects, the BAS market faces several barriers and challenges. The initial high upfront cost of implementation can be a deterrent for some smaller businesses. Cybersecurity concerns, given the increasing connectivity of BAS, pose a significant challenge, requiring robust security measures to prevent breaches. The complexity of integrating diverse systems from different vendors can lead to interoperability issues, demanding specialized expertise. A shortage of skilled professionals to install, maintain, and operate these advanced systems also presents a hurdle. Additionally, the evolving nature of technology requires continuous upgrades and investments, which can strain budgets. Supply chain disruptions and the availability of key components can impact project timelines and costs, especially given the current global economic climate.
Emerging Opportunities in Commercial Building Automation Systems
Emerging opportunities in the Commercial Building Automation Systems (BAS) sector are abundant, particularly in the realm of predictive analytics and AI-driven optimization. The growing demand for smart grids and integration with renewable energy sources presents a significant avenue for growth, enabling buildings to actively participate in energy management. The expansion of IoT devices and sensors is creating more granular data collection capabilities, paving the way for highly personalized occupant experiences and micro-climate control within buildings. Furthermore, the increasing focus on health and well-being in post-pandemic scenarios is driving the demand for BAS solutions that can monitor and improve indoor air quality and hygiene. Untapped markets in developing economies, coupled with the retrofitting of existing buildings with modern BAS, represent substantial growth potential. The integration of BAS with other smart city technologies offers synergistic opportunities for creating more connected and sustainable urban environments.
Growth Accelerators in the Commercial Building Automation Systems Industry
Several catalysts are accelerating the long-term growth of the Commercial Building Automation Systems (BAS) industry. Technological breakthroughs in AI, machine learning, and edge computing are enabling more sophisticated automation, predictive maintenance, and real-time decision-making, thereby enhancing operational efficiency and reducing costs. Strategic partnerships between BAS providers, technology firms, and cybersecurity specialists are crucial for developing integrated and secure solutions that meet evolving market demands. Market expansion strategies, including the penetration into emerging economies and the focus on retrofitting older buildings with advanced BAS, are also significant growth accelerators. The increasing adoption of green building standards and certifications globally is further pushing the demand for energy-efficient BAS solutions. Finally, the growing awareness among building owners and facility managers about the tangible ROI and benefits of BAS, including improved occupant comfort, productivity, and reduced operational expenditures, is a powerful engine for sustained growth.
Key Players Shaping the Commercial Building Automation Systems Market
- Siemens Building Technologies Inc.
- Schneider Electric
- Honeywell International Inc.
- Johnson Controls Inc.
- United Technologies Corporation
- ABB Limited
- Azbil Corporation
- Eaton Corporation
- General Electric
- Ingersoll Rand Inc.
Notable Milestones in Commercial Building Automation Systems Sector
- 2023 (Ongoing): Increased integration of AI and machine learning for predictive analytics and autonomous building operations.
- 2022: Expansion of cloud-based BAS platforms, enabling remote monitoring and control from anywhere.
- 2021: Heightened focus on cybersecurity measures within BAS to address growing cyber threats.
- 2020: Rise in demand for BAS solutions that enhance indoor air quality and occupant well-being, spurred by the pandemic.
- 2019: Significant advancements in IoT sensor technology, enabling more granular data collection for building performance optimization.
- 2018: Increased M&A activity as larger players acquired innovative startups to enhance their BAS portfolios.
In-Depth Commercial Building Automation Systems Market Outlook
The Commercial Building Automation Systems (BAS) market is poised for substantial and sustained growth, driven by a powerful combination of technological innovation, regulatory push, and evolving market demands. The industry's future is intrinsically linked to the broader trend of digitalization and sustainability in the built environment. Growth accelerators such as advanced AI for predictive analytics, the proliferation of IoT devices, and strategic partnerships are expected to drive significant market expansion. The estimated market size for Commercial Building Automation Systems is projected to reach $35,000 million by 2025, with a robust CAGR of 8.5% expected during the forecast period (2025–2033). Opportunities lie in the increasing demand for integrated energy management solutions, smart grid connectivity, and personalized occupant experiences. The continuous retrofitting of existing commercial buildings and the development of smart cities will further fuel this growth trajectory, ensuring a dynamic and promising outlook for the BAS sector.
Commercial Building Automation Systems Segmentation
-
1. Application
- 1.1. Hospitals and Healthcare Facilities
- 1.2. Airports, Railway and Transportation
- 1.3. Office Buildings
- 1.4. Retail and Public Assembly Buildings
- 1.5. Factories and Plants
- 1.6. Schools
- 1.7. Others
-
2. Type
- 2.1. HVAC Controls
- 2.2. Lighting Controls
- 2.3. Fire & Life Safety Systems
- 2.4. Security & Access Controls
- 2.5. Building Energy Management System
- 2.6. Others
Commercial Building Automation Systems Segmentation By Geography
-
1. North America
- 1.1. United States
- 1.2. Canada
- 1.3. Mexico
-
2. South America
- 2.1. Brazil
- 2.2. Argentina
- 2.3. Rest of South America
-
3. Europe
- 3.1. United Kingdom
- 3.2. Germany
- 3.3. France
- 3.4. Italy
- 3.5. Spain
- 3.6. Russia
- 3.7. Benelux
- 3.8. Nordics
- 3.9. Rest of Europe
-
4. Middle East & Africa
- 4.1. Turkey
- 4.2. Israel
- 4.3. GCC
- 4.4. North Africa
- 4.5. South Africa
- 4.6. Rest of Middle East & Africa
-
5. Asia Pacific
- 5.1. China
- 5.2. India
- 5.3. Japan
- 5.4. South Korea
- 5.5. ASEAN
- 5.6. Oceania
- 5.7. Rest of Asia Pacific
Commercial Building Automation Systems Regional Market Share
Geographic Coverage of Commercial Building Automation Systems
Commercial Building Automation Systems REPORT HIGHLIGHTS
| Aspects | Details |
|---|---|
| Study Period | 2020-2034 |
| Base Year | 2025 |
| Estimated Year | 2026 |
| Forecast Period | 2026-2034 |
| Historical Period | 2020-2025 |
| Growth Rate | CAGR of 3.4% from 2020-2034 |
| Segmentation |
|
Table of Contents
- 1. Introduction
- 1.1. Research Scope
- 1.2. Market Segmentation
- 1.3. Research Objective
- 1.4. Definitions and Assumptions
- 2. Executive Summary
- 2.1. Market Snapshot
- 3. Market Dynamics
- 3.1. Market Drivers
- 3.2. Market Restrains
- 3.3. Market Trends
- 3.4. Market Opportunities
- 4. Market Factor Analysis
- 4.1. Porters Five Forces
- 4.1.1. Bargaining Power of Suppliers
- 4.1.2. Bargaining Power of Buyers
- 4.1.3. Threat of New Entrants
- 4.1.4. Threat of Substitutes
- 4.1.5. Competitive Rivalry
- 4.2. PESTEL analysis
- 4.3. BCG Analysis
- 4.3.1. Stars (High Growth, High Market Share)
- 4.3.2. Cash Cows (Low Growth, High Market Share)
- 4.3.3. Question Mark (High Growth, Low Market Share)
- 4.3.4. Dogs (Low Growth, Low Market Share)
- 4.4. Ansoff Matrix Analysis
- 4.5. Supply Chain Analysis
- 4.6. Regulatory Landscape
- 4.7. Current Market Potential and Opportunity Assessment (TAM–SAM–SOM Framework)
- 4.8. VDR Analyst Note
- 4.1. Porters Five Forces
- 5. Market Analysis, Insights and Forecast 2021-2033
- 5.1. Market Analysis, Insights and Forecast - by Application
- 5.1.1. Hospitals and Healthcare Facilities
- 5.1.2. Airports, Railway and Transportation
- 5.1.3. Office Buildings
- 5.1.4. Retail and Public Assembly Buildings
- 5.1.5. Factories and Plants
- 5.1.6. Schools
- 5.1.7. Others
- 5.2. Market Analysis, Insights and Forecast - by Type
- 5.2.1. HVAC Controls
- 5.2.2. Lighting Controls
- 5.2.3. Fire & Life Safety Systems
- 5.2.4. Security & Access Controls
- 5.2.5. Building Energy Management System
- 5.2.6. Others
- 5.3. Market Analysis, Insights and Forecast - by Region
- 5.3.1. North America
- 5.3.2. South America
- 5.3.3. Europe
- 5.3.4. Middle East & Africa
- 5.3.5. Asia Pacific
- 5.1. Market Analysis, Insights and Forecast - by Application
- 6. Global Commercial Building Automation Systems Analysis, Insights and Forecast, 2021-2033
- 6.1. Market Analysis, Insights and Forecast - by Application
- 6.1.1. Hospitals and Healthcare Facilities
- 6.1.2. Airports, Railway and Transportation
- 6.1.3. Office Buildings
- 6.1.4. Retail and Public Assembly Buildings
- 6.1.5. Factories and Plants
- 6.1.6. Schools
- 6.1.7. Others
- 6.2. Market Analysis, Insights and Forecast - by Type
- 6.2.1. HVAC Controls
- 6.2.2. Lighting Controls
- 6.2.3. Fire & Life Safety Systems
- 6.2.4. Security & Access Controls
- 6.2.5. Building Energy Management System
- 6.2.6. Others
- 6.1. Market Analysis, Insights and Forecast - by Application
- 7. North America Commercial Building Automation Systems Analysis, Insights and Forecast, 2021-2033
- 7.1. Market Analysis, Insights and Forecast - by Application
- 7.1.1. Hospitals and Healthcare Facilities
- 7.1.2. Airports, Railway and Transportation
- 7.1.3. Office Buildings
- 7.1.4. Retail and Public Assembly Buildings
- 7.1.5. Factories and Plants
- 7.1.6. Schools
- 7.1.7. Others
- 7.2. Market Analysis, Insights and Forecast - by Type
- 7.2.1. HVAC Controls
- 7.2.2. Lighting Controls
- 7.2.3. Fire & Life Safety Systems
- 7.2.4. Security & Access Controls
- 7.2.5. Building Energy Management System
- 7.2.6. Others
- 7.1. Market Analysis, Insights and Forecast - by Application
- 8. South America Commercial Building Automation Systems Analysis, Insights and Forecast, 2021-2033
- 8.1. Market Analysis, Insights and Forecast - by Application
- 8.1.1. Hospitals and Healthcare Facilities
- 8.1.2. Airports, Railway and Transportation
- 8.1.3. Office Buildings
- 8.1.4. Retail and Public Assembly Buildings
- 8.1.5. Factories and Plants
- 8.1.6. Schools
- 8.1.7. Others
- 8.2. Market Analysis, Insights and Forecast - by Type
- 8.2.1. HVAC Controls
- 8.2.2. Lighting Controls
- 8.2.3. Fire & Life Safety Systems
- 8.2.4. Security & Access Controls
- 8.2.5. Building Energy Management System
- 8.2.6. Others
- 8.1. Market Analysis, Insights and Forecast - by Application
- 9. Europe Commercial Building Automation Systems Analysis, Insights and Forecast, 2021-2033
- 9.1. Market Analysis, Insights and Forecast - by Application
- 9.1.1. Hospitals and Healthcare Facilities
- 9.1.2. Airports, Railway and Transportation
- 9.1.3. Office Buildings
- 9.1.4. Retail and Public Assembly Buildings
- 9.1.5. Factories and Plants
- 9.1.6. Schools
- 9.1.7. Others
- 9.2. Market Analysis, Insights and Forecast - by Type
- 9.2.1. HVAC Controls
- 9.2.2. Lighting Controls
- 9.2.3. Fire & Life Safety Systems
- 9.2.4. Security & Access Controls
- 9.2.5. Building Energy Management System
- 9.2.6. Others
- 9.1. Market Analysis, Insights and Forecast - by Application
- 10. Middle East & Africa Commercial Building Automation Systems Analysis, Insights and Forecast, 2021-2033
- 10.1. Market Analysis, Insights and Forecast - by Application
- 10.1.1. Hospitals and Healthcare Facilities
- 10.1.2. Airports, Railway and Transportation
- 10.1.3. Office Buildings
- 10.1.4. Retail and Public Assembly Buildings
- 10.1.5. Factories and Plants
- 10.1.6. Schools
- 10.1.7. Others
- 10.2. Market Analysis, Insights and Forecast - by Type
- 10.2.1. HVAC Controls
- 10.2.2. Lighting Controls
- 10.2.3. Fire & Life Safety Systems
- 10.2.4. Security & Access Controls
- 10.2.5. Building Energy Management System
- 10.2.6. Others
- 10.1. Market Analysis, Insights and Forecast - by Application
- 11. Asia Pacific Commercial Building Automation Systems Analysis, Insights and Forecast, 2021-2033
- 11.1. Market Analysis, Insights and Forecast - by Application
- 11.1.1. Hospitals and Healthcare Facilities
- 11.1.2. Airports, Railway and Transportation
- 11.1.3. Office Buildings
- 11.1.4. Retail and Public Assembly Buildings
- 11.1.5. Factories and Plants
- 11.1.6. Schools
- 11.1.7. Others
- 11.2. Market Analysis, Insights and Forecast - by Type
- 11.2.1. HVAC Controls
- 11.2.2. Lighting Controls
- 11.2.3. Fire & Life Safety Systems
- 11.2.4. Security & Access Controls
- 11.2.5. Building Energy Management System
- 11.2.6. Others
- 11.1. Market Analysis, Insights and Forecast - by Application
- 12. Competitive Analysis
- 12.1. Company Profiles
- 12.1.1 Siemens Building Technologies Inc.
- 12.1.1.1. Company Overview
- 12.1.1.2. Products
- 12.1.1.3. Company Financials
- 12.1.1.4. SWOT Analysis
- 12.1.2 Schneider Electric
- 12.1.2.1. Company Overview
- 12.1.2.2. Products
- 12.1.2.3. Company Financials
- 12.1.2.4. SWOT Analysis
- 12.1.3 Honeywell International Inc.
- 12.1.3.1. Company Overview
- 12.1.3.2. Products
- 12.1.3.3. Company Financials
- 12.1.3.4. SWOT Analysis
- 12.1.4 Johnson Control Inc.
- 12.1.4.1. Company Overview
- 12.1.4.2. Products
- 12.1.4.3. Company Financials
- 12.1.4.4. SWOT Analysis
- 12.1.5 United Technologies Corporation
- 12.1.5.1. Company Overview
- 12.1.5.2. Products
- 12.1.5.3. Company Financials
- 12.1.5.4. SWOT Analysis
- 12.1.6 ABB Limited
- 12.1.6.1. Company Overview
- 12.1.6.2. Products
- 12.1.6.3. Company Financials
- 12.1.6.4. SWOT Analysis
- 12.1.7 Azbil Corporation
- 12.1.7.1. Company Overview
- 12.1.7.2. Products
- 12.1.7.3. Company Financials
- 12.1.7.4. SWOT Analysis
- 12.1.8 Eaton Corporation
- 12.1.8.1. Company Overview
- 12.1.8.2. Products
- 12.1.8.3. Company Financials
- 12.1.8.4. SWOT Analysis
- 12.1.9 General Electric
- 12.1.9.1. Company Overview
- 12.1.9.2. Products
- 12.1.9.3. Company Financials
- 12.1.9.4. SWOT Analysis
- 12.1.10 Ingersoll Rand Inc.
- 12.1.10.1. Company Overview
- 12.1.10.2. Products
- 12.1.10.3. Company Financials
- 12.1.10.4. SWOT Analysis
- 12.1.1 Siemens Building Technologies Inc.
- 12.2. Market Entropy
- 12.2.1 Company's Key Areas Served
- 12.2.2 Recent Developments
- 12.3. Company Market Share Analysis 2025
- 12.3.1 Top 5 Companies Market Share Analysis
- 12.3.2 Top 3 Companies Market Share Analysis
- 12.4. List of Potential Customers
- 13. Research Methodology
List of Figures
- Figure 1: Global Commercial Building Automation Systems Revenue Breakdown (million, %) by Region 2025 & 2033
- Figure 2: North America Commercial Building Automation Systems Revenue (million), by Application 2025 & 2033
- Figure 3: North America Commercial Building Automation Systems Revenue Share (%), by Application 2025 & 2033
- Figure 4: North America Commercial Building Automation Systems Revenue (million), by Type 2025 & 2033
- Figure 5: North America Commercial Building Automation Systems Revenue Share (%), by Type 2025 & 2033
- Figure 6: North America Commercial Building Automation Systems Revenue (million), by Country 2025 & 2033
- Figure 7: North America Commercial Building Automation Systems Revenue Share (%), by Country 2025 & 2033
- Figure 8: South America Commercial Building Automation Systems Revenue (million), by Application 2025 & 2033
- Figure 9: South America Commercial Building Automation Systems Revenue Share (%), by Application 2025 & 2033
- Figure 10: South America Commercial Building Automation Systems Revenue (million), by Type 2025 & 2033
- Figure 11: South America Commercial Building Automation Systems Revenue Share (%), by Type 2025 & 2033
- Figure 12: South America Commercial Building Automation Systems Revenue (million), by Country 2025 & 2033
- Figure 13: South America Commercial Building Automation Systems Revenue Share (%), by Country 2025 & 2033
- Figure 14: Europe Commercial Building Automation Systems Revenue (million), by Application 2025 & 2033
- Figure 15: Europe Commercial Building Automation Systems Revenue Share (%), by Application 2025 & 2033
- Figure 16: Europe Commercial Building Automation Systems Revenue (million), by Type 2025 & 2033
- Figure 17: Europe Commercial Building Automation Systems Revenue Share (%), by Type 2025 & 2033
- Figure 18: Europe Commercial Building Automation Systems Revenue (million), by Country 2025 & 2033
- Figure 19: Europe Commercial Building Automation Systems Revenue Share (%), by Country 2025 & 2033
- Figure 20: Middle East & Africa Commercial Building Automation Systems Revenue (million), by Application 2025 & 2033
- Figure 21: Middle East & Africa Commercial Building Automation Systems Revenue Share (%), by Application 2025 & 2033
- Figure 22: Middle East & Africa Commercial Building Automation Systems Revenue (million), by Type 2025 & 2033
- Figure 23: Middle East & Africa Commercial Building Automation Systems Revenue Share (%), by Type 2025 & 2033
- Figure 24: Middle East & Africa Commercial Building Automation Systems Revenue (million), by Country 2025 & 2033
- Figure 25: Middle East & Africa Commercial Building Automation Systems Revenue Share (%), by Country 2025 & 2033
- Figure 26: Asia Pacific Commercial Building Automation Systems Revenue (million), by Application 2025 & 2033
- Figure 27: Asia Pacific Commercial Building Automation Systems Revenue Share (%), by Application 2025 & 2033
- Figure 28: Asia Pacific Commercial Building Automation Systems Revenue (million), by Type 2025 & 2033
- Figure 29: Asia Pacific Commercial Building Automation Systems Revenue Share (%), by Type 2025 & 2033
- Figure 30: Asia Pacific Commercial Building Automation Systems Revenue (million), by Country 2025 & 2033
- Figure 31: Asia Pacific Commercial Building Automation Systems Revenue Share (%), by Country 2025 & 2033
List of Tables
- Table 1: Global Commercial Building Automation Systems Revenue million Forecast, by Application 2020 & 2033
- Table 2: Global Commercial Building Automation Systems Revenue million Forecast, by Type 2020 & 2033
- Table 3: Global Commercial Building Automation Systems Revenue million Forecast, by Region 2020 & 2033
- Table 4: Global Commercial Building Automation Systems Revenue million Forecast, by Application 2020 & 2033
- Table 5: Global Commercial Building Automation Systems Revenue million Forecast, by Type 2020 & 2033
- Table 6: Global Commercial Building Automation Systems Revenue million Forecast, by Country 2020 & 2033
- Table 7: United States Commercial Building Automation Systems Revenue (million) Forecast, by Application 2020 & 2033
- Table 8: Canada Commercial Building Automation Systems Revenue (million) Forecast, by Application 2020 & 2033
- Table 9: Mexico Commercial Building Automation Systems Revenue (million) Forecast, by Application 2020 & 2033
- Table 10: Global Commercial Building Automation Systems Revenue million Forecast, by Application 2020 & 2033
- Table 11: Global Commercial Building Automation Systems Revenue million Forecast, by Type 2020 & 2033
- Table 12: Global Commercial Building Automation Systems Revenue million Forecast, by Country 2020 & 2033
- Table 13: Brazil Commercial Building Automation Systems Revenue (million) Forecast, by Application 2020 & 2033
- Table 14: Argentina Commercial Building Automation Systems Revenue (million) Forecast, by Application 2020 & 2033
- Table 15: Rest of South America Commercial Building Automation Systems Revenue (million) Forecast, by Application 2020 & 2033
- Table 16: Global Commercial Building Automation Systems Revenue million Forecast, by Application 2020 & 2033
- Table 17: Global Commercial Building Automation Systems Revenue million Forecast, by Type 2020 & 2033
- Table 18: Global Commercial Building Automation Systems Revenue million Forecast, by Country 2020 & 2033
- Table 19: United Kingdom Commercial Building Automation Systems Revenue (million) Forecast, by Application 2020 & 2033
- Table 20: Germany Commercial Building Automation Systems Revenue (million) Forecast, by Application 2020 & 2033
- Table 21: France Commercial Building Automation Systems Revenue (million) Forecast, by Application 2020 & 2033
- Table 22: Italy Commercial Building Automation Systems Revenue (million) Forecast, by Application 2020 & 2033
- Table 23: Spain Commercial Building Automation Systems Revenue (million) Forecast, by Application 2020 & 2033
- Table 24: Russia Commercial Building Automation Systems Revenue (million) Forecast, by Application 2020 & 2033
- Table 25: Benelux Commercial Building Automation Systems Revenue (million) Forecast, by Application 2020 & 2033
- Table 26: Nordics Commercial Building Automation Systems Revenue (million) Forecast, by Application 2020 & 2033
- Table 27: Rest of Europe Commercial Building Automation Systems Revenue (million) Forecast, by Application 2020 & 2033
- Table 28: Global Commercial Building Automation Systems Revenue million Forecast, by Application 2020 & 2033
- Table 29: Global Commercial Building Automation Systems Revenue million Forecast, by Type 2020 & 2033
- Table 30: Global Commercial Building Automation Systems Revenue million Forecast, by Country 2020 & 2033
- Table 31: Turkey Commercial Building Automation Systems Revenue (million) Forecast, by Application 2020 & 2033
- Table 32: Israel Commercial Building Automation Systems Revenue (million) Forecast, by Application 2020 & 2033
- Table 33: GCC Commercial Building Automation Systems Revenue (million) Forecast, by Application 2020 & 2033
- Table 34: North Africa Commercial Building Automation Systems Revenue (million) Forecast, by Application 2020 & 2033
- Table 35: South Africa Commercial Building Automation Systems Revenue (million) Forecast, by Application 2020 & 2033
- Table 36: Rest of Middle East & Africa Commercial Building Automation Systems Revenue (million) Forecast, by Application 2020 & 2033
- Table 37: Global Commercial Building Automation Systems Revenue million Forecast, by Application 2020 & 2033
- Table 38: Global Commercial Building Automation Systems Revenue million Forecast, by Type 2020 & 2033
- Table 39: Global Commercial Building Automation Systems Revenue million Forecast, by Country 2020 & 2033
- Table 40: China Commercial Building Automation Systems Revenue (million) Forecast, by Application 2020 & 2033
- Table 41: India Commercial Building Automation Systems Revenue (million) Forecast, by Application 2020 & 2033
- Table 42: Japan Commercial Building Automation Systems Revenue (million) Forecast, by Application 2020 & 2033
- Table 43: South Korea Commercial Building Automation Systems Revenue (million) Forecast, by Application 2020 & 2033
- Table 44: ASEAN Commercial Building Automation Systems Revenue (million) Forecast, by Application 2020 & 2033
- Table 45: Oceania Commercial Building Automation Systems Revenue (million) Forecast, by Application 2020 & 2033
- Table 46: Rest of Asia Pacific Commercial Building Automation Systems Revenue (million) Forecast, by Application 2020 & 2033
Frequently Asked Questions
1. What is the projected Compound Annual Growth Rate (CAGR) of the Commercial Building Automation Systems?
The projected CAGR is approximately 3.4%.
2. Which companies are prominent players in the Commercial Building Automation Systems?
Key companies in the market include Siemens Building Technologies Inc., Schneider Electric, Honeywell International Inc., Johnson Control Inc., United Technologies Corporation, ABB Limited, Azbil Corporation, Eaton Corporation, General Electric, Ingersoll Rand Inc..
3. What are the main segments of the Commercial Building Automation Systems?
The market segments include Application, Type.
4. Can you provide details about the market size?
The market size is estimated to be USD 105540 million as of 2022.
5. What are some drivers contributing to market growth?
N/A
6. What are the notable trends driving market growth?
N/A
7. Are there any restraints impacting market growth?
N/A
8. Can you provide examples of recent developments in the market?
N/A
9. What pricing options are available for accessing the report?
Pricing options include single-user, multi-user, and enterprise licenses priced at USD 3950.00, USD 5925.00, and USD 7900.00 respectively.
10. Is the market size provided in terms of value or volume?
The market size is provided in terms of value, measured in million.
11. Are there any specific market keywords associated with the report?
Yes, the market keyword associated with the report is "Commercial Building Automation Systems," which aids in identifying and referencing the specific market segment covered.
12. How do I determine which pricing option suits my needs best?
The pricing options vary based on user requirements and access needs. Individual users may opt for single-user licenses, while businesses requiring broader access may choose multi-user or enterprise licenses for cost-effective access to the report.
13. Are there any additional resources or data provided in the Commercial Building Automation Systems report?
While the report offers comprehensive insights, it's advisable to review the specific contents or supplementary materials provided to ascertain if additional resources or data are available.
14. How can I stay updated on further developments or reports in the Commercial Building Automation Systems?
To stay informed about further developments, trends, and reports in the Commercial Building Automation Systems, consider subscribing to industry newsletters, following relevant companies and organizations, or regularly checking reputable industry news sources and publications.
Methodology
Step 1 - Identification of Relevant Samples Size from Population Database


Step 2 - Approaches for Defining Global Market Size (Value, Volume* & Price*)

Note*: In applicable scenarios
Step 3 - Data Sources
Primary Research
- Web Analytics
- Survey Reports
- Research Institute
- Latest Research Reports
- Opinion Leaders
Secondary Research
- Annual Reports
- White Paper
- Latest Press Release
- Industry Association
- Paid Database
- Investor Presentations

Step 4 - Data Triangulation
Involves using different sources of information in order to increase the validity of a study
These sources are likely to be stakeholders in a program - participants, other researchers, program staff, other community members, and so on.
Then we put all data in single framework & apply various statistical tools to find out the dynamic on the market.
During the analysis stage, feedback from the stakeholder groups would be compared to determine areas of agreement as well as areas of divergence