
Key Insights
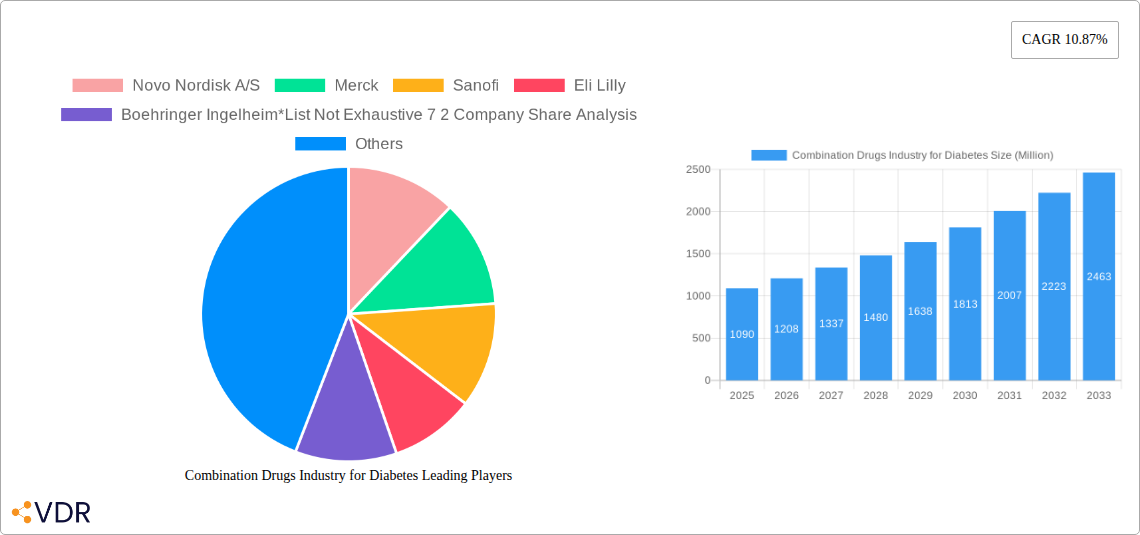
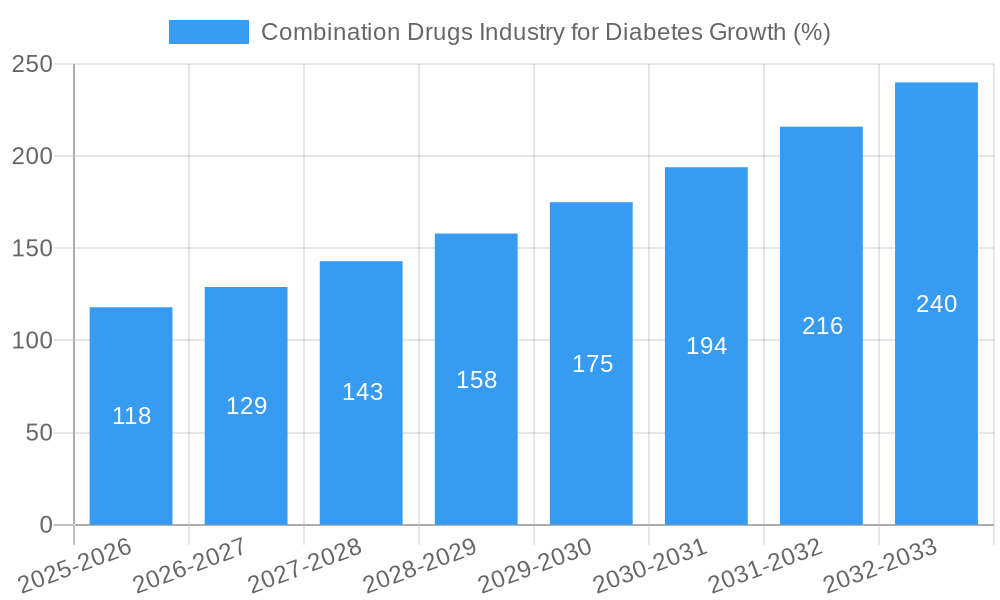
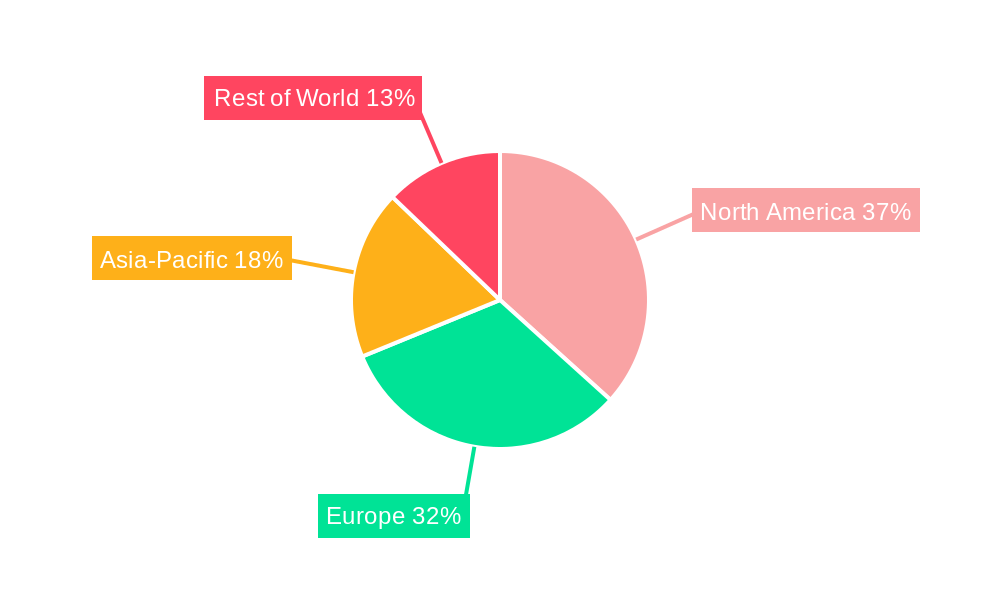
The global market for combination drugs in diabetes treatment is experiencing robust growth, projected to reach $1.09 billion in 2025 and maintain a Compound Annual Growth Rate (CAGR) of 10.87% from 2025 to 2033. This expansion is driven by several key factors. Rising prevalence of type 2 diabetes globally, particularly in developing nations, fuels demand for effective and convenient combination therapies. These therapies often offer improved glycemic control compared to monotherapy, reducing the risk of complications like cardiovascular disease and neuropathy. Furthermore, advancements in drug delivery systems, such as improved oral formulations and injectable pens, enhance patient compliance and contribute to market growth. The competitive landscape is characterized by established pharmaceutical giants like Novo Nordisk A/S, Merck, Sanofi, Eli Lilly, and Boehringer Ingelheim, each vying for market share through innovative product development and strategic partnerships. The market is segmented based on drug class, route of administration, and geographic region. While precise regional data is unavailable, we can infer a significant market presence in North America and Europe, given the higher prevalence of diabetes and greater healthcare spending in these regions.
The continued growth trajectory hinges on several factors. Further research into novel drug combinations targeting specific patient subpopulations will likely drive innovation. Regulatory approvals for new combination therapies will significantly influence market dynamics. Additionally, pricing strategies and healthcare reimbursement policies will play a crucial role in accessibility and overall market size. Challenges remain, however, including potential side effects associated with combination therapies and the need for improved patient education to ensure proper medication adherence. Addressing these challenges, along with continued research and development, will be essential for sustaining the impressive growth of the combination diabetes drug market.
Combination Drugs Industry for Diabetes: A Comprehensive Market Report (2019-2033)
This comprehensive report provides an in-depth analysis of the Combination Drugs Industry for Diabetes, covering market dynamics, growth trends, key players, and future outlook. The report utilizes data from the historical period (2019-2024), base year (2025), and estimated year (2025) to forecast market trends through 2033. This analysis encompasses both the parent market (Diabetes Treatment) and the child market (Combination Diabetes Drugs), offering a granular understanding of this vital sector. The report is crucial for pharmaceutical companies, investors, and market researchers seeking insights into this rapidly evolving landscape. Market values are presented in million units.
Combination Drugs Industry for Diabetes Market Dynamics & Structure
The Combination Drugs Industry for Diabetes is characterized by a moderately concentrated market structure, with key players like Novo Nordisk A/S, Merck, Sanofi, Eli Lilly, and Boehringer Ingelheim holding significant market share. However, the presence of numerous smaller players and continuous innovation fosters a dynamic competitive environment. Technological advancements, particularly in drug delivery systems and personalized medicine, are major drivers. Stringent regulatory frameworks, including those governing drug approvals and pricing, significantly impact market dynamics. The rise of biosimilars and generic competition presents both opportunities and challenges. Patient demographics, particularly the aging global population and rising prevalence of Type 2 diabetes, are key factors influencing market growth. M&A activity remains significant, with xx deals valued at approximately xx million units recorded in the past five years, reflecting the industry's consolidation trends and pursuit of innovative therapies.
- Market Concentration: Moderately concentrated, with top 5 players holding approximately xx% market share (2024).
- Technological Innovation: Focus on improved efficacy, reduced side effects, and convenient delivery systems.
- Regulatory Landscape: Stringent approvals processes and pricing regulations vary across geographies.
- Competitive Substitutes: Monotherapy treatments and alternative therapies pose competitive pressure.
- End-User Demographics: Aging population and increasing prevalence of diabetes are key growth drivers.
- M&A Activity: xx deals (2019-2024) reflecting industry consolidation and pursuit of innovation.
Combination Drugs Industry for Diabetes Growth Trends & Insights
The Combination Drugs Industry for Diabetes experienced robust growth during the historical period (2019-2024), with a CAGR of xx%. This growth is attributed to several factors, including the rising prevalence of diabetes, increasing awareness of the benefits of combination therapies, and the introduction of innovative drugs with improved efficacy and safety profiles. Market penetration for combination therapies has also steadily increased, reaching approximately xx% in 2024. Technological advancements, such as the development of long-acting insulin analogs and GLP-1 receptor agonists, have significantly impacted market growth and spurred increased adoption rates. Shifting consumer preferences towards convenient, once-daily regimens are also shaping market demand. The forecast period (2025-2033) projects continued growth, driven by factors such as increasing healthcare expenditure, expanding access to healthcare in emerging markets, and further technological advancements. We anticipate a CAGR of xx% during this period, leading to a market size of xx million units by 2033.
Dominant Regions, Countries, or Segments in Combination Drugs Industry for Diabetes
North America currently holds the largest market share in the Combination Drugs Industry for Diabetes, driven by high diabetes prevalence, robust healthcare infrastructure, and high per capita healthcare spending. Europe also represents a significant market, with strong regulatory frameworks and a large patient population. However, the fastest-growing regions are in Asia-Pacific, particularly India and China, fueled by rapidly increasing diabetes prevalence and expanding access to healthcare.
- North America: High prevalence, advanced healthcare infrastructure, strong R&D investment.
- Europe: Mature market with strong regulatory frameworks and established healthcare systems.
- Asia-Pacific: Fastest-growing region due to rising diabetes prevalence and expanding healthcare access.
- Other Regions: Growth varies based on specific regional factors, including economic development and healthcare infrastructure.
Combination Drugs Industry for Diabetes Product Landscape
The Combination Drugs Industry for Diabetes offers a diverse range of products, including combinations of insulin with metformin, sulfonylureas, or DPP-4 inhibitors. Recent innovations focus on fixed-dose combinations, offering enhanced convenience and improved adherence. Products are differentiated based on efficacy, safety profiles, and dosage forms. Technological advancements such as the development of novel drug delivery systems like inhalable insulin or long-acting injectables are enhancing product performance and patient experience. These advancements address patient challenges related to injection frequency and adherence.
Key Drivers, Barriers & Challenges in Combination Drugs Industry for Diabetes
Key Drivers: Rising prevalence of diabetes, increasing awareness of combination therapy benefits, technological advancements (long-acting insulin analogs, GLP-1 receptor agonists), and favorable regulatory landscape in some regions.
Challenges: High drug prices, stringent regulatory hurdles, generic competition intensifying, supply chain disruptions impacting availability, and potential side effects associated with combination therapies (requiring careful patient monitoring). These factors could collectively reduce market growth by an estimated xx% by 2030 if not effectively addressed.
Emerging Opportunities in Combination Drugs Industry for Diabetes
Untapped markets in developing countries, particularly in Africa and South America, present significant growth opportunities. Furthermore, there is potential for expanding applications of existing drugs and developing new combination therapies targeting specific patient subgroups. The focus on personalized medicine and the development of combination therapies tailored to individual patient needs also presents an attractive area for future growth.
Growth Accelerators in the Combination Drugs Industry for Diabetes Industry
Technological breakthroughs, such as the development of next-generation insulin analogs and improved drug delivery systems, are key growth accelerators. Strategic partnerships and collaborations between pharmaceutical companies will drive innovation and expand market access. Expansion into emerging markets and increased investment in research and development for new combination therapies will further fuel market growth.
Key Players Shaping the Combination Drugs Industry for Diabetes Market
- Novo Nordisk A/S
- Merck
- Sanofi
- Eli Lilly
- Boehringer Ingelheim
- List Not Exhaustive
Company Share Analysis (2024): Novo Nordisk A/S (xx%), Merck (xx%), Sanofi (xx%), Other (xx%)
Notable Milestones in Combination Drugs Industry for Diabetes Sector
- July 2022: Glenmark Pharmaceuticals Limited launched sitagliptin and its fixed-dose combinations for Type 2 diabetes in India under the brand name SITAZIT, significantly impacting affordability and access.
- July 2022: The European Commission granted marketing authorization for Sitagliptin/Metformin hydrochloride Accord, expanding treatment options within the EU.
In-Depth Combination Drugs Industry for Diabetes Market Outlook
The Combination Drugs Industry for Diabetes is poised for continued growth, driven by factors such as the increasing prevalence of diabetes, technological advancements, and expanding market access. Strategic opportunities exist in developing novel combination therapies, expanding into untapped markets, and leveraging personalized medicine approaches. The market is expected to reach xx million units by 2033, representing a significant opportunity for industry players.
Combination Drugs Industry for Diabetes Segmentation
-
1. Oral Combination
- 1.1. Janumet (Sitagliptin and Metformin HCl)
-
2. Insulin Combination
- 2.1. NovoMix (Biphasic Insulin Aspart)
- 2.2. Ryzodeg (Insulin Degludec and Insulin Aspart)
- 2.3. Xultophy (Insulin Degludec and Liraglutide)
Combination Drugs Industry for Diabetes Segmentation By Geography
-
1. North America
- 1.1. United States
- 1.2. Canada
- 1.3. Rest of North America
-
2. Europe
- 2.1. France
- 2.2. Germany
- 2.3. Italy
- 2.4. Spain
- 2.5. United Kingdom
- 2.6. Russia
- 2.7. Rest of Europe
-
3. Latin America
- 3.1. Mexico
- 3.2. Brazil
- 3.3. Rest of Latin America
-
4. Asia Pacific
- 4.1. Australia
- 4.2. China
- 4.3. India
- 4.4. Indonesia
- 4.5. Japan
- 4.6. Malaysia
- 4.7. Philippines
- 4.8. South Korea
- 4.9. Thailand
- 4.10. Vietnam
- 4.11. Rest of Asia Pacific
-
5. Middle East and Africa
- 5.1. Saudi Arabia
- 5.2. Iran
- 5.3. Egypt
- 5.4. Oman
- 5.5. South Africa
- 5.6. Rest of Middle East and Africa
Combination Drugs Industry for Diabetes REPORT HIGHLIGHTS
| Aspects | Details |
|---|---|
| Study Period | 2019-2033 |
| Base Year | 2024 |
| Estimated Year | 2025 |
| Forecast Period | 2025-2033 |
| Historical Period | 2019-2024 |
| Growth Rate | CAGR of 10.87% from 2019-2033 |
| Segmentation |
|
Table of Contents
- 1. Introduction
- 1.1. Research Scope
- 1.2. Market Segmentation
- 1.3. Research Methodology
- 1.4. Definitions and Assumptions
- 2. Executive Summary
- 2.1. Introduction
- 3. Market Dynamics
- 3.1. Introduction
- 3.2. Market Drivers
- 3.3. Market Restrains
- 3.4. Market Trends
- 3.4.1. Janumet holds the highest market share in the Combination Anti-Diabetes Drugs Market in the current year
- 4. Market Factor Analysis
- 4.1. Porters Five Forces
- 4.2. Supply/Value Chain
- 4.3. PESTEL analysis
- 4.4. Market Entropy
- 4.5. Patent/Trademark Analysis
- 5. Global Combination Drugs Industry for Diabetes Analysis, Insights and Forecast, 2019-2031
- 5.1. Market Analysis, Insights and Forecast - by Oral Combination
- 5.1.1. Janumet (Sitagliptin and Metformin HCl)
- 5.2. Market Analysis, Insights and Forecast - by Insulin Combination
- 5.2.1. NovoMix (Biphasic Insulin Aspart)
- 5.2.2. Ryzodeg (Insulin Degludec and Insulin Aspart)
- 5.2.3. Xultophy (Insulin Degludec and Liraglutide)
- 5.3. Market Analysis, Insights and Forecast - by Region
- 5.3.1. North America
- 5.3.2. Europe
- 5.3.3. Latin America
- 5.3.4. Asia Pacific
- 5.3.5. Middle East and Africa
- 5.1. Market Analysis, Insights and Forecast - by Oral Combination
- 6. North America Combination Drugs Industry for Diabetes Analysis, Insights and Forecast, 2019-2031
- 6.1. Market Analysis, Insights and Forecast - by Oral Combination
- 6.1.1. Janumet (Sitagliptin and Metformin HCl)
- 6.2. Market Analysis, Insights and Forecast - by Insulin Combination
- 6.2.1. NovoMix (Biphasic Insulin Aspart)
- 6.2.2. Ryzodeg (Insulin Degludec and Insulin Aspart)
- 6.2.3. Xultophy (Insulin Degludec and Liraglutide)
- 6.1. Market Analysis, Insights and Forecast - by Oral Combination
- 7. Europe Combination Drugs Industry for Diabetes Analysis, Insights and Forecast, 2019-2031
- 7.1. Market Analysis, Insights and Forecast - by Oral Combination
- 7.1.1. Janumet (Sitagliptin and Metformin HCl)
- 7.2. Market Analysis, Insights and Forecast - by Insulin Combination
- 7.2.1. NovoMix (Biphasic Insulin Aspart)
- 7.2.2. Ryzodeg (Insulin Degludec and Insulin Aspart)
- 7.2.3. Xultophy (Insulin Degludec and Liraglutide)
- 7.1. Market Analysis, Insights and Forecast - by Oral Combination
- 8. Latin America Combination Drugs Industry for Diabetes Analysis, Insights and Forecast, 2019-2031
- 8.1. Market Analysis, Insights and Forecast - by Oral Combination
- 8.1.1. Janumet (Sitagliptin and Metformin HCl)
- 8.2. Market Analysis, Insights and Forecast - by Insulin Combination
- 8.2.1. NovoMix (Biphasic Insulin Aspart)
- 8.2.2. Ryzodeg (Insulin Degludec and Insulin Aspart)
- 8.2.3. Xultophy (Insulin Degludec and Liraglutide)
- 8.1. Market Analysis, Insights and Forecast - by Oral Combination
- 9. Asia Pacific Combination Drugs Industry for Diabetes Analysis, Insights and Forecast, 2019-2031
- 9.1. Market Analysis, Insights and Forecast - by Oral Combination
- 9.1.1. Janumet (Sitagliptin and Metformin HCl)
- 9.2. Market Analysis, Insights and Forecast - by Insulin Combination
- 9.2.1. NovoMix (Biphasic Insulin Aspart)
- 9.2.2. Ryzodeg (Insulin Degludec and Insulin Aspart)
- 9.2.3. Xultophy (Insulin Degludec and Liraglutide)
- 9.1. Market Analysis, Insights and Forecast - by Oral Combination
- 10. Middle East and Africa Combination Drugs Industry for Diabetes Analysis, Insights and Forecast, 2019-2031
- 10.1. Market Analysis, Insights and Forecast - by Oral Combination
- 10.1.1. Janumet (Sitagliptin and Metformin HCl)
- 10.2. Market Analysis, Insights and Forecast - by Insulin Combination
- 10.2.1. NovoMix (Biphasic Insulin Aspart)
- 10.2.2. Ryzodeg (Insulin Degludec and Insulin Aspart)
- 10.2.3. Xultophy (Insulin Degludec and Liraglutide)
- 10.1. Market Analysis, Insights and Forecast - by Oral Combination
- 11. Competitive Analysis
- 11.1. Global Market Share Analysis 2024
- 11.2. Company Profiles
- 11.2.1 Novo Nordisk A/S
- 11.2.1.1. Overview
- 11.2.1.2. Products
- 11.2.1.3. SWOT Analysis
- 11.2.1.4. Recent Developments
- 11.2.1.5. Financials (Based on Availability)
- 11.2.2 Merck
- 11.2.2.1. Overview
- 11.2.2.2. Products
- 11.2.2.3. SWOT Analysis
- 11.2.2.4. Recent Developments
- 11.2.2.5. Financials (Based on Availability)
- 11.2.3 Sanofi
- 11.2.3.1. Overview
- 11.2.3.2. Products
- 11.2.3.3. SWOT Analysis
- 11.2.3.4. Recent Developments
- 11.2.3.5. Financials (Based on Availability)
- 11.2.4 Eli Lilly
- 11.2.4.1. Overview
- 11.2.4.2. Products
- 11.2.4.3. SWOT Analysis
- 11.2.4.4. Recent Developments
- 11.2.4.5. Financials (Based on Availability)
- 11.2.5 Boehringer Ingelheim*List Not Exhaustive 7 2 Company Share Analysis
- 11.2.5.1. Overview
- 11.2.5.2. Products
- 11.2.5.3. SWOT Analysis
- 11.2.5.4. Recent Developments
- 11.2.5.5. Financials (Based on Availability)
- 11.2.6 Novo Nordisk A/S
- 11.2.6.1. Overview
- 11.2.6.2. Products
- 11.2.6.3. SWOT Analysis
- 11.2.6.4. Recent Developments
- 11.2.6.5. Financials (Based on Availability)
- 11.2.7 Merck
- 11.2.7.1. Overview
- 11.2.7.2. Products
- 11.2.7.3. SWOT Analysis
- 11.2.7.4. Recent Developments
- 11.2.7.5. Financials (Based on Availability)
- 11.2.8 Sanofi
- 11.2.8.1. Overview
- 11.2.8.2. Products
- 11.2.8.3. SWOT Analysis
- 11.2.8.4. Recent Developments
- 11.2.8.5. Financials (Based on Availability)
- 11.2.9 Other
- 11.2.9.1. Overview
- 11.2.9.2. Products
- 11.2.9.3. SWOT Analysis
- 11.2.9.4. Recent Developments
- 11.2.9.5. Financials (Based on Availability)
- 11.2.1 Novo Nordisk A/S
List of Figures
- Figure 1: Global Combination Drugs Industry for Diabetes Revenue Breakdown (Million, %) by Region 2024 & 2032
- Figure 2: Global Combination Drugs Industry for Diabetes Volume Breakdown (Billion, %) by Region 2024 & 2032
- Figure 3: North America Combination Drugs Industry for Diabetes Revenue (Million), by Oral Combination 2024 & 2032
- Figure 4: North America Combination Drugs Industry for Diabetes Volume (Billion), by Oral Combination 2024 & 2032
- Figure 5: North America Combination Drugs Industry for Diabetes Revenue Share (%), by Oral Combination 2024 & 2032
- Figure 6: North America Combination Drugs Industry for Diabetes Volume Share (%), by Oral Combination 2024 & 2032
- Figure 7: North America Combination Drugs Industry for Diabetes Revenue (Million), by Insulin Combination 2024 & 2032
- Figure 8: North America Combination Drugs Industry for Diabetes Volume (Billion), by Insulin Combination 2024 & 2032
- Figure 9: North America Combination Drugs Industry for Diabetes Revenue Share (%), by Insulin Combination 2024 & 2032
- Figure 10: North America Combination Drugs Industry for Diabetes Volume Share (%), by Insulin Combination 2024 & 2032
- Figure 11: North America Combination Drugs Industry for Diabetes Revenue (Million), by Country 2024 & 2032
- Figure 12: North America Combination Drugs Industry for Diabetes Volume (Billion), by Country 2024 & 2032
- Figure 13: North America Combination Drugs Industry for Diabetes Revenue Share (%), by Country 2024 & 2032
- Figure 14: North America Combination Drugs Industry for Diabetes Volume Share (%), by Country 2024 & 2032
- Figure 15: Europe Combination Drugs Industry for Diabetes Revenue (Million), by Oral Combination 2024 & 2032
- Figure 16: Europe Combination Drugs Industry for Diabetes Volume (Billion), by Oral Combination 2024 & 2032
- Figure 17: Europe Combination Drugs Industry for Diabetes Revenue Share (%), by Oral Combination 2024 & 2032
- Figure 18: Europe Combination Drugs Industry for Diabetes Volume Share (%), by Oral Combination 2024 & 2032
- Figure 19: Europe Combination Drugs Industry for Diabetes Revenue (Million), by Insulin Combination 2024 & 2032
- Figure 20: Europe Combination Drugs Industry for Diabetes Volume (Billion), by Insulin Combination 2024 & 2032
- Figure 21: Europe Combination Drugs Industry for Diabetes Revenue Share (%), by Insulin Combination 2024 & 2032
- Figure 22: Europe Combination Drugs Industry for Diabetes Volume Share (%), by Insulin Combination 2024 & 2032
- Figure 23: Europe Combination Drugs Industry for Diabetes Revenue (Million), by Country 2024 & 2032
- Figure 24: Europe Combination Drugs Industry for Diabetes Volume (Billion), by Country 2024 & 2032
- Figure 25: Europe Combination Drugs Industry for Diabetes Revenue Share (%), by Country 2024 & 2032
- Figure 26: Europe Combination Drugs Industry for Diabetes Volume Share (%), by Country 2024 & 2032
- Figure 27: Latin America Combination Drugs Industry for Diabetes Revenue (Million), by Oral Combination 2024 & 2032
- Figure 28: Latin America Combination Drugs Industry for Diabetes Volume (Billion), by Oral Combination 2024 & 2032
- Figure 29: Latin America Combination Drugs Industry for Diabetes Revenue Share (%), by Oral Combination 2024 & 2032
- Figure 30: Latin America Combination Drugs Industry for Diabetes Volume Share (%), by Oral Combination 2024 & 2032
- Figure 31: Latin America Combination Drugs Industry for Diabetes Revenue (Million), by Insulin Combination 2024 & 2032
- Figure 32: Latin America Combination Drugs Industry for Diabetes Volume (Billion), by Insulin Combination 2024 & 2032
- Figure 33: Latin America Combination Drugs Industry for Diabetes Revenue Share (%), by Insulin Combination 2024 & 2032
- Figure 34: Latin America Combination Drugs Industry for Diabetes Volume Share (%), by Insulin Combination 2024 & 2032
- Figure 35: Latin America Combination Drugs Industry for Diabetes Revenue (Million), by Country 2024 & 2032
- Figure 36: Latin America Combination Drugs Industry for Diabetes Volume (Billion), by Country 2024 & 2032
- Figure 37: Latin America Combination Drugs Industry for Diabetes Revenue Share (%), by Country 2024 & 2032
- Figure 38: Latin America Combination Drugs Industry for Diabetes Volume Share (%), by Country 2024 & 2032
- Figure 39: Asia Pacific Combination Drugs Industry for Diabetes Revenue (Million), by Oral Combination 2024 & 2032
- Figure 40: Asia Pacific Combination Drugs Industry for Diabetes Volume (Billion), by Oral Combination 2024 & 2032
- Figure 41: Asia Pacific Combination Drugs Industry for Diabetes Revenue Share (%), by Oral Combination 2024 & 2032
- Figure 42: Asia Pacific Combination Drugs Industry for Diabetes Volume Share (%), by Oral Combination 2024 & 2032
- Figure 43: Asia Pacific Combination Drugs Industry for Diabetes Revenue (Million), by Insulin Combination 2024 & 2032
- Figure 44: Asia Pacific Combination Drugs Industry for Diabetes Volume (Billion), by Insulin Combination 2024 & 2032
- Figure 45: Asia Pacific Combination Drugs Industry for Diabetes Revenue Share (%), by Insulin Combination 2024 & 2032
- Figure 46: Asia Pacific Combination Drugs Industry for Diabetes Volume Share (%), by Insulin Combination 2024 & 2032
- Figure 47: Asia Pacific Combination Drugs Industry for Diabetes Revenue (Million), by Country 2024 & 2032
- Figure 48: Asia Pacific Combination Drugs Industry for Diabetes Volume (Billion), by Country 2024 & 2032
- Figure 49: Asia Pacific Combination Drugs Industry for Diabetes Revenue Share (%), by Country 2024 & 2032
- Figure 50: Asia Pacific Combination Drugs Industry for Diabetes Volume Share (%), by Country 2024 & 2032
- Figure 51: Middle East and Africa Combination Drugs Industry for Diabetes Revenue (Million), by Oral Combination 2024 & 2032
- Figure 52: Middle East and Africa Combination Drugs Industry for Diabetes Volume (Billion), by Oral Combination 2024 & 2032
- Figure 53: Middle East and Africa Combination Drugs Industry for Diabetes Revenue Share (%), by Oral Combination 2024 & 2032
- Figure 54: Middle East and Africa Combination Drugs Industry for Diabetes Volume Share (%), by Oral Combination 2024 & 2032
- Figure 55: Middle East and Africa Combination Drugs Industry for Diabetes Revenue (Million), by Insulin Combination 2024 & 2032
- Figure 56: Middle East and Africa Combination Drugs Industry for Diabetes Volume (Billion), by Insulin Combination 2024 & 2032
- Figure 57: Middle East and Africa Combination Drugs Industry for Diabetes Revenue Share (%), by Insulin Combination 2024 & 2032
- Figure 58: Middle East and Africa Combination Drugs Industry for Diabetes Volume Share (%), by Insulin Combination 2024 & 2032
- Figure 59: Middle East and Africa Combination Drugs Industry for Diabetes Revenue (Million), by Country 2024 & 2032
- Figure 60: Middle East and Africa Combination Drugs Industry for Diabetes Volume (Billion), by Country 2024 & 2032
- Figure 61: Middle East and Africa Combination Drugs Industry for Diabetes Revenue Share (%), by Country 2024 & 2032
- Figure 62: Middle East and Africa Combination Drugs Industry for Diabetes Volume Share (%), by Country 2024 & 2032
List of Tables
- Table 1: Global Combination Drugs Industry for Diabetes Revenue Million Forecast, by Region 2019 & 2032
- Table 2: Global Combination Drugs Industry for Diabetes Volume Billion Forecast, by Region 2019 & 2032
- Table 3: Global Combination Drugs Industry for Diabetes Revenue Million Forecast, by Oral Combination 2019 & 2032
- Table 4: Global Combination Drugs Industry for Diabetes Volume Billion Forecast, by Oral Combination 2019 & 2032
- Table 5: Global Combination Drugs Industry for Diabetes Revenue Million Forecast, by Insulin Combination 2019 & 2032
- Table 6: Global Combination Drugs Industry for Diabetes Volume Billion Forecast, by Insulin Combination 2019 & 2032
- Table 7: Global Combination Drugs Industry for Diabetes Revenue Million Forecast, by Region 2019 & 2032
- Table 8: Global Combination Drugs Industry for Diabetes Volume Billion Forecast, by Region 2019 & 2032
- Table 9: Global Combination Drugs Industry for Diabetes Revenue Million Forecast, by Oral Combination 2019 & 2032
- Table 10: Global Combination Drugs Industry for Diabetes Volume Billion Forecast, by Oral Combination 2019 & 2032
- Table 11: Global Combination Drugs Industry for Diabetes Revenue Million Forecast, by Insulin Combination 2019 & 2032
- Table 12: Global Combination Drugs Industry for Diabetes Volume Billion Forecast, by Insulin Combination 2019 & 2032
- Table 13: Global Combination Drugs Industry for Diabetes Revenue Million Forecast, by Country 2019 & 2032
- Table 14: Global Combination Drugs Industry for Diabetes Volume Billion Forecast, by Country 2019 & 2032
- Table 15: United States Combination Drugs Industry for Diabetes Revenue (Million) Forecast, by Application 2019 & 2032
- Table 16: United States Combination Drugs Industry for Diabetes Volume (Billion) Forecast, by Application 2019 & 2032
- Table 17: Canada Combination Drugs Industry for Diabetes Revenue (Million) Forecast, by Application 2019 & 2032
- Table 18: Canada Combination Drugs Industry for Diabetes Volume (Billion) Forecast, by Application 2019 & 2032
- Table 19: Rest of North America Combination Drugs Industry for Diabetes Revenue (Million) Forecast, by Application 2019 & 2032
- Table 20: Rest of North America Combination Drugs Industry for Diabetes Volume (Billion) Forecast, by Application 2019 & 2032
- Table 21: Global Combination Drugs Industry for Diabetes Revenue Million Forecast, by Oral Combination 2019 & 2032
- Table 22: Global Combination Drugs Industry for Diabetes Volume Billion Forecast, by Oral Combination 2019 & 2032
- Table 23: Global Combination Drugs Industry for Diabetes Revenue Million Forecast, by Insulin Combination 2019 & 2032
- Table 24: Global Combination Drugs Industry for Diabetes Volume Billion Forecast, by Insulin Combination 2019 & 2032
- Table 25: Global Combination Drugs Industry for Diabetes Revenue Million Forecast, by Country 2019 & 2032
- Table 26: Global Combination Drugs Industry for Diabetes Volume Billion Forecast, by Country 2019 & 2032
- Table 27: France Combination Drugs Industry for Diabetes Revenue (Million) Forecast, by Application 2019 & 2032
- Table 28: France Combination Drugs Industry for Diabetes Volume (Billion) Forecast, by Application 2019 & 2032
- Table 29: Germany Combination Drugs Industry for Diabetes Revenue (Million) Forecast, by Application 2019 & 2032
- Table 30: Germany Combination Drugs Industry for Diabetes Volume (Billion) Forecast, by Application 2019 & 2032
- Table 31: Italy Combination Drugs Industry for Diabetes Revenue (Million) Forecast, by Application 2019 & 2032
- Table 32: Italy Combination Drugs Industry for Diabetes Volume (Billion) Forecast, by Application 2019 & 2032
- Table 33: Spain Combination Drugs Industry for Diabetes Revenue (Million) Forecast, by Application 2019 & 2032
- Table 34: Spain Combination Drugs Industry for Diabetes Volume (Billion) Forecast, by Application 2019 & 2032
- Table 35: United Kingdom Combination Drugs Industry for Diabetes Revenue (Million) Forecast, by Application 2019 & 2032
- Table 36: United Kingdom Combination Drugs Industry for Diabetes Volume (Billion) Forecast, by Application 2019 & 2032
- Table 37: Russia Combination Drugs Industry for Diabetes Revenue (Million) Forecast, by Application 2019 & 2032
- Table 38: Russia Combination Drugs Industry for Diabetes Volume (Billion) Forecast, by Application 2019 & 2032
- Table 39: Rest of Europe Combination Drugs Industry for Diabetes Revenue (Million) Forecast, by Application 2019 & 2032
- Table 40: Rest of Europe Combination Drugs Industry for Diabetes Volume (Billion) Forecast, by Application 2019 & 2032
- Table 41: Global Combination Drugs Industry for Diabetes Revenue Million Forecast, by Oral Combination 2019 & 2032
- Table 42: Global Combination Drugs Industry for Diabetes Volume Billion Forecast, by Oral Combination 2019 & 2032
- Table 43: Global Combination Drugs Industry for Diabetes Revenue Million Forecast, by Insulin Combination 2019 & 2032
- Table 44: Global Combination Drugs Industry for Diabetes Volume Billion Forecast, by Insulin Combination 2019 & 2032
- Table 45: Global Combination Drugs Industry for Diabetes Revenue Million Forecast, by Country 2019 & 2032
- Table 46: Global Combination Drugs Industry for Diabetes Volume Billion Forecast, by Country 2019 & 2032
- Table 47: Mexico Combination Drugs Industry for Diabetes Revenue (Million) Forecast, by Application 2019 & 2032
- Table 48: Mexico Combination Drugs Industry for Diabetes Volume (Billion) Forecast, by Application 2019 & 2032
- Table 49: Brazil Combination Drugs Industry for Diabetes Revenue (Million) Forecast, by Application 2019 & 2032
- Table 50: Brazil Combination Drugs Industry for Diabetes Volume (Billion) Forecast, by Application 2019 & 2032
- Table 51: Rest of Latin America Combination Drugs Industry for Diabetes Revenue (Million) Forecast, by Application 2019 & 2032
- Table 52: Rest of Latin America Combination Drugs Industry for Diabetes Volume (Billion) Forecast, by Application 2019 & 2032
- Table 53: Global Combination Drugs Industry for Diabetes Revenue Million Forecast, by Oral Combination 2019 & 2032
- Table 54: Global Combination Drugs Industry for Diabetes Volume Billion Forecast, by Oral Combination 2019 & 2032
- Table 55: Global Combination Drugs Industry for Diabetes Revenue Million Forecast, by Insulin Combination 2019 & 2032
- Table 56: Global Combination Drugs Industry for Diabetes Volume Billion Forecast, by Insulin Combination 2019 & 2032
- Table 57: Global Combination Drugs Industry for Diabetes Revenue Million Forecast, by Country 2019 & 2032
- Table 58: Global Combination Drugs Industry for Diabetes Volume Billion Forecast, by Country 2019 & 2032
- Table 59: Australia Combination Drugs Industry for Diabetes Revenue (Million) Forecast, by Application 2019 & 2032
- Table 60: Australia Combination Drugs Industry for Diabetes Volume (Billion) Forecast, by Application 2019 & 2032
- Table 61: China Combination Drugs Industry for Diabetes Revenue (Million) Forecast, by Application 2019 & 2032
- Table 62: China Combination Drugs Industry for Diabetes Volume (Billion) Forecast, by Application 2019 & 2032
- Table 63: India Combination Drugs Industry for Diabetes Revenue (Million) Forecast, by Application 2019 & 2032
- Table 64: India Combination Drugs Industry for Diabetes Volume (Billion) Forecast, by Application 2019 & 2032
- Table 65: Indonesia Combination Drugs Industry for Diabetes Revenue (Million) Forecast, by Application 2019 & 2032
- Table 66: Indonesia Combination Drugs Industry for Diabetes Volume (Billion) Forecast, by Application 2019 & 2032
- Table 67: Japan Combination Drugs Industry for Diabetes Revenue (Million) Forecast, by Application 2019 & 2032
- Table 68: Japan Combination Drugs Industry for Diabetes Volume (Billion) Forecast, by Application 2019 & 2032
- Table 69: Malaysia Combination Drugs Industry for Diabetes Revenue (Million) Forecast, by Application 2019 & 2032
- Table 70: Malaysia Combination Drugs Industry for Diabetes Volume (Billion) Forecast, by Application 2019 & 2032
- Table 71: Philippines Combination Drugs Industry for Diabetes Revenue (Million) Forecast, by Application 2019 & 2032
- Table 72: Philippines Combination Drugs Industry for Diabetes Volume (Billion) Forecast, by Application 2019 & 2032
- Table 73: South Korea Combination Drugs Industry for Diabetes Revenue (Million) Forecast, by Application 2019 & 2032
- Table 74: South Korea Combination Drugs Industry for Diabetes Volume (Billion) Forecast, by Application 2019 & 2032
- Table 75: Thailand Combination Drugs Industry for Diabetes Revenue (Million) Forecast, by Application 2019 & 2032
- Table 76: Thailand Combination Drugs Industry for Diabetes Volume (Billion) Forecast, by Application 2019 & 2032
- Table 77: Vietnam Combination Drugs Industry for Diabetes Revenue (Million) Forecast, by Application 2019 & 2032
- Table 78: Vietnam Combination Drugs Industry for Diabetes Volume (Billion) Forecast, by Application 2019 & 2032
- Table 79: Rest of Asia Pacific Combination Drugs Industry for Diabetes Revenue (Million) Forecast, by Application 2019 & 2032
- Table 80: Rest of Asia Pacific Combination Drugs Industry for Diabetes Volume (Billion) Forecast, by Application 2019 & 2032
- Table 81: Global Combination Drugs Industry for Diabetes Revenue Million Forecast, by Oral Combination 2019 & 2032
- Table 82: Global Combination Drugs Industry for Diabetes Volume Billion Forecast, by Oral Combination 2019 & 2032
- Table 83: Global Combination Drugs Industry for Diabetes Revenue Million Forecast, by Insulin Combination 2019 & 2032
- Table 84: Global Combination Drugs Industry for Diabetes Volume Billion Forecast, by Insulin Combination 2019 & 2032
- Table 85: Global Combination Drugs Industry for Diabetes Revenue Million Forecast, by Country 2019 & 2032
- Table 86: Global Combination Drugs Industry for Diabetes Volume Billion Forecast, by Country 2019 & 2032
- Table 87: Saudi Arabia Combination Drugs Industry for Diabetes Revenue (Million) Forecast, by Application 2019 & 2032
- Table 88: Saudi Arabia Combination Drugs Industry for Diabetes Volume (Billion) Forecast, by Application 2019 & 2032
- Table 89: Iran Combination Drugs Industry for Diabetes Revenue (Million) Forecast, by Application 2019 & 2032
- Table 90: Iran Combination Drugs Industry for Diabetes Volume (Billion) Forecast, by Application 2019 & 2032
- Table 91: Egypt Combination Drugs Industry for Diabetes Revenue (Million) Forecast, by Application 2019 & 2032
- Table 92: Egypt Combination Drugs Industry for Diabetes Volume (Billion) Forecast, by Application 2019 & 2032
- Table 93: Oman Combination Drugs Industry for Diabetes Revenue (Million) Forecast, by Application 2019 & 2032
- Table 94: Oman Combination Drugs Industry for Diabetes Volume (Billion) Forecast, by Application 2019 & 2032
- Table 95: South Africa Combination Drugs Industry for Diabetes Revenue (Million) Forecast, by Application 2019 & 2032
- Table 96: South Africa Combination Drugs Industry for Diabetes Volume (Billion) Forecast, by Application 2019 & 2032
- Table 97: Rest of Middle East and Africa Combination Drugs Industry for Diabetes Revenue (Million) Forecast, by Application 2019 & 2032
- Table 98: Rest of Middle East and Africa Combination Drugs Industry for Diabetes Volume (Billion) Forecast, by Application 2019 & 2032
Frequently Asked Questions
1. What is the projected Compound Annual Growth Rate (CAGR) of the Combination Drugs Industry for Diabetes?
The projected CAGR is approximately 10.87%.
2. Which companies are prominent players in the Combination Drugs Industry for Diabetes?
Key companies in the market include Novo Nordisk A/S, Merck, Sanofi, Eli Lilly, Boehringer Ingelheim*List Not Exhaustive 7 2 Company Share Analysis, Novo Nordisk A/S, Merck, Sanofi, Other.
3. What are the main segments of the Combination Drugs Industry for Diabetes?
The market segments include Oral Combination, Insulin Combination.
4. Can you provide details about the market size?
The market size is estimated to be USD 1.09 Million as of 2022.
5. What are some drivers contributing to market growth?
N/A
6. What are the notable trends driving market growth?
Janumet holds the highest market share in the Combination Anti-Diabetes Drugs Market in the current year.
7. Are there any restraints impacting market growth?
N/A
8. Can you provide examples of recent developments in the market?
July 2022: Glenmark Pharmaceuticals Limited announced that it had launched sitagliptin and its fixed-dose combinations for adults with Type 2 diabetes in India. Glenmark introduced 8 different combinations of sitagliptin-based drugs under the brand name SITAZIT and its variants at an affordable price.
9. What pricing options are available for accessing the report?
Pricing options include single-user, multi-user, and enterprise licenses priced at USD 4750, USD 5250, and USD 8750 respectively.
10. Is the market size provided in terms of value or volume?
The market size is provided in terms of value, measured in Million and volume, measured in Billion.
11. Are there any specific market keywords associated with the report?
Yes, the market keyword associated with the report is "Combination Drugs Industry for Diabetes," which aids in identifying and referencing the specific market segment covered.
12. How do I determine which pricing option suits my needs best?
The pricing options vary based on user requirements and access needs. Individual users may opt for single-user licenses, while businesses requiring broader access may choose multi-user or enterprise licenses for cost-effective access to the report.
13. Are there any additional resources or data provided in the Combination Drugs Industry for Diabetes report?
While the report offers comprehensive insights, it's advisable to review the specific contents or supplementary materials provided to ascertain if additional resources or data are available.
14. How can I stay updated on further developments or reports in the Combination Drugs Industry for Diabetes?
To stay informed about further developments, trends, and reports in the Combination Drugs Industry for Diabetes, consider subscribing to industry newsletters, following relevant companies and organizations, or regularly checking reputable industry news sources and publications.
Methodology
Step 1 - Identification of Relevant Samples Size from Population Database


Step 2 - Approaches for Defining Global Market Size (Value, Volume* & Price*)

Note*: In applicable scenarios
Step 3 - Data Sources
Primary Research
- Web Analytics
- Survey Reports
- Research Institute
- Latest Research Reports
- Opinion Leaders
Secondary Research
- Annual Reports
- White Paper
- Latest Press Release
- Industry Association
- Paid Database
- Investor Presentations

Step 4 - Data Triangulation
Involves using different sources of information in order to increase the validity of a study
These sources are likely to be stakeholders in a program - participants, other researchers, program staff, other community members, and so on.
Then we put all data in single framework & apply various statistical tools to find out the dynamic on the market.
During the analysis stage, feedback from the stakeholder groups would be compared to determine areas of agreement as well as areas of divergence


