

Key Insights
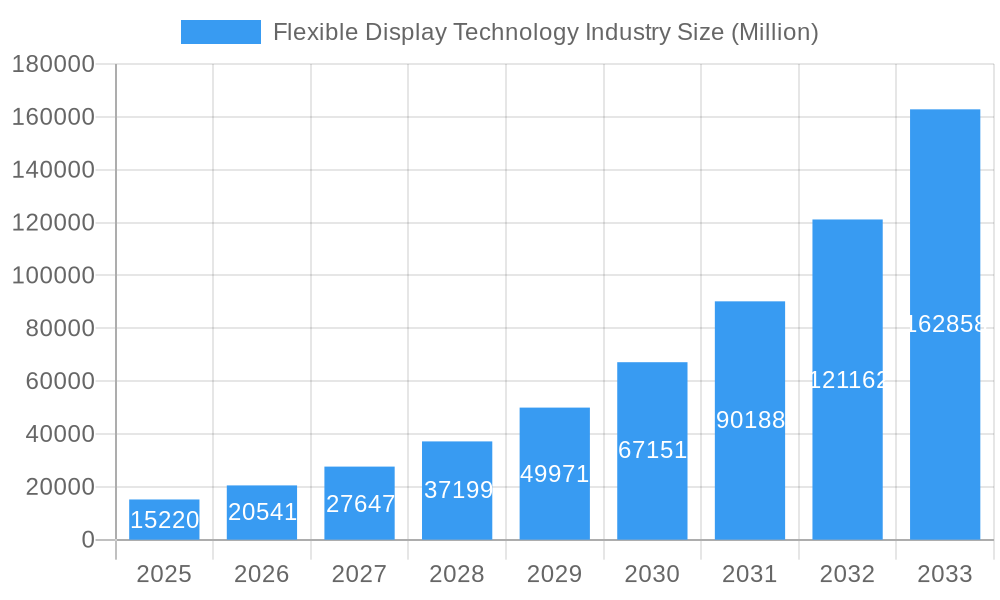
The global Flexible Display Technology market is poised for explosive growth, projected to reach an impressive $15.22 Billion by 2025. This remarkable expansion is fueled by an astonishing Compound Annual Growth Rate (CAGR) of 34.80% over the forecast period of 2025-2033. The proliferation of consumer electronics, particularly smartphones, tablets, and smart wearables, is a primary driver. Consumers are increasingly seeking innovative form factors that offer portability, durability, and enhanced user experiences, all of which flexible displays are uniquely positioned to deliver. Advancements in materials science and manufacturing processes are continuously improving the performance, flexibility, and cost-effectiveness of these displays, making them more accessible for a wider range of applications. Emerging technologies like rollable and foldable screens are capturing consumer imagination, pushing the boundaries of what's possible in device design and functionality. The integration of flexible displays into emerging applications such as augmented reality (AR) and virtual reality (VR) headsets further bolsters market prospects.
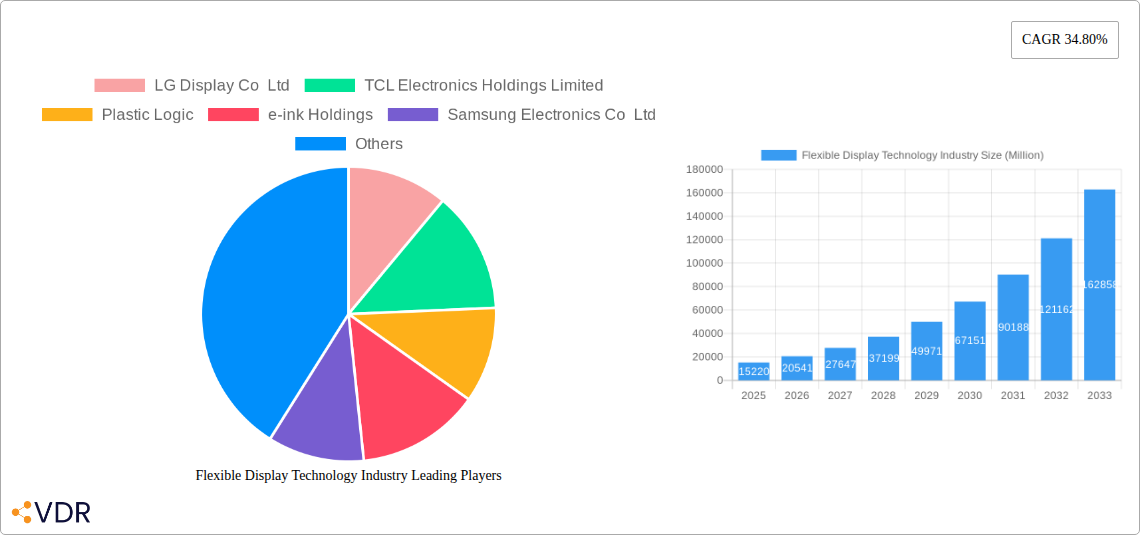
Flexible Display Technology Industry Market Size (In Billion)
The flexible display landscape is characterized by diverse technological advancements and a broad spectrum of applications. OLED technology dominates the market due to its superior contrast ratios, vibrant colors, and inherent flexibility. However, advancements in LCD and EPD technologies are also contributing to market diversification, offering alternatives for specific use cases where power efficiency or cost are paramount. The substrate material is another critical factor, with advancements in plastic and other flexible materials moving away from traditional glass, enabling thinner, lighter, and more robust displays. The market is segmented across smartphones and tablets, smart wearables, televisions, digital signage systems, and personal computers and laptops, with each segment experiencing unique growth trajectories. Key players like LG Display, Samsung Electronics, and BOE Technology Group are at the forefront of innovation, investing heavily in research and development to maintain a competitive edge. While the market enjoys strong tailwinds, challenges such as high manufacturing costs and achieving mass-scale production for certain advanced flexible display types could temper growth in specific niches, although the overall trajectory remains exceptionally positive.
Flexible Display Technology Industry Company Market Share
Flexible Display Technology Industry Market Dynamics & Structure
The flexible display technology industry is characterized by a dynamic and evolving market structure, driven by continuous innovation and increasing demand for advanced electronic devices. Market concentration is moderate, with key players like LG Display Co Ltd, Samsung Electronics Co Ltd, and BOE Technology Group Co Ltd holding significant shares, yet the landscape also accommodates specialized firms such as Plastic Logic and e-ink Holdings. Technological innovation is the primary driver, with advancements in OLED, EPD, and emerging display types constantly pushing the boundaries of what's possible in terms of flexibility and durability. Regulatory frameworks are generally supportive of technological development, although intellectual property protection remains a crucial aspect. Competitive product substitutes, while present in the form of rigid displays, are increasingly being challenged by the superior form factor and user experience offered by flexible alternatives. End-user demographics are diverse, ranging from tech-savvy consumers seeking cutting-edge smartphones and wearables to industrial applications requiring robust and adaptable display solutions. Mergers and acquisitions (M&A) trends indicate a consolidation phase, with larger companies acquiring smaller innovative firms to bolster their technological portfolios and market reach.
- Market Concentration: Moderate to high, with a few dominant players and a growing number of niche innovators.
- Technological Innovation Drivers: OLED advancements, EPD cost reduction, new material development, and manufacturing process optimization.
- Regulatory Frameworks: Primarily focused on standards for display performance, energy efficiency, and material safety.
- Competitive Product Substitutes: Rigid displays, while still prevalent, face increasing pressure from flexible alternatives in specific applications.
- End-User Demographics: Broad, spanning consumer electronics, automotive, medical devices, and industrial automation.
- M&A Trends: Active, with strategic acquisitions aimed at securing intellectual property and expanding product offerings.
Flexible Display Technology Industry Growth Trends & Insights
The flexible display technology industry is poised for substantial growth, driven by a confluence of technological breakthroughs, increasing consumer adoption, and the proliferation of innovative applications. The market size is projected to expand significantly from an estimated $XX million units in 2025 to reach $XX million units by 2033, exhibiting a Compound Annual Growth Rate (CAGR) of XX% during the forecast period. This upward trajectory is fueled by a rapid increase in adoption rates across various sectors, as manufacturers integrate flexible displays into a wider array of consumer electronics and industrial products. Technological disruptions, particularly in the realm of advanced material science and manufacturing techniques, are continuously enhancing the performance, durability, and cost-effectiveness of flexible panels. Consumer behavior is also shifting, with a growing preference for devices that offer enhanced portability, unique form factors, and immersive user experiences, all of which are directly enabled by flexible display technology. The increasing demand for foldable smartphones, rollable televisions, and smart wearable devices with conformal displays are key indicators of this evolving consumer landscape. Furthermore, the development of new applications in areas like augmented reality (AR) and virtual reality (VR) head-mounted displays, as well as flexible lighting and e-paper signage, will further accelerate market penetration. The base year of 2025 serves as a critical reference point, showcasing the nascent but rapidly expanding market, with historical data from 2019-2024 highlighting the foundational growth and initial technological advancements. The estimated year of 2025 reinforces the current market standing and provides a baseline for future projections. The study period of 2019-2033 encapsulates the entire growth arc, from early adoption to market maturity.
Dominant Regions, Countries, or Segments in Flexible Display Technology Industry
The OLED (Organic Light-Emitting Diode) display type segment is emerging as a dominant force within the flexible display technology industry, largely propelled by its superior visual quality, energy efficiency, and inherent flexibility capabilities. The Asia-Pacific region, spearheaded by China, South Korea, and Taiwan, stands out as the leading geographical market, exhibiting significant dominance due to robust manufacturing infrastructure, substantial government investment in R&D, and a concentrated presence of major display manufacturers. Key drivers in this region include strong economic policies supporting technological innovation, extensive supply chain networks for display components, and a vast consumer base eager for advanced electronic devices.
Within the Asia-Pacific, China, through companies like BOE Technology Group Co Ltd and TCL Electronics Holdings Limited, is at the forefront of flexible OLED panel production and innovation, catering to both domestic and international markets. South Korea, represented by LG Display Co Ltd and Samsung Electronics Co Ltd, continues to be a pioneer in high-end flexible OLED technology, particularly for premium smartphones and televisions. Taiwan, with players like AU Optronics Corp and Innolux Corporation, also plays a crucial role in the broader display ecosystem, contributing to the development and manufacturing of various display types that support flexible applications.
The dominance of OLED is further amplified by its widespread adoption in the Smartphones and Tablets application segment. The insatiable demand for foldable smartphones, characterized by their ability to offer larger screen real estate in a compact form factor, has significantly boosted the demand for flexible OLED panels. The development of innovative foldable designs by major smartphone manufacturers has made these devices increasingly mainstream, driving production volumes and technological advancements in flexible display manufacturing.
- Dominant Display Type: OLED, owing to its self-emissive nature, excellent contrast ratios, and inherent flexibility.
- Leading Geographical Region: Asia-Pacific, driven by China, South Korea, and Taiwan.
- Key Drivers in Asia-Pacific:
- Advanced manufacturing capabilities and economies of scale.
- Proactive government support and investment in display technology.
- Presence of leading global display manufacturers.
- High consumer demand for cutting-edge electronic devices.
- Key Drivers in Asia-Pacific:
- Dominant Application Segment: Smartphones and Tablets, especially with the rise of foldable form factors.
- Factors contributing to dominance:
- Consumer desire for portability and larger screen experiences.
- Innovation in device design, enabling new usage paradigms.
- Increasing affordability and market penetration of foldable devices.
- Factors contributing to dominance:
Flexible Display Technology Industry Product Landscape
The flexible display technology industry is defined by a landscape rich in product innovation and diverse applications. Key product advancements revolve around enhancing the flexibility, durability, and visual performance of displays. Foldable OLED panels, such as those integrated into next-generation smartphones and laptops, offer users the ability to transform their devices from compact form factors to larger screens. Rollable displays, exemplified by innovative television designs, showcase the potential for seamless integration into home environments, retracting when not in use. Stretchable displays, a frontier technology, promise revolutionary human-computer interaction by conforming to irregular surfaces. Electronic Paper Displays (EPDs), while offering lower refresh rates, provide exceptional readability in bright light and ultra-low power consumption, making them ideal for e-readers and smart signage. The unique selling propositions of these flexible displays lie in their ability to enable novel device designs, improve user ergonomics, and unlock new application possibilities across various industries. Technological advancements in materials science, particularly in the development of advanced polymers and encapsulation techniques, are crucial for improving the longevity and resilience of these flexible displays.
Key Drivers, Barriers & Challenges in Flexible Display Technology Industry
Key Drivers: The flexible display technology industry is propelled by several key drivers. Technological innovation in materials science and manufacturing processes, particularly for OLED and advanced EPD technologies, is a primary catalyst. The growing consumer demand for novel electronic devices with enhanced portability and unique form factors, such as foldable smartphones and wearable tech, is a significant market pull. Government initiatives and investments in advanced manufacturing and R&D further stimulate growth. Strategic partnerships and collaborations between display manufacturers, device OEMs, and material suppliers accelerate product development and market penetration.
Key Barriers & Challenges: Despite the promising outlook, the industry faces significant barriers and challenges. High manufacturing costs associated with producing large-area flexible displays, especially for advanced OLED panels, can hinder widespread adoption. Ensuring the long-term durability and reliability of flexible displays, particularly against physical stress and environmental factors, remains a technical hurdle. Supply chain complexities and the need for specialized equipment and expertise can lead to production bottlenecks. Intense competition among key players, coupled with the need for significant R&D investment, can also present financial challenges. Furthermore, the development of standardized testing and certification protocols for flexible displays is still evolving.
Emerging Opportunities in Flexible Display Technology Industry
Emerging opportunities in the flexible display technology industry are vast and multifaceted. The burgeoning market for wearable technology, including smartwatches, fitness trackers, and smart clothing, presents significant potential for flexible and conformal displays. The automotive sector is increasingly integrating flexible displays into dashboards, infotainment systems, and even smart windows, offering enhanced user experience and interior design flexibility. In the medical field, flexible displays can be utilized in wearable health monitors, diagnostic devices, and even flexible endoscopes, enabling more patient-friendly and adaptable solutions. The expansion of smart signage and digital out-of-home advertising offers another avenue, with flexible displays allowing for installation in curved or unconventional spaces. Furthermore, advancements in transparent and ultra-thin flexible displays open up possibilities for augmented reality (AR) and virtual reality (VR) applications, as well as integration into architectural elements.
Growth Accelerators in the Flexible Display Technology Industry Industry
The long-term growth of the flexible display technology industry is set to be accelerated by several critical factors. Continued breakthroughs in material science, leading to more robust, cost-effective, and energy-efficient flexible display materials, will be pivotal. Strategic partnerships and vertical integration among key players, from raw material suppliers to end-product manufacturers, will streamline the supply chain and foster innovation. Market expansion into new application verticals, beyond consumer electronics, such as industrial automation, smart textiles, and advanced aerospace, will unlock significant demand. The ongoing miniaturization and improvement in power efficiency of flexible display components will also drive adoption in battery-powered and portable devices. Furthermore, the development of advanced manufacturing techniques, including large-scale roll-to-roll processing, will be crucial in reducing production costs and increasing output to meet growing global demand.
Key Players Shaping the Flexible Display Technology Industry Market
- LG Display Co Ltd
- Samsung Electronics Co Ltd
- BOE Technology Group Co Ltd
- TCL Electronics Holdings Limited
- AU Optronics Corp
- Innolux Corporation
- Sharp Corporation
- ROYOLE Corporation
- Huawei Technologies Co Ltd
- Chunghwa Picture Tubes Ltd
- Plastic Logic
- e-ink Holdings
- FlexEnable Technology Limited
- Guangzhou Oed Technologies Co Ltd
- Microtips Technology
Notable Milestones in Flexible Display Technology Industry Sector
- May 2022: LG Display showcased its next-generation OLED solutions at the 2022 Society for Information Display (SID) in San Jose, California, highlighting advancements from OLED.EX to bendable and foldable panels, reinforcing its market leadership.
- March 2022: Stanford chemical engineers announced the development of a high-brightness and stretchable display, a significant breakthrough with the potential to revolutionize human-electronics interaction.
In-Depth Flexible Display Technology Industry Market Outlook
The flexible display technology industry is on an accelerated growth trajectory, fueled by continuous technological advancements and expanding application horizons. The market outlook is exceptionally positive, driven by the relentless pursuit of innovation in materials science, manufacturing processes, and device integration. Key growth accelerators include the increasing demand for foldable and rollable devices in the consumer electronics sector, the burgeoning adoption of flexible displays in the automotive and medical industries, and the emerging opportunities in AR/VR and transparent display technologies. Strategic collaborations between industry leaders and continued investment in R&D will further solidify the market's expansion. The industry's ability to overcome remaining manufacturing cost and durability challenges will be crucial in unlocking its full market potential, positioning flexible displays as a foundational technology for the next generation of electronic devices and user experiences.
Flexible Display Technology Industry Segmentation
-
1. Display Type
- 1.1. OLED
- 1.2. LCD
- 1.3. EPD (Electronic Paper Display)
- 1.4. Other Display Types (LED)
-
2. Substrate Material
- 2.1. Glass
- 2.2. Plastic
- 2.3. Other Substrate Materials
-
3. Application
- 3.1. Smartphones and Tablets
- 3.2. Smart Wearables
- 3.3. Televisions and Digital Signage Systems
- 3.4. Personal Computers and Laptops
- 3.5. Other Ap
Flexible Display Technology Industry Segmentation By Geography
- 1. North America
- 2. Europe
- 3. Asia Pacific
- 4. Rest of the World
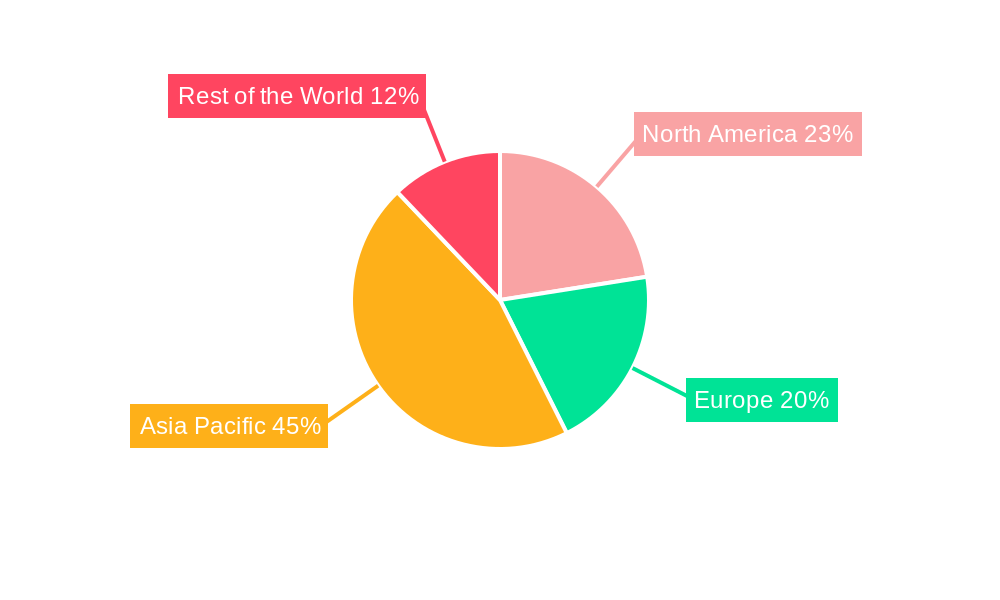
Flexible Display Technology Industry Regional Market Share
Geographic Coverage of Flexible Display Technology Industry
Flexible Display Technology Industry REPORT HIGHLIGHTS
| Aspects | Details |
|---|---|
| Study Period | 2020-2034 |
| Base Year | 2025 |
| Estimated Year | 2026 |
| Forecast Period | 2026-2034 |
| Historical Period | 2020-2025 |
| Growth Rate | CAGR of 34.80% from 2020-2034 |
| Segmentation |
|
Table of Contents
- 1. Introduction
- 1.1. Research Scope
- 1.2. Market Segmentation
- 1.3. Research Objective
- 1.4. Definitions and Assumptions
- 2. Executive Summary
- 2.1. Market Snapshot
- 3. Market Dynamics
- 3.1. Market Drivers
- 3.2. Market Restrains
- 3.3. Market Trends
- 3.4. Market Opportunities
- 4. Market Factor Analysis
- 4.1. Porters Five Forces
- 4.1.1. Bargaining Power of Suppliers
- 4.1.2. Bargaining Power of Buyers
- 4.1.3. Threat of New Entrants
- 4.1.4. Threat of Substitutes
- 4.1.5. Competitive Rivalry
- 4.2. PESTEL analysis
- 4.3. BCG Analysis
- 4.3.1. Stars (High Growth, High Market Share)
- 4.3.2. Cash Cows (Low Growth, High Market Share)
- 4.3.3. Question Mark (High Growth, Low Market Share)
- 4.3.4. Dogs (Low Growth, Low Market Share)
- 4.4. Ansoff Matrix Analysis
- 4.5. Supply Chain Analysis
- 4.6. Regulatory Landscape
- 4.7. Current Market Potential and Opportunity Assessment (TAM–SAM–SOM Framework)
- 4.8. VDR Analyst Note
- 4.1. Porters Five Forces
- 5. Market Analysis, Insights and Forecast 2021-2033
- 5.1. Market Analysis, Insights and Forecast - by Display Type
- 5.1.1. OLED
- 5.1.2. LCD
- 5.1.3. EPD (Electronic Paper Display)
- 5.1.4. Other Display Types (LED)
- 5.2. Market Analysis, Insights and Forecast - by Substrate Material
- 5.2.1. Glass
- 5.2.2. Plastic
- 5.2.3. Other Substrate Materials
- 5.3. Market Analysis, Insights and Forecast - by Application
- 5.3.1. Smartphones and Tablets
- 5.3.2. Smart Wearables
- 5.3.3. Televisions and Digital Signage Systems
- 5.3.4. Personal Computers and Laptops
- 5.3.5. Other Ap
- 5.4. Market Analysis, Insights and Forecast - by Region
- 5.4.1. North America
- 5.4.2. Europe
- 5.4.3. Asia Pacific
- 5.4.4. Rest of the World
- 5.1. Market Analysis, Insights and Forecast - by Display Type
- 6. Global Flexible Display Technology Industry Analysis, Insights and Forecast, 2021-2033
- 6.1. Market Analysis, Insights and Forecast - by Display Type
- 6.1.1. OLED
- 6.1.2. LCD
- 6.1.3. EPD (Electronic Paper Display)
- 6.1.4. Other Display Types (LED)
- 6.2. Market Analysis, Insights and Forecast - by Substrate Material
- 6.2.1. Glass
- 6.2.2. Plastic
- 6.2.3. Other Substrate Materials
- 6.3. Market Analysis, Insights and Forecast - by Application
- 6.3.1. Smartphones and Tablets
- 6.3.2. Smart Wearables
- 6.3.3. Televisions and Digital Signage Systems
- 6.3.4. Personal Computers and Laptops
- 6.3.5. Other Ap
- 6.1. Market Analysis, Insights and Forecast - by Display Type
- 7. North America Flexible Display Technology Industry Analysis, Insights and Forecast, 2021-2033
- 7.1. Market Analysis, Insights and Forecast - by Display Type
- 7.1.1. OLED
- 7.1.2. LCD
- 7.1.3. EPD (Electronic Paper Display)
- 7.1.4. Other Display Types (LED)
- 7.2. Market Analysis, Insights and Forecast - by Substrate Material
- 7.2.1. Glass
- 7.2.2. Plastic
- 7.2.3. Other Substrate Materials
- 7.3. Market Analysis, Insights and Forecast - by Application
- 7.3.1. Smartphones and Tablets
- 7.3.2. Smart Wearables
- 7.3.3. Televisions and Digital Signage Systems
- 7.3.4. Personal Computers and Laptops
- 7.3.5. Other Ap
- 7.1. Market Analysis, Insights and Forecast - by Display Type
- 8. Europe Flexible Display Technology Industry Analysis, Insights and Forecast, 2021-2033
- 8.1. Market Analysis, Insights and Forecast - by Display Type
- 8.1.1. OLED
- 8.1.2. LCD
- 8.1.3. EPD (Electronic Paper Display)
- 8.1.4. Other Display Types (LED)
- 8.2. Market Analysis, Insights and Forecast - by Substrate Material
- 8.2.1. Glass
- 8.2.2. Plastic
- 8.2.3. Other Substrate Materials
- 8.3. Market Analysis, Insights and Forecast - by Application
- 8.3.1. Smartphones and Tablets
- 8.3.2. Smart Wearables
- 8.3.3. Televisions and Digital Signage Systems
- 8.3.4. Personal Computers and Laptops
- 8.3.5. Other Ap
- 8.1. Market Analysis, Insights and Forecast - by Display Type
- 9. Asia Pacific Flexible Display Technology Industry Analysis, Insights and Forecast, 2021-2033
- 9.1. Market Analysis, Insights and Forecast - by Display Type
- 9.1.1. OLED
- 9.1.2. LCD
- 9.1.3. EPD (Electronic Paper Display)
- 9.1.4. Other Display Types (LED)
- 9.2. Market Analysis, Insights and Forecast - by Substrate Material
- 9.2.1. Glass
- 9.2.2. Plastic
- 9.2.3. Other Substrate Materials
- 9.3. Market Analysis, Insights and Forecast - by Application
- 9.3.1. Smartphones and Tablets
- 9.3.2. Smart Wearables
- 9.3.3. Televisions and Digital Signage Systems
- 9.3.4. Personal Computers and Laptops
- 9.3.5. Other Ap
- 9.1. Market Analysis, Insights and Forecast - by Display Type
- 10. Rest of the World Flexible Display Technology Industry Analysis, Insights and Forecast, 2021-2033
- 10.1. Market Analysis, Insights and Forecast - by Display Type
- 10.1.1. OLED
- 10.1.2. LCD
- 10.1.3. EPD (Electronic Paper Display)
- 10.1.4. Other Display Types (LED)
- 10.2. Market Analysis, Insights and Forecast - by Substrate Material
- 10.2.1. Glass
- 10.2.2. Plastic
- 10.2.3. Other Substrate Materials
- 10.3. Market Analysis, Insights and Forecast - by Application
- 10.3.1. Smartphones and Tablets
- 10.3.2. Smart Wearables
- 10.3.3. Televisions and Digital Signage Systems
- 10.3.4. Personal Computers and Laptops
- 10.3.5. Other Ap
- 10.1. Market Analysis, Insights and Forecast - by Display Type
- 11. Competitive Analysis
- 11.1. Company Profiles
- 11.1.1 LG Display Co Ltd
- 11.1.1.1. Company Overview
- 11.1.1.2. Products
- 11.1.1.3. Company Financials
- 11.1.1.4. SWOT Analysis
- 11.1.2 TCL Electronics Holdings Limited
- 11.1.2.1. Company Overview
- 11.1.2.2. Products
- 11.1.2.3. Company Financials
- 11.1.2.4. SWOT Analysis
- 11.1.3 Plastic Logic
- 11.1.3.1. Company Overview
- 11.1.3.2. Products
- 11.1.3.3. Company Financials
- 11.1.3.4. SWOT Analysis
- 11.1.4 e-ink Holdings
- 11.1.4.1. Company Overview
- 11.1.4.2. Products
- 11.1.4.3. Company Financials
- 11.1.4.4. SWOT Analysis
- 11.1.5 Samsung Electronics Co Ltd
- 11.1.5.1. Company Overview
- 11.1.5.2. Products
- 11.1.5.3. Company Financials
- 11.1.5.4. SWOT Analysis
- 11.1.6 FlexEnable Technology Limited
- 11.1.6.1. Company Overview
- 11.1.6.2. Products
- 11.1.6.3. Company Financials
- 11.1.6.4. SWOT Analysis
- 11.1.7 Innolux Corporation
- 11.1.7.1. Company Overview
- 11.1.7.2. Products
- 11.1.7.3. Company Financials
- 11.1.7.4. SWOT Analysis
- 11.1.8 Guangzhou Oed Technologies Co Ltd
- 11.1.8.1. Company Overview
- 11.1.8.2. Products
- 11.1.8.3. Company Financials
- 11.1.8.4. SWOT Analysis
- 11.1.9 Chunghwa Picture Tubes Ltd
- 11.1.9.1. Company Overview
- 11.1.9.2. Products
- 11.1.9.3. Company Financials
- 11.1.9.4. SWOT Analysis
- 11.1.10 Microtips Technology*List Not Exhaustive
- 11.1.10.1. Company Overview
- 11.1.10.2. Products
- 11.1.10.3. Company Financials
- 11.1.10.4. SWOT Analysis
- 11.1.11 Huawei Technologies Co Ltd
- 11.1.11.1. Company Overview
- 11.1.11.2. Products
- 11.1.11.3. Company Financials
- 11.1.11.4. SWOT Analysis
- 11.1.12 Sharp Corporation
- 11.1.12.1. Company Overview
- 11.1.12.2. Products
- 11.1.12.3. Company Financials
- 11.1.12.4. SWOT Analysis
- 11.1.13 ROYOLE Corporation
- 11.1.13.1. Company Overview
- 11.1.13.2. Products
- 11.1.13.3. Company Financials
- 11.1.13.4. SWOT Analysis
- 11.1.14 AU Optronics Corp
- 11.1.14.1. Company Overview
- 11.1.14.2. Products
- 11.1.14.3. Company Financials
- 11.1.14.4. SWOT Analysis
- 11.1.15 BOE Technology Group Co Ltd
- 11.1.15.1. Company Overview
- 11.1.15.2. Products
- 11.1.15.3. Company Financials
- 11.1.15.4. SWOT Analysis
- 11.1.1 LG Display Co Ltd
- 11.2. Market Entropy
- 11.2.1 Company's Key Areas Served
- 11.2.2 Recent Developments
- 11.3. Company Market Share Analysis 2025
- 11.3.1 Top 5 Companies Market Share Analysis
- 11.3.2 Top 3 Companies Market Share Analysis
- 11.4. List of Potential Customers
- 12. Research Methodology
List of Figures
- Figure 1: Global Flexible Display Technology Industry Revenue Breakdown (Million, %) by Region 2025 & 2033
- Figure 2: North America Flexible Display Technology Industry Revenue (Million), by Display Type 2025 & 2033
- Figure 3: North America Flexible Display Technology Industry Revenue Share (%), by Display Type 2025 & 2033
- Figure 4: North America Flexible Display Technology Industry Revenue (Million), by Substrate Material 2025 & 2033
- Figure 5: North America Flexible Display Technology Industry Revenue Share (%), by Substrate Material 2025 & 2033
- Figure 6: North America Flexible Display Technology Industry Revenue (Million), by Application 2025 & 2033
- Figure 7: North America Flexible Display Technology Industry Revenue Share (%), by Application 2025 & 2033
- Figure 8: North America Flexible Display Technology Industry Revenue (Million), by Country 2025 & 2033
- Figure 9: North America Flexible Display Technology Industry Revenue Share (%), by Country 2025 & 2033
- Figure 10: Europe Flexible Display Technology Industry Revenue (Million), by Display Type 2025 & 2033
- Figure 11: Europe Flexible Display Technology Industry Revenue Share (%), by Display Type 2025 & 2033
- Figure 12: Europe Flexible Display Technology Industry Revenue (Million), by Substrate Material 2025 & 2033
- Figure 13: Europe Flexible Display Technology Industry Revenue Share (%), by Substrate Material 2025 & 2033
- Figure 14: Europe Flexible Display Technology Industry Revenue (Million), by Application 2025 & 2033
- Figure 15: Europe Flexible Display Technology Industry Revenue Share (%), by Application 2025 & 2033
- Figure 16: Europe Flexible Display Technology Industry Revenue (Million), by Country 2025 & 2033
- Figure 17: Europe Flexible Display Technology Industry Revenue Share (%), by Country 2025 & 2033
- Figure 18: Asia Pacific Flexible Display Technology Industry Revenue (Million), by Display Type 2025 & 2033
- Figure 19: Asia Pacific Flexible Display Technology Industry Revenue Share (%), by Display Type 2025 & 2033
- Figure 20: Asia Pacific Flexible Display Technology Industry Revenue (Million), by Substrate Material 2025 & 2033
- Figure 21: Asia Pacific Flexible Display Technology Industry Revenue Share (%), by Substrate Material 2025 & 2033
- Figure 22: Asia Pacific Flexible Display Technology Industry Revenue (Million), by Application 2025 & 2033
- Figure 23: Asia Pacific Flexible Display Technology Industry Revenue Share (%), by Application 2025 & 2033
- Figure 24: Asia Pacific Flexible Display Technology Industry Revenue (Million), by Country 2025 & 2033
- Figure 25: Asia Pacific Flexible Display Technology Industry Revenue Share (%), by Country 2025 & 2033
- Figure 26: Rest of the World Flexible Display Technology Industry Revenue (Million), by Display Type 2025 & 2033
- Figure 27: Rest of the World Flexible Display Technology Industry Revenue Share (%), by Display Type 2025 & 2033
- Figure 28: Rest of the World Flexible Display Technology Industry Revenue (Million), by Substrate Material 2025 & 2033
- Figure 29: Rest of the World Flexible Display Technology Industry Revenue Share (%), by Substrate Material 2025 & 2033
- Figure 30: Rest of the World Flexible Display Technology Industry Revenue (Million), by Application 2025 & 2033
- Figure 31: Rest of the World Flexible Display Technology Industry Revenue Share (%), by Application 2025 & 2033
- Figure 32: Rest of the World Flexible Display Technology Industry Revenue (Million), by Country 2025 & 2033
- Figure 33: Rest of the World Flexible Display Technology Industry Revenue Share (%), by Country 2025 & 2033
List of Tables
- Table 1: Global Flexible Display Technology Industry Revenue Million Forecast, by Display Type 2020 & 2033
- Table 2: Global Flexible Display Technology Industry Revenue Million Forecast, by Substrate Material 2020 & 2033
- Table 3: Global Flexible Display Technology Industry Revenue Million Forecast, by Application 2020 & 2033
- Table 4: Global Flexible Display Technology Industry Revenue Million Forecast, by Region 2020 & 2033
- Table 5: Global Flexible Display Technology Industry Revenue Million Forecast, by Display Type 2020 & 2033
- Table 6: Global Flexible Display Technology Industry Revenue Million Forecast, by Substrate Material 2020 & 2033
- Table 7: Global Flexible Display Technology Industry Revenue Million Forecast, by Application 2020 & 2033
- Table 8: Global Flexible Display Technology Industry Revenue Million Forecast, by Country 2020 & 2033
- Table 9: Global Flexible Display Technology Industry Revenue Million Forecast, by Display Type 2020 & 2033
- Table 10: Global Flexible Display Technology Industry Revenue Million Forecast, by Substrate Material 2020 & 2033
- Table 11: Global Flexible Display Technology Industry Revenue Million Forecast, by Application 2020 & 2033
- Table 12: Global Flexible Display Technology Industry Revenue Million Forecast, by Country 2020 & 2033
- Table 13: Global Flexible Display Technology Industry Revenue Million Forecast, by Display Type 2020 & 2033
- Table 14: Global Flexible Display Technology Industry Revenue Million Forecast, by Substrate Material 2020 & 2033
- Table 15: Global Flexible Display Technology Industry Revenue Million Forecast, by Application 2020 & 2033
- Table 16: Global Flexible Display Technology Industry Revenue Million Forecast, by Country 2020 & 2033
- Table 17: Global Flexible Display Technology Industry Revenue Million Forecast, by Display Type 2020 & 2033
- Table 18: Global Flexible Display Technology Industry Revenue Million Forecast, by Substrate Material 2020 & 2033
- Table 19: Global Flexible Display Technology Industry Revenue Million Forecast, by Application 2020 & 2033
- Table 20: Global Flexible Display Technology Industry Revenue Million Forecast, by Country 2020 & 2033
Frequently Asked Questions
1. What is the projected Compound Annual Growth Rate (CAGR) of the Flexible Display Technology Industry?
The projected CAGR is approximately 34.80%.
2. Which companies are prominent players in the Flexible Display Technology Industry?
Key companies in the market include LG Display Co Ltd, TCL Electronics Holdings Limited, Plastic Logic, e-ink Holdings, Samsung Electronics Co Ltd, FlexEnable Technology Limited, Innolux Corporation, Guangzhou Oed Technologies Co Ltd, Chunghwa Picture Tubes Ltd, Microtips Technology*List Not Exhaustive, Huawei Technologies Co Ltd, Sharp Corporation, ROYOLE Corporation, AU Optronics Corp, BOE Technology Group Co Ltd.
3. What are the main segments of the Flexible Display Technology Industry?
The market segments include Display Type, Substrate Material, Application.
4. Can you provide details about the market size?
The market size is estimated to be USD 15.22 Million as of 2022.
5. What are some drivers contributing to market growth?
Innovation in Consumer Electronics; Increase in Demand for Greater Picture Quality.
6. What are the notable trends driving market growth?
Adoption of Flexible Display to Grow Significantly in Smartphones and Tablets.
7. Are there any restraints impacting market growth?
Higher R&D Cost and Highly Dynamic Market.
8. Can you provide examples of recent developments in the market?
May 2022 - LG Display brought its next-generation OLED solutions to the 2022 Society for Information Display (SID) held in San Jose, California, US. By introducing state-of-the-art OLED products ranging from its next-generation OLED.EX to bendable and foldable OLED panels, the company highlighted the evolution and versatility of OLED technology, aiming to solidify its OLED positioning in the market.
9. What pricing options are available for accessing the report?
Pricing options include single-user, multi-user, and enterprise licenses priced at USD 4750, USD 5250, and USD 8750 respectively.
10. Is the market size provided in terms of value or volume?
The market size is provided in terms of value, measured in Million.
11. Are there any specific market keywords associated with the report?
Yes, the market keyword associated with the report is "Flexible Display Technology Industry," which aids in identifying and referencing the specific market segment covered.
12. How do I determine which pricing option suits my needs best?
The pricing options vary based on user requirements and access needs. Individual users may opt for single-user licenses, while businesses requiring broader access may choose multi-user or enterprise licenses for cost-effective access to the report.
13. Are there any additional resources or data provided in the Flexible Display Technology Industry report?
While the report offers comprehensive insights, it's advisable to review the specific contents or supplementary materials provided to ascertain if additional resources or data are available.
14. How can I stay updated on further developments or reports in the Flexible Display Technology Industry?
To stay informed about further developments, trends, and reports in the Flexible Display Technology Industry, consider subscribing to industry newsletters, following relevant companies and organizations, or regularly checking reputable industry news sources and publications.
Methodology
Step 1 - Identification of Relevant Samples Size from Population Database


Step 2 - Approaches for Defining Global Market Size (Value, Volume* & Price*)

Note*: In applicable scenarios
Step 3 - Data Sources
Primary Research
- Web Analytics
- Survey Reports
- Research Institute
- Latest Research Reports
- Opinion Leaders
Secondary Research
- Annual Reports
- White Paper
- Latest Press Release
- Industry Association
- Paid Database
- Investor Presentations

Step 4 - Data Triangulation
Involves using different sources of information in order to increase the validity of a study
These sources are likely to be stakeholders in a program - participants, other researchers, program staff, other community members, and so on.
Then we put all data in single framework & apply various statistical tools to find out the dynamic on the market.
During the analysis stage, feedback from the stakeholder groups would be compared to determine areas of agreement as well as areas of divergence