

Key Insights
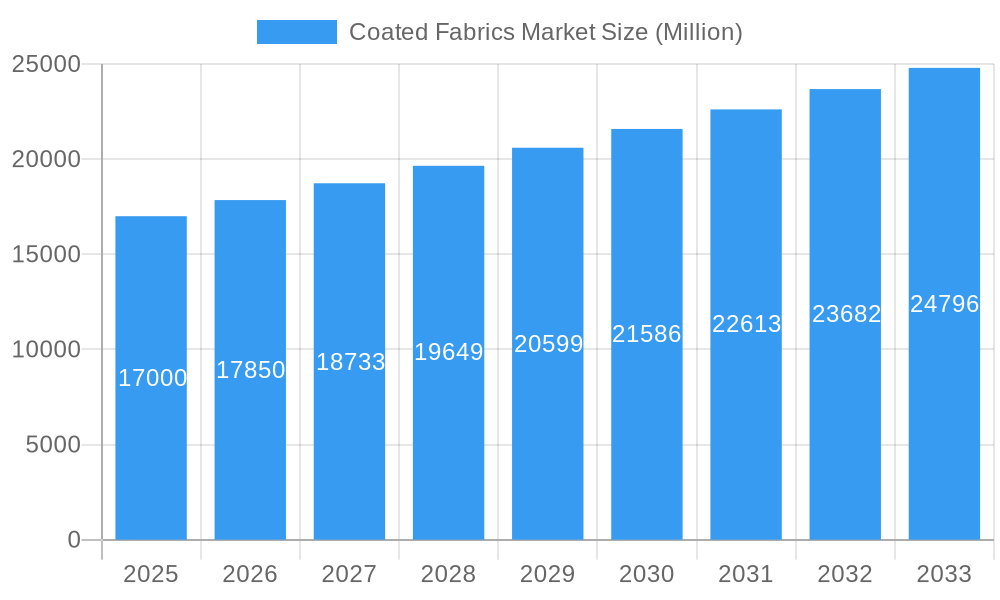
The global coated fabrics market is poised for significant expansion, projected to achieve a Compound Annual Growth Rate (CAGR) of 5.15% from 2025 to 2033. This growth is underpinned by robust demand across key sectors. The automotive and transportation industries are major contributors, leveraging coated fabrics for interior applications, seating, and protective elements. Growing requirements for high-performance protective apparel in healthcare and construction environments further fuel market ascendancy. The furniture sector’s preference for coated fabrics, citing their enhanced durability and ease of maintenance, also plays a pivotal role. Diverse industrial applications, ranging from conveyor belts to protective coverings, broaden the market's scope. Innovations in polymer coatings, delivering superior water resistance, UV protection, and flame retardancy, are critical growth enablers. Market segmentation by polymer type (acrylic, silicone, rubber-based) and application underscores the sector's versatility. The global coated fabrics market size was estimated at $24.67 billion in the base year of 2025.
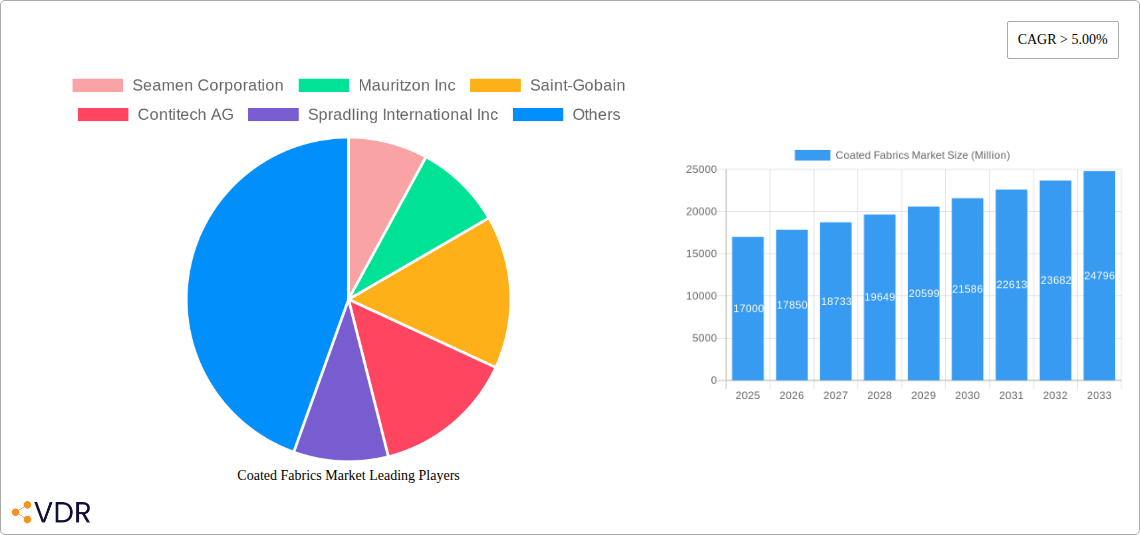
Coated Fabrics Market Market Size (In Billion)
Geographically, the Asia Pacific region, led by China and India, is anticipated to spearhead market growth, driven by rapid industrialization and burgeoning automotive sectors. North America and Europe will remain vital markets, fueled by the demand for advanced materials in protective clothing and specialized industrial uses. Potential market impediments include volatility in raw material pricing and environmental considerations associated with specific coating formulations. Key industry stakeholders, including Seamen Corporation, Mauritzon Inc, Saint-Gobain, and BASF, are instrumental in driving market dynamics through continuous innovation and strategic expansion initiatives. The market's trajectory is intrinsically linked to ongoing advancements in coating technologies, the adoption of sustainable sourcing practices, and proactive adaptation to evolving regulatory frameworks. The forecast period from 2025 to 2033 presents substantial growth prospects for both established and emerging market participants.
Coated Fabrics Market Company Market Share
Coated Fabrics Market: A Comprehensive Market Report (2019-2033)
This in-depth report provides a comprehensive analysis of the Coated Fabrics Market, encompassing market dynamics, growth trends, regional insights, product landscapes, key players, and future outlooks. The study covers the period from 2019 to 2033, with a focus on the estimated year 2025 and a forecast period from 2025 to 2033. This report is crucial for industry professionals, investors, and strategic decision-makers seeking a detailed understanding of this dynamic market. The total market size is projected to reach xx Million units by 2033.
Coated Fabrics Market Dynamics & Structure
The Coated Fabrics market is characterized by moderate concentration, with key players holding significant market share. Technological innovation, particularly in polymer coatings and backing materials, is a major driver. Stringent regulatory frameworks related to environmental impact and material safety influence manufacturing processes and product development. The market witnesses competitive pressure from substitute materials, particularly in specific applications. End-user demographics, notably the growth of the automotive and construction sectors, significantly impacts market demand. M&A activity within the industry, as seen in recent acquisitions, signifies consolidation and strategic expansion.
- Market Concentration: Moderately concentrated, with top 5 players holding approximately xx% market share in 2024.
- Technological Innovation: Focus on enhanced durability, water resistance, and sustainability.
- Regulatory Frameworks: Compliance with environmental and safety regulations influences production costs and material choices.
- Competitive Substitutes: Alternatives like uncoated fabrics and other protective materials pose competitive pressure.
- End-User Demographics: Growth in automotive, construction, and protective clothing sectors drives market demand.
- M&A Trends: Recent acquisitions indicate industry consolidation and expansion strategies (e.g., Trelleborg's acquisition of Alpha Engineered Composites' coated textiles division).
Coated Fabrics Market Growth Trends & Insights
The Coated Fabrics Market exhibited a CAGR of xx% during the historical period (2019-2024) and is projected to maintain a CAGR of xx% during the forecast period (2025-2033). This growth is driven by increasing demand across various end-use sectors, notably automotive & transportation, and the rising adoption of coated fabrics in protective clothing. Technological advancements, such as the development of more durable and sustainable materials, are further propelling market expansion. Changing consumer preferences towards high-performance, eco-friendly products are also influencing market trends. Market penetration is expected to increase significantly, especially in developing economies, driven by rising disposable incomes and infrastructure development. Disruptions from innovative materials and manufacturing processes are expected to further shape market dynamics. The market size is estimated at xx Million units in 2025, and is projected to reach xx Million units by 2033.
Dominant Regions, Countries, or Segments in Coated Fabrics Market
The North American region currently holds the largest market share in the coated fabrics market, followed by Europe and Asia-Pacific. Within the product segments, Polymer Coated fabrics dominate, owing to their versatility and widespread applications. The Automotive & Transportation application segment is the leading end-use sector, driven by high demand for durable and weather-resistant materials.
- Leading Region: North America, driven by robust automotive and construction sectors.
- Leading Application: Automotive & Transportation, owing to high demand for durable and weather-resistant materials.
- Leading Product: Polymer Coated fabrics, due to their versatility and wide range of applications.
- Key Drivers: Growing automotive production, infrastructure development, and rising disposable incomes in developing economies.
Coated Fabrics Market Product Landscape
The coated fabrics market offers a diverse range of products, categorized by coating type (polymer, rubber) and backing material. Polymer-coated fabrics, including acrylic, silicone, and polyurethane coatings, offer superior performance characteristics such as water resistance, durability, and flexibility. Rubber-coated fabrics provide excellent abrasion resistance and are suitable for heavy-duty applications. Ongoing innovations focus on enhancing performance, sustainability, and cost-effectiveness. Product differentiation relies on unique features such as UV resistance, antimicrobial properties, and specific functionalities tailored to end-use requirements.
Key Drivers, Barriers & Challenges in Coated Fabrics Market
Key Drivers:
- Increasing demand from automotive and protective clothing industries.
- Technological advancements leading to enhanced product performance and sustainability.
- Favorable government policies promoting infrastructure development.
Challenges & Restraints:
- Fluctuations in raw material prices.
- Stringent environmental regulations.
- Intense competition from substitute materials.
- Supply chain disruptions impacting production and delivery.
Emerging Opportunities in Coated Fabrics Market
- Growing demand for sustainable and eco-friendly coated fabrics.
- Expansion into new applications such as renewable energy and medical devices.
- Development of innovative coating technologies with enhanced performance characteristics.
- Penetration into untapped markets in developing economies.
Growth Accelerators in the Coated Fabrics Market Industry
Technological advancements, particularly in polymer science and coating techniques, are key growth accelerators. Strategic partnerships between material suppliers and fabric manufacturers are driving innovation and market expansion. The development of specialized coatings with enhanced properties, such as UV resistance and antimicrobial protection, is creating new market opportunities. Furthermore, the growing focus on sustainability is driving demand for eco-friendly coated fabrics, creating new growth avenues for producers.
Key Players Shaping the Coated Fabrics Market Market
- Seamen Corporation
- Mauritzon Inc
- Saint-Gobain
- Contitech AG
- Spradling International Inc
- BASF SE
- Graniteville
- Trelleborg AB
- Regatta Professional
- OMNOVA Solutions Inc
Notable Milestones in Coated Fabrics Market Sector
- January 2022: Trelleborg Industrial Solutions acquired the coated textiles division of Alpha Engineered Composites, expanding its market presence and product portfolio.
- July 2022: BASF collaborated with Permionics Membranes to develop coated fabrics for face masks using BASF's Ultrason E PESU polymer, showcasing innovation in filtration technology.
In-Depth Coated Fabrics Market Market Outlook
The Coated Fabrics Market is poised for sustained growth driven by ongoing technological advancements, expanding applications, and increasing demand from key end-use sectors. Strategic partnerships and investments in research and development will further drive innovation. The market is expected to witness significant expansion in developing economies, presenting lucrative opportunities for market players. Focus on sustainability and the development of eco-friendly materials will shape future market trends.
Coated Fabrics Market Segmentation
-
1. Product
-
1.1. Polymer Coated
- 1.1.1. PVC Coated
- 1.1.2. PU Coated
- 1.1.3. PE Coated
- 1.1.4. Other Polymer Coated (Acrylic, Silicone, etc.)
- 1.2. Fabric Backed Wall Coverings
- 1.3. Rubber Coated
-
1.1. Polymer Coated
-
2. Application
- 2.1. Automotive & Transportation
- 2.2. Protective Clothing
- 2.3. Furniture
- 2.4. Industrial
- 2.5. Other Applications
Coated Fabrics Market Segmentation By Geography
-
1. Asia Pacific
- 1.1. China
- 1.2. India
- 1.3. Japan
- 1.4. South Korea
- 1.5. Rest of Asia Pacific
-
2. North America
- 2.1. United States
- 2.2. Canada
- 2.3. Mexico
-
3. Europe
- 3.1. Germany
- 3.2. United Kingdom
- 3.3. Italy
- 3.4. France
- 3.5. Rest of Europe
-
4. South America
- 4.1. Brazil
- 4.2. Argentina
- 4.3. Rest of South America
-
5. Middle East and Africa
- 5.1. Saudi Arabia
- 5.2. South Africa
- 5.3. Rest of Middle East and Africa
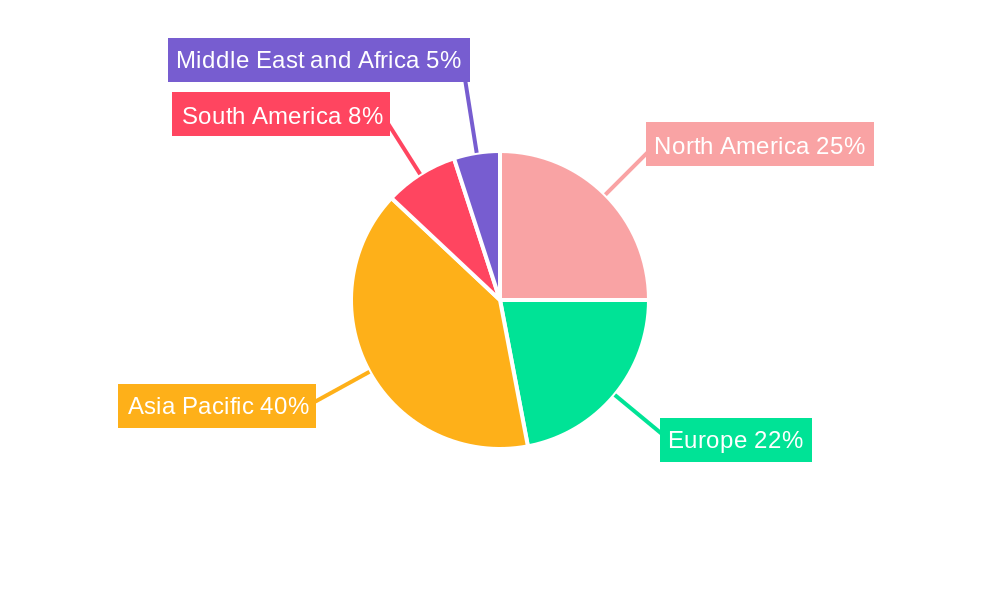
Coated Fabrics Market Regional Market Share
Geographic Coverage of Coated Fabrics Market
Coated Fabrics Market REPORT HIGHLIGHTS
| Aspects | Details |
|---|---|
| Study Period | 2020-2034 |
| Base Year | 2025 |
| Estimated Year | 2026 |
| Forecast Period | 2026-2034 |
| Historical Period | 2020-2025 |
| Growth Rate | CAGR of 5.15% from 2020-2034 |
| Segmentation |
|
Table of Contents
- 1. Introduction
- 1.1. Research Scope
- 1.2. Market Segmentation
- 1.3. Research Objective
- 1.4. Definitions and Assumptions
- 2. Executive Summary
- 2.1. Market Snapshot
- 3. Market Dynamics
- 3.1. Market Drivers
- 3.2. Market Restrains
- 3.3. Market Trends
- 3.4. Market Opportunities
- 4. Market Factor Analysis
- 4.1. Porters Five Forces
- 4.1.1. Bargaining Power of Suppliers
- 4.1.2. Bargaining Power of Buyers
- 4.1.3. Threat of New Entrants
- 4.1.4. Threat of Substitutes
- 4.1.5. Competitive Rivalry
- 4.2. PESTEL analysis
- 4.3. BCG Analysis
- 4.3.1. Stars (High Growth, High Market Share)
- 4.3.2. Cash Cows (Low Growth, High Market Share)
- 4.3.3. Question Mark (High Growth, Low Market Share)
- 4.3.4. Dogs (Low Growth, Low Market Share)
- 4.4. Ansoff Matrix Analysis
- 4.5. Supply Chain Analysis
- 4.6. Regulatory Landscape
- 4.7. Current Market Potential and Opportunity Assessment (TAM–SAM–SOM Framework)
- 4.8. VDR Analyst Note
- 4.1. Porters Five Forces
- 5. Market Analysis, Insights and Forecast 2021-2033
- 5.1. Market Analysis, Insights and Forecast - by Product
- 5.1.1. Polymer Coated
- 5.1.1.1. PVC Coated
- 5.1.1.2. PU Coated
- 5.1.1.3. PE Coated
- 5.1.1.4. Other Polymer Coated (Acrylic, Silicone, etc.)
- 5.1.2. Fabric Backed Wall Coverings
- 5.1.3. Rubber Coated
- 5.1.1. Polymer Coated
- 5.2. Market Analysis, Insights and Forecast - by Application
- 5.2.1. Automotive & Transportation
- 5.2.2. Protective Clothing
- 5.2.3. Furniture
- 5.2.4. Industrial
- 5.2.5. Other Applications
- 5.3. Market Analysis, Insights and Forecast - by Region
- 5.3.1. Asia Pacific
- 5.3.2. North America
- 5.3.3. Europe
- 5.3.4. South America
- 5.3.5. Middle East and Africa
- 5.1. Market Analysis, Insights and Forecast - by Product
- 6. Global Coated Fabrics Market Analysis, Insights and Forecast, 2021-2033
- 6.1. Market Analysis, Insights and Forecast - by Product
- 6.1.1. Polymer Coated
- 6.1.1.1. PVC Coated
- 6.1.1.2. PU Coated
- 6.1.1.3. PE Coated
- 6.1.1.4. Other Polymer Coated (Acrylic, Silicone, etc.)
- 6.1.2. Fabric Backed Wall Coverings
- 6.1.3. Rubber Coated
- 6.1.1. Polymer Coated
- 6.2. Market Analysis, Insights and Forecast - by Application
- 6.2.1. Automotive & Transportation
- 6.2.2. Protective Clothing
- 6.2.3. Furniture
- 6.2.4. Industrial
- 6.2.5. Other Applications
- 6.1. Market Analysis, Insights and Forecast - by Product
- 7. Asia Pacific Coated Fabrics Market Analysis, Insights and Forecast, 2021-2033
- 7.1. Market Analysis, Insights and Forecast - by Product
- 7.1.1. Polymer Coated
- 7.1.1.1. PVC Coated
- 7.1.1.2. PU Coated
- 7.1.1.3. PE Coated
- 7.1.1.4. Other Polymer Coated (Acrylic, Silicone, etc.)
- 7.1.2. Fabric Backed Wall Coverings
- 7.1.3. Rubber Coated
- 7.1.1. Polymer Coated
- 7.2. Market Analysis, Insights and Forecast - by Application
- 7.2.1. Automotive & Transportation
- 7.2.2. Protective Clothing
- 7.2.3. Furniture
- 7.2.4. Industrial
- 7.2.5. Other Applications
- 7.1. Market Analysis, Insights and Forecast - by Product
- 8. North America Coated Fabrics Market Analysis, Insights and Forecast, 2021-2033
- 8.1. Market Analysis, Insights and Forecast - by Product
- 8.1.1. Polymer Coated
- 8.1.1.1. PVC Coated
- 8.1.1.2. PU Coated
- 8.1.1.3. PE Coated
- 8.1.1.4. Other Polymer Coated (Acrylic, Silicone, etc.)
- 8.1.2. Fabric Backed Wall Coverings
- 8.1.3. Rubber Coated
- 8.1.1. Polymer Coated
- 8.2. Market Analysis, Insights and Forecast - by Application
- 8.2.1. Automotive & Transportation
- 8.2.2. Protective Clothing
- 8.2.3. Furniture
- 8.2.4. Industrial
- 8.2.5. Other Applications
- 8.1. Market Analysis, Insights and Forecast - by Product
- 9. Europe Coated Fabrics Market Analysis, Insights and Forecast, 2021-2033
- 9.1. Market Analysis, Insights and Forecast - by Product
- 9.1.1. Polymer Coated
- 9.1.1.1. PVC Coated
- 9.1.1.2. PU Coated
- 9.1.1.3. PE Coated
- 9.1.1.4. Other Polymer Coated (Acrylic, Silicone, etc.)
- 9.1.2. Fabric Backed Wall Coverings
- 9.1.3. Rubber Coated
- 9.1.1. Polymer Coated
- 9.2. Market Analysis, Insights and Forecast - by Application
- 9.2.1. Automotive & Transportation
- 9.2.2. Protective Clothing
- 9.2.3. Furniture
- 9.2.4. Industrial
- 9.2.5. Other Applications
- 9.1. Market Analysis, Insights and Forecast - by Product
- 10. South America Coated Fabrics Market Analysis, Insights and Forecast, 2021-2033
- 10.1. Market Analysis, Insights and Forecast - by Product
- 10.1.1. Polymer Coated
- 10.1.1.1. PVC Coated
- 10.1.1.2. PU Coated
- 10.1.1.3. PE Coated
- 10.1.1.4. Other Polymer Coated (Acrylic, Silicone, etc.)
- 10.1.2. Fabric Backed Wall Coverings
- 10.1.3. Rubber Coated
- 10.1.1. Polymer Coated
- 10.2. Market Analysis, Insights and Forecast - by Application
- 10.2.1. Automotive & Transportation
- 10.2.2. Protective Clothing
- 10.2.3. Furniture
- 10.2.4. Industrial
- 10.2.5. Other Applications
- 10.1. Market Analysis, Insights and Forecast - by Product
- 11. Middle East and Africa Coated Fabrics Market Analysis, Insights and Forecast, 2021-2033
- 11.1. Market Analysis, Insights and Forecast - by Product
- 11.1.1. Polymer Coated
- 11.1.1.1. PVC Coated
- 11.1.1.2. PU Coated
- 11.1.1.3. PE Coated
- 11.1.1.4. Other Polymer Coated (Acrylic, Silicone, etc.)
- 11.1.2. Fabric Backed Wall Coverings
- 11.1.3. Rubber Coated
- 11.1.1. Polymer Coated
- 11.2. Market Analysis, Insights and Forecast - by Application
- 11.2.1. Automotive & Transportation
- 11.2.2. Protective Clothing
- 11.2.3. Furniture
- 11.2.4. Industrial
- 11.2.5. Other Applications
- 11.1. Market Analysis, Insights and Forecast - by Product
- 12. Competitive Analysis
- 12.1. Company Profiles
- 12.1.1 Seamen Corporation
- 12.1.1.1. Company Overview
- 12.1.1.2. Products
- 12.1.1.3. Company Financials
- 12.1.1.4. SWOT Analysis
- 12.1.2 Mauritzon Inc
- 12.1.2.1. Company Overview
- 12.1.2.2. Products
- 12.1.2.3. Company Financials
- 12.1.2.4. SWOT Analysis
- 12.1.3 Saint-Gobain
- 12.1.3.1. Company Overview
- 12.1.3.2. Products
- 12.1.3.3. Company Financials
- 12.1.3.4. SWOT Analysis
- 12.1.4 Contitech AG
- 12.1.4.1. Company Overview
- 12.1.4.2. Products
- 12.1.4.3. Company Financials
- 12.1.4.4. SWOT Analysis
- 12.1.5 Spradling International Inc
- 12.1.5.1. Company Overview
- 12.1.5.2. Products
- 12.1.5.3. Company Financials
- 12.1.5.4. SWOT Analysis
- 12.1.6 BASF SE
- 12.1.6.1. Company Overview
- 12.1.6.2. Products
- 12.1.6.3. Company Financials
- 12.1.6.4. SWOT Analysis
- 12.1.7 Graniteville
- 12.1.7.1. Company Overview
- 12.1.7.2. Products
- 12.1.7.3. Company Financials
- 12.1.7.4. SWOT Analysis
- 12.1.8 Trelleborg AB
- 12.1.8.1. Company Overview
- 12.1.8.2. Products
- 12.1.8.3. Company Financials
- 12.1.8.4. SWOT Analysis
- 12.1.9 Regatta Professional
- 12.1.9.1. Company Overview
- 12.1.9.2. Products
- 12.1.9.3. Company Financials
- 12.1.9.4. SWOT Analysis
- 12.1.10 OMNOVA Solutions Inc
- 12.1.10.1. Company Overview
- 12.1.10.2. Products
- 12.1.10.3. Company Financials
- 12.1.10.4. SWOT Analysis
- 12.1.1 Seamen Corporation
- 12.2. Market Entropy
- 12.2.1 Company's Key Areas Served
- 12.2.2 Recent Developments
- 12.3. Company Market Share Analysis 2025
- 12.3.1 Top 5 Companies Market Share Analysis
- 12.3.2 Top 3 Companies Market Share Analysis
- 12.4. List of Potential Customers
- 13. Research Methodology
List of Figures
- Figure 1: Global Coated Fabrics Market Revenue Breakdown (billion, %) by Region 2025 & 2033
- Figure 2: Global Coated Fabrics Market Volume Breakdown (g/m2, %) by Region 2025 & 2033
- Figure 3: Asia Pacific Coated Fabrics Market Revenue (billion), by Product 2025 & 2033
- Figure 4: Asia Pacific Coated Fabrics Market Volume (g/m2), by Product 2025 & 2033
- Figure 5: Asia Pacific Coated Fabrics Market Revenue Share (%), by Product 2025 & 2033
- Figure 6: Asia Pacific Coated Fabrics Market Volume Share (%), by Product 2025 & 2033
- Figure 7: Asia Pacific Coated Fabrics Market Revenue (billion), by Application 2025 & 2033
- Figure 8: Asia Pacific Coated Fabrics Market Volume (g/m2), by Application 2025 & 2033
- Figure 9: Asia Pacific Coated Fabrics Market Revenue Share (%), by Application 2025 & 2033
- Figure 10: Asia Pacific Coated Fabrics Market Volume Share (%), by Application 2025 & 2033
- Figure 11: Asia Pacific Coated Fabrics Market Revenue (billion), by Country 2025 & 2033
- Figure 12: Asia Pacific Coated Fabrics Market Volume (g/m2), by Country 2025 & 2033
- Figure 13: Asia Pacific Coated Fabrics Market Revenue Share (%), by Country 2025 & 2033
- Figure 14: Asia Pacific Coated Fabrics Market Volume Share (%), by Country 2025 & 2033
- Figure 15: North America Coated Fabrics Market Revenue (billion), by Product 2025 & 2033
- Figure 16: North America Coated Fabrics Market Volume (g/m2), by Product 2025 & 2033
- Figure 17: North America Coated Fabrics Market Revenue Share (%), by Product 2025 & 2033
- Figure 18: North America Coated Fabrics Market Volume Share (%), by Product 2025 & 2033
- Figure 19: North America Coated Fabrics Market Revenue (billion), by Application 2025 & 2033
- Figure 20: North America Coated Fabrics Market Volume (g/m2), by Application 2025 & 2033
- Figure 21: North America Coated Fabrics Market Revenue Share (%), by Application 2025 & 2033
- Figure 22: North America Coated Fabrics Market Volume Share (%), by Application 2025 & 2033
- Figure 23: North America Coated Fabrics Market Revenue (billion), by Country 2025 & 2033
- Figure 24: North America Coated Fabrics Market Volume (g/m2), by Country 2025 & 2033
- Figure 25: North America Coated Fabrics Market Revenue Share (%), by Country 2025 & 2033
- Figure 26: North America Coated Fabrics Market Volume Share (%), by Country 2025 & 2033
- Figure 27: Europe Coated Fabrics Market Revenue (billion), by Product 2025 & 2033
- Figure 28: Europe Coated Fabrics Market Volume (g/m2), by Product 2025 & 2033
- Figure 29: Europe Coated Fabrics Market Revenue Share (%), by Product 2025 & 2033
- Figure 30: Europe Coated Fabrics Market Volume Share (%), by Product 2025 & 2033
- Figure 31: Europe Coated Fabrics Market Revenue (billion), by Application 2025 & 2033
- Figure 32: Europe Coated Fabrics Market Volume (g/m2), by Application 2025 & 2033
- Figure 33: Europe Coated Fabrics Market Revenue Share (%), by Application 2025 & 2033
- Figure 34: Europe Coated Fabrics Market Volume Share (%), by Application 2025 & 2033
- Figure 35: Europe Coated Fabrics Market Revenue (billion), by Country 2025 & 2033
- Figure 36: Europe Coated Fabrics Market Volume (g/m2), by Country 2025 & 2033
- Figure 37: Europe Coated Fabrics Market Revenue Share (%), by Country 2025 & 2033
- Figure 38: Europe Coated Fabrics Market Volume Share (%), by Country 2025 & 2033
- Figure 39: South America Coated Fabrics Market Revenue (billion), by Product 2025 & 2033
- Figure 40: South America Coated Fabrics Market Volume (g/m2), by Product 2025 & 2033
- Figure 41: South America Coated Fabrics Market Revenue Share (%), by Product 2025 & 2033
- Figure 42: South America Coated Fabrics Market Volume Share (%), by Product 2025 & 2033
- Figure 43: South America Coated Fabrics Market Revenue (billion), by Application 2025 & 2033
- Figure 44: South America Coated Fabrics Market Volume (g/m2), by Application 2025 & 2033
- Figure 45: South America Coated Fabrics Market Revenue Share (%), by Application 2025 & 2033
- Figure 46: South America Coated Fabrics Market Volume Share (%), by Application 2025 & 2033
- Figure 47: South America Coated Fabrics Market Revenue (billion), by Country 2025 & 2033
- Figure 48: South America Coated Fabrics Market Volume (g/m2), by Country 2025 & 2033
- Figure 49: South America Coated Fabrics Market Revenue Share (%), by Country 2025 & 2033
- Figure 50: South America Coated Fabrics Market Volume Share (%), by Country 2025 & 2033
- Figure 51: Middle East and Africa Coated Fabrics Market Revenue (billion), by Product 2025 & 2033
- Figure 52: Middle East and Africa Coated Fabrics Market Volume (g/m2), by Product 2025 & 2033
- Figure 53: Middle East and Africa Coated Fabrics Market Revenue Share (%), by Product 2025 & 2033
- Figure 54: Middle East and Africa Coated Fabrics Market Volume Share (%), by Product 2025 & 2033
- Figure 55: Middle East and Africa Coated Fabrics Market Revenue (billion), by Application 2025 & 2033
- Figure 56: Middle East and Africa Coated Fabrics Market Volume (g/m2), by Application 2025 & 2033
- Figure 57: Middle East and Africa Coated Fabrics Market Revenue Share (%), by Application 2025 & 2033
- Figure 58: Middle East and Africa Coated Fabrics Market Volume Share (%), by Application 2025 & 2033
- Figure 59: Middle East and Africa Coated Fabrics Market Revenue (billion), by Country 2025 & 2033
- Figure 60: Middle East and Africa Coated Fabrics Market Volume (g/m2), by Country 2025 & 2033
- Figure 61: Middle East and Africa Coated Fabrics Market Revenue Share (%), by Country 2025 & 2033
- Figure 62: Middle East and Africa Coated Fabrics Market Volume Share (%), by Country 2025 & 2033
List of Tables
- Table 1: Global Coated Fabrics Market Revenue billion Forecast, by Product 2020 & 2033
- Table 2: Global Coated Fabrics Market Volume g/m2 Forecast, by Product 2020 & 2033
- Table 3: Global Coated Fabrics Market Revenue billion Forecast, by Application 2020 & 2033
- Table 4: Global Coated Fabrics Market Volume g/m2 Forecast, by Application 2020 & 2033
- Table 5: Global Coated Fabrics Market Revenue billion Forecast, by Region 2020 & 2033
- Table 6: Global Coated Fabrics Market Volume g/m2 Forecast, by Region 2020 & 2033
- Table 7: Global Coated Fabrics Market Revenue billion Forecast, by Product 2020 & 2033
- Table 8: Global Coated Fabrics Market Volume g/m2 Forecast, by Product 2020 & 2033
- Table 9: Global Coated Fabrics Market Revenue billion Forecast, by Application 2020 & 2033
- Table 10: Global Coated Fabrics Market Volume g/m2 Forecast, by Application 2020 & 2033
- Table 11: Global Coated Fabrics Market Revenue billion Forecast, by Country 2020 & 2033
- Table 12: Global Coated Fabrics Market Volume g/m2 Forecast, by Country 2020 & 2033
- Table 13: China Coated Fabrics Market Revenue (billion) Forecast, by Application 2020 & 2033
- Table 14: China Coated Fabrics Market Volume (g/m2) Forecast, by Application 2020 & 2033
- Table 15: India Coated Fabrics Market Revenue (billion) Forecast, by Application 2020 & 2033
- Table 16: India Coated Fabrics Market Volume (g/m2) Forecast, by Application 2020 & 2033
- Table 17: Japan Coated Fabrics Market Revenue (billion) Forecast, by Application 2020 & 2033
- Table 18: Japan Coated Fabrics Market Volume (g/m2) Forecast, by Application 2020 & 2033
- Table 19: South Korea Coated Fabrics Market Revenue (billion) Forecast, by Application 2020 & 2033
- Table 20: South Korea Coated Fabrics Market Volume (g/m2) Forecast, by Application 2020 & 2033
- Table 21: Rest of Asia Pacific Coated Fabrics Market Revenue (billion) Forecast, by Application 2020 & 2033
- Table 22: Rest of Asia Pacific Coated Fabrics Market Volume (g/m2) Forecast, by Application 2020 & 2033
- Table 23: Global Coated Fabrics Market Revenue billion Forecast, by Product 2020 & 2033
- Table 24: Global Coated Fabrics Market Volume g/m2 Forecast, by Product 2020 & 2033
- Table 25: Global Coated Fabrics Market Revenue billion Forecast, by Application 2020 & 2033
- Table 26: Global Coated Fabrics Market Volume g/m2 Forecast, by Application 2020 & 2033
- Table 27: Global Coated Fabrics Market Revenue billion Forecast, by Country 2020 & 2033
- Table 28: Global Coated Fabrics Market Volume g/m2 Forecast, by Country 2020 & 2033
- Table 29: United States Coated Fabrics Market Revenue (billion) Forecast, by Application 2020 & 2033
- Table 30: United States Coated Fabrics Market Volume (g/m2) Forecast, by Application 2020 & 2033
- Table 31: Canada Coated Fabrics Market Revenue (billion) Forecast, by Application 2020 & 2033
- Table 32: Canada Coated Fabrics Market Volume (g/m2) Forecast, by Application 2020 & 2033
- Table 33: Mexico Coated Fabrics Market Revenue (billion) Forecast, by Application 2020 & 2033
- Table 34: Mexico Coated Fabrics Market Volume (g/m2) Forecast, by Application 2020 & 2033
- Table 35: Global Coated Fabrics Market Revenue billion Forecast, by Product 2020 & 2033
- Table 36: Global Coated Fabrics Market Volume g/m2 Forecast, by Product 2020 & 2033
- Table 37: Global Coated Fabrics Market Revenue billion Forecast, by Application 2020 & 2033
- Table 38: Global Coated Fabrics Market Volume g/m2 Forecast, by Application 2020 & 2033
- Table 39: Global Coated Fabrics Market Revenue billion Forecast, by Country 2020 & 2033
- Table 40: Global Coated Fabrics Market Volume g/m2 Forecast, by Country 2020 & 2033
- Table 41: Germany Coated Fabrics Market Revenue (billion) Forecast, by Application 2020 & 2033
- Table 42: Germany Coated Fabrics Market Volume (g/m2) Forecast, by Application 2020 & 2033
- Table 43: United Kingdom Coated Fabrics Market Revenue (billion) Forecast, by Application 2020 & 2033
- Table 44: United Kingdom Coated Fabrics Market Volume (g/m2) Forecast, by Application 2020 & 2033
- Table 45: Italy Coated Fabrics Market Revenue (billion) Forecast, by Application 2020 & 2033
- Table 46: Italy Coated Fabrics Market Volume (g/m2) Forecast, by Application 2020 & 2033
- Table 47: France Coated Fabrics Market Revenue (billion) Forecast, by Application 2020 & 2033
- Table 48: France Coated Fabrics Market Volume (g/m2) Forecast, by Application 2020 & 2033
- Table 49: Rest of Europe Coated Fabrics Market Revenue (billion) Forecast, by Application 2020 & 2033
- Table 50: Rest of Europe Coated Fabrics Market Volume (g/m2) Forecast, by Application 2020 & 2033
- Table 51: Global Coated Fabrics Market Revenue billion Forecast, by Product 2020 & 2033
- Table 52: Global Coated Fabrics Market Volume g/m2 Forecast, by Product 2020 & 2033
- Table 53: Global Coated Fabrics Market Revenue billion Forecast, by Application 2020 & 2033
- Table 54: Global Coated Fabrics Market Volume g/m2 Forecast, by Application 2020 & 2033
- Table 55: Global Coated Fabrics Market Revenue billion Forecast, by Country 2020 & 2033
- Table 56: Global Coated Fabrics Market Volume g/m2 Forecast, by Country 2020 & 2033
- Table 57: Brazil Coated Fabrics Market Revenue (billion) Forecast, by Application 2020 & 2033
- Table 58: Brazil Coated Fabrics Market Volume (g/m2) Forecast, by Application 2020 & 2033
- Table 59: Argentina Coated Fabrics Market Revenue (billion) Forecast, by Application 2020 & 2033
- Table 60: Argentina Coated Fabrics Market Volume (g/m2) Forecast, by Application 2020 & 2033
- Table 61: Rest of South America Coated Fabrics Market Revenue (billion) Forecast, by Application 2020 & 2033
- Table 62: Rest of South America Coated Fabrics Market Volume (g/m2) Forecast, by Application 2020 & 2033
- Table 63: Global Coated Fabrics Market Revenue billion Forecast, by Product 2020 & 2033
- Table 64: Global Coated Fabrics Market Volume g/m2 Forecast, by Product 2020 & 2033
- Table 65: Global Coated Fabrics Market Revenue billion Forecast, by Application 2020 & 2033
- Table 66: Global Coated Fabrics Market Volume g/m2 Forecast, by Application 2020 & 2033
- Table 67: Global Coated Fabrics Market Revenue billion Forecast, by Country 2020 & 2033
- Table 68: Global Coated Fabrics Market Volume g/m2 Forecast, by Country 2020 & 2033
- Table 69: Saudi Arabia Coated Fabrics Market Revenue (billion) Forecast, by Application 2020 & 2033
- Table 70: Saudi Arabia Coated Fabrics Market Volume (g/m2) Forecast, by Application 2020 & 2033
- Table 71: South Africa Coated Fabrics Market Revenue (billion) Forecast, by Application 2020 & 2033
- Table 72: South Africa Coated Fabrics Market Volume (g/m2) Forecast, by Application 2020 & 2033
- Table 73: Rest of Middle East and Africa Coated Fabrics Market Revenue (billion) Forecast, by Application 2020 & 2033
- Table 74: Rest of Middle East and Africa Coated Fabrics Market Volume (g/m2) Forecast, by Application 2020 & 2033
Frequently Asked Questions
1. What is the projected Compound Annual Growth Rate (CAGR) of the Coated Fabrics Market?
The projected CAGR is approximately 5.15%.
2. Which companies are prominent players in the Coated Fabrics Market?
Key companies in the market include Seamen Corporation, Mauritzon Inc, Saint-Gobain, Contitech AG, Spradling International Inc, BASF SE, Graniteville, Trelleborg AB, Regatta Professional, OMNOVA Solutions Inc.
3. What are the main segments of the Coated Fabrics Market?
The market segments include Product, Application.
4. Can you provide details about the market size?
The market size is estimated to be USD 24.67 billion as of 2022.
5. What are some drivers contributing to market growth?
Rising Demand for Protective Clothing; Other Drivers.
6. What are the notable trends driving market growth?
Increasing Demand form Automotive Sector.
7. Are there any restraints impacting market growth?
Environment Regulations Associated to Material Waste; Availibility of Substitute.
8. Can you provide examples of recent developments in the market?
July 2022: BASF collaborated with Vadodara-based membrane manufacturer Permionics Membranes to extend the use of BASF's Ultrason E polyethersulphone (PESU) polymer into coated fabrics that function as particulate and bacterial filters for face masks.
9. What pricing options are available for accessing the report?
Pricing options include single-user, multi-user, and enterprise licenses priced at USD 4750, USD 5250, and USD 8750 respectively.
10. Is the market size provided in terms of value or volume?
The market size is provided in terms of value, measured in billion and volume, measured in g/m2.
11. Are there any specific market keywords associated with the report?
Yes, the market keyword associated with the report is "Coated Fabrics Market," which aids in identifying and referencing the specific market segment covered.
12. How do I determine which pricing option suits my needs best?
The pricing options vary based on user requirements and access needs. Individual users may opt for single-user licenses, while businesses requiring broader access may choose multi-user or enterprise licenses for cost-effective access to the report.
13. Are there any additional resources or data provided in the Coated Fabrics Market report?
While the report offers comprehensive insights, it's advisable to review the specific contents or supplementary materials provided to ascertain if additional resources or data are available.
14. How can I stay updated on further developments or reports in the Coated Fabrics Market?
To stay informed about further developments, trends, and reports in the Coated Fabrics Market, consider subscribing to industry newsletters, following relevant companies and organizations, or regularly checking reputable industry news sources and publications.
Methodology
Step 1 - Identification of Relevant Samples Size from Population Database


Step 2 - Approaches for Defining Global Market Size (Value, Volume* & Price*)

Note*: In applicable scenarios
Step 3 - Data Sources
Primary Research
- Web Analytics
- Survey Reports
- Research Institute
- Latest Research Reports
- Opinion Leaders
Secondary Research
- Annual Reports
- White Paper
- Latest Press Release
- Industry Association
- Paid Database
- Investor Presentations

Step 4 - Data Triangulation
Involves using different sources of information in order to increase the validity of a study
These sources are likely to be stakeholders in a program - participants, other researchers, program staff, other community members, and so on.
Then we put all data in single framework & apply various statistical tools to find out the dynamic on the market.
During the analysis stage, feedback from the stakeholder groups would be compared to determine areas of agreement as well as areas of divergence