

Key Insights
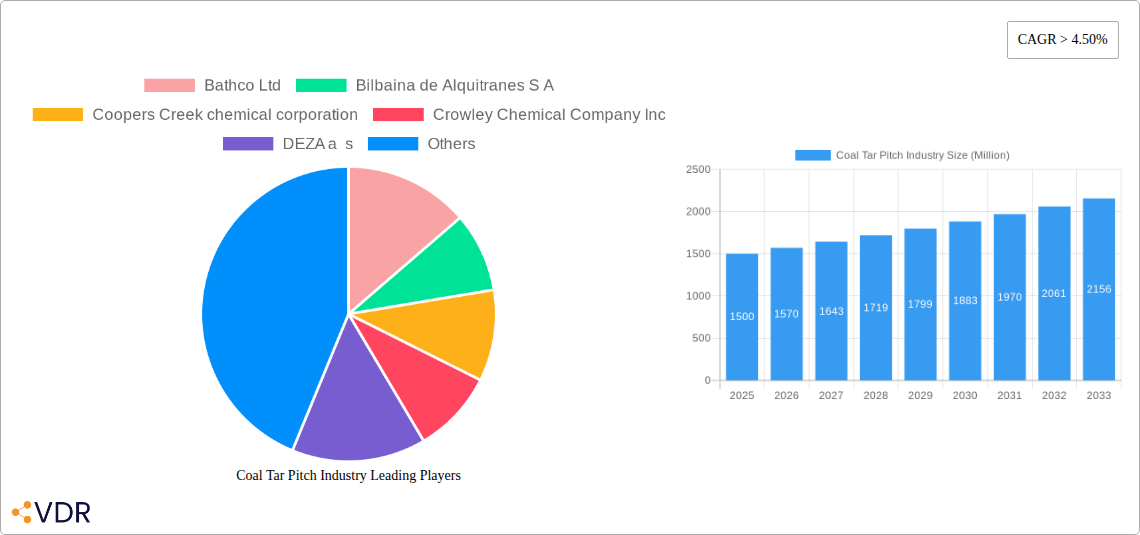
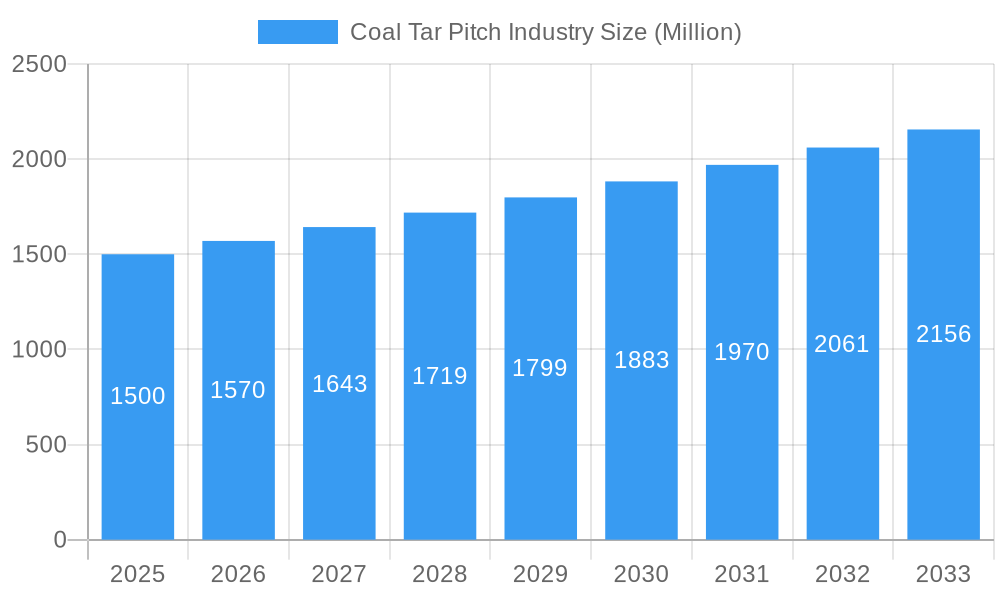
The Coal Tar Pitch market, currently valued at approximately $XX million (estimated based on the provided CAGR and market size), is projected to experience robust growth, exceeding a compound annual growth rate (CAGR) of 4.50% from 2025 to 2033. This expansion is driven primarily by the increasing demand for coal tar pitch in the production of carbon materials, particularly in the anode materials sector for lithium-ion batteries, a key component of the rapidly growing electric vehicle (EV) industry. Furthermore, its use in construction materials, particularly as a binder in asphalt and roofing applications, contributes significantly to market demand. However, environmental concerns surrounding coal tar pitch production and its potential health impacts pose a significant restraint, necessitating the development and adoption of more sustainable alternatives. Market segmentation reveals a varied landscape, with key players such as Bathco Ltd, Bilbaina de Alquitranes S.A., and Koppers Inc., competing across various geographical regions. The market's growth trajectory is closely linked to advancements in battery technology and the expansion of the global infrastructure sector.
Coal Tar Pitch Industry Market Size (In Billion)
Growth within the Coal Tar Pitch market is further segmented geographically, with regions exhibiting varied growth rates depending on industrial development and regulatory frameworks. North America and Europe are expected to maintain significant market share due to established industrial infrastructure and a high concentration of key players. However, rapidly industrializing economies in Asia-Pacific, specifically in China and India, are poised for substantial growth, driven by burgeoning construction and automotive sectors. Future market dynamics will hinge on technological innovation, leading to the development of more environmentally friendly production methods, coupled with stringent environmental regulations to mitigate potential negative impacts. The industry’s success will increasingly depend on adapting to sustainable manufacturing practices and the adoption of circular economy principles.
Coal Tar Pitch Industry Company Market Share
Coal Tar Pitch Industry Market Report: 2019-2033
This comprehensive report provides an in-depth analysis of the global Coal Tar Pitch industry, offering crucial insights for businesses, investors, and researchers. Covering the period 2019-2033, with a base year of 2025, this report meticulously examines market dynamics, growth trends, regional dominance, product landscapes, and key players. The report segments the market and analyzes its parent market (Coal Tar Derivatives) and child markets (e.g., Carbon Products, Electrode Manufacturing) for a holistic view. Expected market size values are presented in Million units.
Coal Tar Pitch Industry Market Dynamics & Structure
This section analyzes the competitive landscape, technological advancements, regulatory environment, and market trends within the Coal Tar Pitch industry. We explore market concentration, examining the market share held by key players like Rain Carbon Inc, Koppers Inc, and Mitsubishi Chemical Corporation. The report also quantifies M&A activity within the industry (xx deals in the historical period), identifying strategic partnerships and acquisitions driving market consolidation.
- Market Concentration: xx% market share held by top 5 players (2024).
- Technological Innovation: Analysis of R&D investments and innovative production methods impacting efficiency and cost.
- Regulatory Framework: Impact of environmental regulations and safety standards on market growth.
- Competitive Substitutes: Evaluation of alternative materials and their market penetration.
- End-User Demographics: Analysis of major industry sectors consuming Coal Tar Pitch (e.g., aluminum, carbon, and steel industries).
- M&A Trends: Detailed examination of merger and acquisition activities, including deal volumes and strategic rationale. (xx deals predicted for 2025-2033).
- Innovation Barriers: Discussion of challenges faced by companies in developing and implementing new technologies.
Coal Tar Pitch Industry Growth Trends & Insights
This section presents a detailed analysis of the Coal Tar Pitch market's growth trajectory from 2019 to 2033. Utilizing proprietary data and industry expertise, we project a CAGR of xx% during the forecast period (2025-2033), driven by factors such as [Specific factors driving growth, e.g., increasing demand from specific end-use sectors, technological advancements leading to improved efficiency]. We explore market size evolution, penetration rates across different sectors, and the influence of technological disruptions and changing consumer behaviors. The analysis incorporates quantitative data and qualitative insights to provide a comprehensive understanding of market growth dynamics. The historical period (2019-2024) shows a market size evolution from xx Million to xx Million.
Dominant Regions, Countries, or Segments in Coal Tar Pitch Industry
This section identifies the leading geographic regions and market segments driving global Coal Tar Pitch market growth. Analysis will reveal the dominant region (e.g., Asia-Pacific), highlighting key factors such as robust economic growth, expanding infrastructure projects, and favorable government policies that fuel demand. We delve into country-specific analysis, examining market share and growth potential in key markets.
- Key Growth Drivers (Region X):
- Strong economic growth and industrialization
- Favorable government policies and infrastructure development
- Increasing demand from key end-use industries
- Dominance Factors:
- High market share within the region
- Strong presence of key players and manufacturing facilities
- Favorable regulatory environment
Coal Tar Pitch Industry Product Landscape
The Coal Tar Pitch market offers a range of products with varying properties and applications. This section details product innovations, applications (e.g., electrodes, carbon fibers, coatings), and key performance metrics. We highlight the unique selling propositions and technological advancements driving product differentiation and market competitiveness. This section also looks at the different grades and specifications of Coal Tar Pitch and how these cater to different applications.
Key Drivers, Barriers & Challenges in Coal Tar Pitch Industry
This section identifies and analyzes the key factors influencing the growth and development of the Coal Tar Pitch industry.
Key Drivers:
- Growing demand from the aluminum industry.
- Expanding application in carbon products manufacturing.
- Technological advancements leading to improved product quality.
Key Barriers and Challenges:
- Fluctuations in raw material prices.
- Stringent environmental regulations.
- Intense competition from substitute materials.
- Supply chain disruptions (quantified impact on market growth xx%).
Emerging Opportunities in Coal Tar Pitch Industry
The Coal Tar Pitch industry presents several promising emerging opportunities. This section explores untapped market segments, innovative applications, and evolving consumer preferences that hold significant growth potential. We highlight opportunities arising from the increasing demand in developing economies and the exploration of new application areas within various industries.
Growth Accelerators in the Coal Tar Pitch Industry
Long-term growth in the Coal Tar Pitch industry will be fueled by technological breakthroughs in production processes, strategic partnerships to expand market reach, and successful market expansion strategies targeting high-growth regions. This will lead to cost reductions and enhanced product performance.
Key Players Shaping the Coal Tar Pitch Industry Market
- Bathco Ltd
- Bilbaina de Alquitranes S A
- Coopers Creek chemical corporation
- Crowley Chemical Company Inc
- DEZA a s
- Hengshui Zehao Chemicals Co Ltd
- Himadri Speciality Chemicals Ltd
- JFE Chemical Corporation
- Koppers Inc
- Mitsubishi Chemical Corporation
- Neptune Hydrocarbons Mfg Pvt Ltd
- Rain Carbon Inc
- Shandong Jiefuyi
- List Not Exhaustive
Notable Milestones in Coal Tar Pitch Industry Sector
- 2022 Q3: Launch of a new high-performance Coal Tar Pitch by Rain Carbon Inc.
- 2023 Q1: Acquisition of a Coal Tar Pitch producer by Koppers Inc.
- 2024 Q2: Introduction of stricter environmental regulations in Region X.
- Further milestones from Recent developments pertaining to the market studied will be covered in the final report.
In-Depth Coal Tar Pitch Industry Market Outlook
The Coal Tar Pitch industry is poised for continued growth over the forecast period. Technological innovations, coupled with expanding applications in various sectors, will drive market expansion. Strategic partnerships and acquisitions will reshape the competitive landscape. Focusing on sustainable practices and addressing environmental concerns will be crucial for long-term success. The market is projected to reach xx Million by 2033, presenting significant opportunities for existing and new players alike.
Coal Tar Pitch Industry Segmentation
-
1. Grade
- 1.1. Aluminium Grade
- 1.2. Binder and Impregnating Grade
- 1.3. Special Grade
-
2. Application
- 2.1. Aluminium Smelting
- 2.2. Graphite Electrodes
- 2.3. Roofing
- 2.4. Carbon Fiber
- 2.5. Refractories
- 2.6. Other Applications
Coal Tar Pitch Industry Segmentation By Geography
-
1. Asia Pacific
- 1.1. China
- 1.2. India
- 1.3. Japan
- 1.4. South Korea
- 1.5. Rest of Asia Pacific
-
2. North America
- 2.1. United States
- 2.2. Canada
- 2.3. Mexico
-
3. Europe
- 3.1. Germany
- 3.2. United Kingdom
- 3.3. France
- 3.4. Italy
- 3.5. Rest of Europe
-
4. South America
- 4.1. Brazil
- 4.2. Argentina
- 4.3. Rest of South America
-
5. Middle East and Africa
- 5.1. Saudi Arabia
- 5.2. South Africa
- 5.3. Rest of Middle East and Africa

Coal Tar Pitch Industry Regional Market Share
Geographic Coverage of Coal Tar Pitch Industry
Coal Tar Pitch Industry REPORT HIGHLIGHTS
| Aspects | Details |
|---|---|
| Study Period | 2020-2034 |
| Base Year | 2025 |
| Estimated Year | 2026 |
| Forecast Period | 2026-2034 |
| Historical Period | 2020-2025 |
| Growth Rate | CAGR of 5.5% from 2020-2034 |
| Segmentation |
|
Table of Contents
- 1. Introduction
- 1.1. Research Scope
- 1.2. Market Segmentation
- 1.3. Research Objective
- 1.4. Definitions and Assumptions
- 2. Executive Summary
- 2.1. Market Snapshot
- 3. Market Dynamics
- 3.1. Market Drivers
- 3.2. Market Restrains
- 3.3. Market Trends
- 3.4. Market Opportunities
- 4. Market Factor Analysis
- 4.1. Porters Five Forces
- 4.1.1. Bargaining Power of Suppliers
- 4.1.2. Bargaining Power of Buyers
- 4.1.3. Threat of New Entrants
- 4.1.4. Threat of Substitutes
- 4.1.5. Competitive Rivalry
- 4.2. PESTEL analysis
- 4.3. BCG Analysis
- 4.3.1. Stars (High Growth, High Market Share)
- 4.3.2. Cash Cows (Low Growth, High Market Share)
- 4.3.3. Question Mark (High Growth, Low Market Share)
- 4.3.4. Dogs (Low Growth, Low Market Share)
- 4.4. Ansoff Matrix Analysis
- 4.5. Supply Chain Analysis
- 4.6. Regulatory Landscape
- 4.7. Current Market Potential and Opportunity Assessment (TAM–SAM–SOM Framework)
- 4.8. VDR Analyst Note
- 4.1. Porters Five Forces
- 5. Market Analysis, Insights and Forecast 2021-2033
- 5.1. Market Analysis, Insights and Forecast - by Grade
- 5.1.1. Aluminium Grade
- 5.1.2. Binder and Impregnating Grade
- 5.1.3. Special Grade
- 5.2. Market Analysis, Insights and Forecast - by Application
- 5.2.1. Aluminium Smelting
- 5.2.2. Graphite Electrodes
- 5.2.3. Roofing
- 5.2.4. Carbon Fiber
- 5.2.5. Refractories
- 5.2.6. Other Applications
- 5.3. Market Analysis, Insights and Forecast - by Region
- 5.3.1. Asia Pacific
- 5.3.2. North America
- 5.3.3. Europe
- 5.3.4. South America
- 5.3.5. Middle East and Africa
- 5.1. Market Analysis, Insights and Forecast - by Grade
- 6. Global Coal Tar Pitch Industry Analysis, Insights and Forecast, 2021-2033
- 6.1. Market Analysis, Insights and Forecast - by Grade
- 6.1.1. Aluminium Grade
- 6.1.2. Binder and Impregnating Grade
- 6.1.3. Special Grade
- 6.2. Market Analysis, Insights and Forecast - by Application
- 6.2.1. Aluminium Smelting
- 6.2.2. Graphite Electrodes
- 6.2.3. Roofing
- 6.2.4. Carbon Fiber
- 6.2.5. Refractories
- 6.2.6. Other Applications
- 6.1. Market Analysis, Insights and Forecast - by Grade
- 7. Asia Pacific Coal Tar Pitch Industry Analysis, Insights and Forecast, 2021-2033
- 7.1. Market Analysis, Insights and Forecast - by Grade
- 7.1.1. Aluminium Grade
- 7.1.2. Binder and Impregnating Grade
- 7.1.3. Special Grade
- 7.2. Market Analysis, Insights and Forecast - by Application
- 7.2.1. Aluminium Smelting
- 7.2.2. Graphite Electrodes
- 7.2.3. Roofing
- 7.2.4. Carbon Fiber
- 7.2.5. Refractories
- 7.2.6. Other Applications
- 7.1. Market Analysis, Insights and Forecast - by Grade
- 8. North America Coal Tar Pitch Industry Analysis, Insights and Forecast, 2021-2033
- 8.1. Market Analysis, Insights and Forecast - by Grade
- 8.1.1. Aluminium Grade
- 8.1.2. Binder and Impregnating Grade
- 8.1.3. Special Grade
- 8.2. Market Analysis, Insights and Forecast - by Application
- 8.2.1. Aluminium Smelting
- 8.2.2. Graphite Electrodes
- 8.2.3. Roofing
- 8.2.4. Carbon Fiber
- 8.2.5. Refractories
- 8.2.6. Other Applications
- 8.1. Market Analysis, Insights and Forecast - by Grade
- 9. Europe Coal Tar Pitch Industry Analysis, Insights and Forecast, 2021-2033
- 9.1. Market Analysis, Insights and Forecast - by Grade
- 9.1.1. Aluminium Grade
- 9.1.2. Binder and Impregnating Grade
- 9.1.3. Special Grade
- 9.2. Market Analysis, Insights and Forecast - by Application
- 9.2.1. Aluminium Smelting
- 9.2.2. Graphite Electrodes
- 9.2.3. Roofing
- 9.2.4. Carbon Fiber
- 9.2.5. Refractories
- 9.2.6. Other Applications
- 9.1. Market Analysis, Insights and Forecast - by Grade
- 10. South America Coal Tar Pitch Industry Analysis, Insights and Forecast, 2021-2033
- 10.1. Market Analysis, Insights and Forecast - by Grade
- 10.1.1. Aluminium Grade
- 10.1.2. Binder and Impregnating Grade
- 10.1.3. Special Grade
- 10.2. Market Analysis, Insights and Forecast - by Application
- 10.2.1. Aluminium Smelting
- 10.2.2. Graphite Electrodes
- 10.2.3. Roofing
- 10.2.4. Carbon Fiber
- 10.2.5. Refractories
- 10.2.6. Other Applications
- 10.1. Market Analysis, Insights and Forecast - by Grade
- 11. Middle East and Africa Coal Tar Pitch Industry Analysis, Insights and Forecast, 2021-2033
- 11.1. Market Analysis, Insights and Forecast - by Grade
- 11.1.1. Aluminium Grade
- 11.1.2. Binder and Impregnating Grade
- 11.1.3. Special Grade
- 11.2. Market Analysis, Insights and Forecast - by Application
- 11.2.1. Aluminium Smelting
- 11.2.2. Graphite Electrodes
- 11.2.3. Roofing
- 11.2.4. Carbon Fiber
- 11.2.5. Refractories
- 11.2.6. Other Applications
- 11.1. Market Analysis, Insights and Forecast - by Grade
- 12. Competitive Analysis
- 12.1. Company Profiles
- 12.1.1 Bathco Ltd
- 12.1.1.1. Company Overview
- 12.1.1.2. Products
- 12.1.1.3. Company Financials
- 12.1.1.4. SWOT Analysis
- 12.1.2 Bilbaina de Alquitranes S A
- 12.1.2.1. Company Overview
- 12.1.2.2. Products
- 12.1.2.3. Company Financials
- 12.1.2.4. SWOT Analysis
- 12.1.3 Coopers Creek chemical corporation
- 12.1.3.1. Company Overview
- 12.1.3.2. Products
- 12.1.3.3. Company Financials
- 12.1.3.4. SWOT Analysis
- 12.1.4 Crowley Chemical Company Inc
- 12.1.4.1. Company Overview
- 12.1.4.2. Products
- 12.1.4.3. Company Financials
- 12.1.4.4. SWOT Analysis
- 12.1.5 DEZA a s
- 12.1.5.1. Company Overview
- 12.1.5.2. Products
- 12.1.5.3. Company Financials
- 12.1.5.4. SWOT Analysis
- 12.1.6 Hengshui Zehao Chemicals Co Ltd
- 12.1.6.1. Company Overview
- 12.1.6.2. Products
- 12.1.6.3. Company Financials
- 12.1.6.4. SWOT Analysis
- 12.1.7 Himadri Speciality Chemicals Ltd
- 12.1.7.1. Company Overview
- 12.1.7.2. Products
- 12.1.7.3. Company Financials
- 12.1.7.4. SWOT Analysis
- 12.1.8 JFE Chemical Corporation
- 12.1.8.1. Company Overview
- 12.1.8.2. Products
- 12.1.8.3. Company Financials
- 12.1.8.4. SWOT Analysis
- 12.1.9 Koppers Inc
- 12.1.9.1. Company Overview
- 12.1.9.2. Products
- 12.1.9.3. Company Financials
- 12.1.9.4. SWOT Analysis
- 12.1.10 Mitsubishi Chemical Corporation
- 12.1.10.1. Company Overview
- 12.1.10.2. Products
- 12.1.10.3. Company Financials
- 12.1.10.4. SWOT Analysis
- 12.1.11 Neptune Hydrocarbons Mfg Pvt Ltd
- 12.1.11.1. Company Overview
- 12.1.11.2. Products
- 12.1.11.3. Company Financials
- 12.1.11.4. SWOT Analysis
- 12.1.12 Rain Carbon Inc
- 12.1.12.1. Company Overview
- 12.1.12.2. Products
- 12.1.12.3. Company Financials
- 12.1.12.4. SWOT Analysis
- 12.1.13 Shandong Jiefuyi*List Not Exhaustive
- 12.1.13.1. Company Overview
- 12.1.13.2. Products
- 12.1.13.3. Company Financials
- 12.1.13.4. SWOT Analysis
- 12.1.1 Bathco Ltd
- 12.2. Market Entropy
- 12.2.1 Company's Key Areas Served
- 12.2.2 Recent Developments
- 12.3. Company Market Share Analysis 2025
- 12.3.1 Top 5 Companies Market Share Analysis
- 12.3.2 Top 3 Companies Market Share Analysis
- 12.4. List of Potential Customers
- 13. Research Methodology
List of Figures
- Figure 1: Global Coal Tar Pitch Industry Revenue Breakdown (billion, %) by Region 2025 & 2033
- Figure 2: Asia Pacific Coal Tar Pitch Industry Revenue (billion), by Grade 2025 & 2033
- Figure 3: Asia Pacific Coal Tar Pitch Industry Revenue Share (%), by Grade 2025 & 2033
- Figure 4: Asia Pacific Coal Tar Pitch Industry Revenue (billion), by Application 2025 & 2033
- Figure 5: Asia Pacific Coal Tar Pitch Industry Revenue Share (%), by Application 2025 & 2033
- Figure 6: Asia Pacific Coal Tar Pitch Industry Revenue (billion), by Country 2025 & 2033
- Figure 7: Asia Pacific Coal Tar Pitch Industry Revenue Share (%), by Country 2025 & 2033
- Figure 8: North America Coal Tar Pitch Industry Revenue (billion), by Grade 2025 & 2033
- Figure 9: North America Coal Tar Pitch Industry Revenue Share (%), by Grade 2025 & 2033
- Figure 10: North America Coal Tar Pitch Industry Revenue (billion), by Application 2025 & 2033
- Figure 11: North America Coal Tar Pitch Industry Revenue Share (%), by Application 2025 & 2033
- Figure 12: North America Coal Tar Pitch Industry Revenue (billion), by Country 2025 & 2033
- Figure 13: North America Coal Tar Pitch Industry Revenue Share (%), by Country 2025 & 2033
- Figure 14: Europe Coal Tar Pitch Industry Revenue (billion), by Grade 2025 & 2033
- Figure 15: Europe Coal Tar Pitch Industry Revenue Share (%), by Grade 2025 & 2033
- Figure 16: Europe Coal Tar Pitch Industry Revenue (billion), by Application 2025 & 2033
- Figure 17: Europe Coal Tar Pitch Industry Revenue Share (%), by Application 2025 & 2033
- Figure 18: Europe Coal Tar Pitch Industry Revenue (billion), by Country 2025 & 2033
- Figure 19: Europe Coal Tar Pitch Industry Revenue Share (%), by Country 2025 & 2033
- Figure 20: South America Coal Tar Pitch Industry Revenue (billion), by Grade 2025 & 2033
- Figure 21: South America Coal Tar Pitch Industry Revenue Share (%), by Grade 2025 & 2033
- Figure 22: South America Coal Tar Pitch Industry Revenue (billion), by Application 2025 & 2033
- Figure 23: South America Coal Tar Pitch Industry Revenue Share (%), by Application 2025 & 2033
- Figure 24: South America Coal Tar Pitch Industry Revenue (billion), by Country 2025 & 2033
- Figure 25: South America Coal Tar Pitch Industry Revenue Share (%), by Country 2025 & 2033
- Figure 26: Middle East and Africa Coal Tar Pitch Industry Revenue (billion), by Grade 2025 & 2033
- Figure 27: Middle East and Africa Coal Tar Pitch Industry Revenue Share (%), by Grade 2025 & 2033
- Figure 28: Middle East and Africa Coal Tar Pitch Industry Revenue (billion), by Application 2025 & 2033
- Figure 29: Middle East and Africa Coal Tar Pitch Industry Revenue Share (%), by Application 2025 & 2033
- Figure 30: Middle East and Africa Coal Tar Pitch Industry Revenue (billion), by Country 2025 & 2033
- Figure 31: Middle East and Africa Coal Tar Pitch Industry Revenue Share (%), by Country 2025 & 2033
List of Tables
- Table 1: Global Coal Tar Pitch Industry Revenue billion Forecast, by Grade 2020 & 2033
- Table 2: Global Coal Tar Pitch Industry Revenue billion Forecast, by Application 2020 & 2033
- Table 3: Global Coal Tar Pitch Industry Revenue billion Forecast, by Region 2020 & 2033
- Table 4: Global Coal Tar Pitch Industry Revenue billion Forecast, by Grade 2020 & 2033
- Table 5: Global Coal Tar Pitch Industry Revenue billion Forecast, by Application 2020 & 2033
- Table 6: Global Coal Tar Pitch Industry Revenue billion Forecast, by Country 2020 & 2033
- Table 7: China Coal Tar Pitch Industry Revenue (billion) Forecast, by Application 2020 & 2033
- Table 8: India Coal Tar Pitch Industry Revenue (billion) Forecast, by Application 2020 & 2033
- Table 9: Japan Coal Tar Pitch Industry Revenue (billion) Forecast, by Application 2020 & 2033
- Table 10: South Korea Coal Tar Pitch Industry Revenue (billion) Forecast, by Application 2020 & 2033
- Table 11: Rest of Asia Pacific Coal Tar Pitch Industry Revenue (billion) Forecast, by Application 2020 & 2033
- Table 12: Global Coal Tar Pitch Industry Revenue billion Forecast, by Grade 2020 & 2033
- Table 13: Global Coal Tar Pitch Industry Revenue billion Forecast, by Application 2020 & 2033
- Table 14: Global Coal Tar Pitch Industry Revenue billion Forecast, by Country 2020 & 2033
- Table 15: United States Coal Tar Pitch Industry Revenue (billion) Forecast, by Application 2020 & 2033
- Table 16: Canada Coal Tar Pitch Industry Revenue (billion) Forecast, by Application 2020 & 2033
- Table 17: Mexico Coal Tar Pitch Industry Revenue (billion) Forecast, by Application 2020 & 2033
- Table 18: Global Coal Tar Pitch Industry Revenue billion Forecast, by Grade 2020 & 2033
- Table 19: Global Coal Tar Pitch Industry Revenue billion Forecast, by Application 2020 & 2033
- Table 20: Global Coal Tar Pitch Industry Revenue billion Forecast, by Country 2020 & 2033
- Table 21: Germany Coal Tar Pitch Industry Revenue (billion) Forecast, by Application 2020 & 2033
- Table 22: United Kingdom Coal Tar Pitch Industry Revenue (billion) Forecast, by Application 2020 & 2033
- Table 23: France Coal Tar Pitch Industry Revenue (billion) Forecast, by Application 2020 & 2033
- Table 24: Italy Coal Tar Pitch Industry Revenue (billion) Forecast, by Application 2020 & 2033
- Table 25: Rest of Europe Coal Tar Pitch Industry Revenue (billion) Forecast, by Application 2020 & 2033
- Table 26: Global Coal Tar Pitch Industry Revenue billion Forecast, by Grade 2020 & 2033
- Table 27: Global Coal Tar Pitch Industry Revenue billion Forecast, by Application 2020 & 2033
- Table 28: Global Coal Tar Pitch Industry Revenue billion Forecast, by Country 2020 & 2033
- Table 29: Brazil Coal Tar Pitch Industry Revenue (billion) Forecast, by Application 2020 & 2033
- Table 30: Argentina Coal Tar Pitch Industry Revenue (billion) Forecast, by Application 2020 & 2033
- Table 31: Rest of South America Coal Tar Pitch Industry Revenue (billion) Forecast, by Application 2020 & 2033
- Table 32: Global Coal Tar Pitch Industry Revenue billion Forecast, by Grade 2020 & 2033
- Table 33: Global Coal Tar Pitch Industry Revenue billion Forecast, by Application 2020 & 2033
- Table 34: Global Coal Tar Pitch Industry Revenue billion Forecast, by Country 2020 & 2033
- Table 35: Saudi Arabia Coal Tar Pitch Industry Revenue (billion) Forecast, by Application 2020 & 2033
- Table 36: South Africa Coal Tar Pitch Industry Revenue (billion) Forecast, by Application 2020 & 2033
- Table 37: Rest of Middle East and Africa Coal Tar Pitch Industry Revenue (billion) Forecast, by Application 2020 & 2033
Frequently Asked Questions
1. What is the projected Compound Annual Growth Rate (CAGR) of the Coal Tar Pitch Industry?
The projected CAGR is approximately 5.5%.
2. Which companies are prominent players in the Coal Tar Pitch Industry?
Key companies in the market include Bathco Ltd, Bilbaina de Alquitranes S A, Coopers Creek chemical corporation, Crowley Chemical Company Inc, DEZA a s, Hengshui Zehao Chemicals Co Ltd, Himadri Speciality Chemicals Ltd, JFE Chemical Corporation, Koppers Inc, Mitsubishi Chemical Corporation, Neptune Hydrocarbons Mfg Pvt Ltd, Rain Carbon Inc, Shandong Jiefuyi*List Not Exhaustive.
3. What are the main segments of the Coal Tar Pitch Industry?
The market segments include Grade, Application.
4. Can you provide details about the market size?
The market size is estimated to be USD 4.4 billion as of 2022.
5. What are some drivers contributing to market growth?
Growing Demand for Aluminum from various Industries; Other Drivers.
6. What are the notable trends driving market growth?
Aluminum Smelting to Dominate the Market.
7. Are there any restraints impacting market growth?
Growing Demand for Aluminum from various Industries; Other Drivers.
8. Can you provide examples of recent developments in the market?
Recent developments pertaining to the market studied will be covered in the final report.
9. What pricing options are available for accessing the report?
Pricing options include single-user, multi-user, and enterprise licenses priced at USD 4750, USD 5250, and USD 8750 respectively.
10. Is the market size provided in terms of value or volume?
The market size is provided in terms of value, measured in billion.
11. Are there any specific market keywords associated with the report?
Yes, the market keyword associated with the report is "Coal Tar Pitch Industry," which aids in identifying and referencing the specific market segment covered.
12. How do I determine which pricing option suits my needs best?
The pricing options vary based on user requirements and access needs. Individual users may opt for single-user licenses, while businesses requiring broader access may choose multi-user or enterprise licenses for cost-effective access to the report.
13. Are there any additional resources or data provided in the Coal Tar Pitch Industry report?
While the report offers comprehensive insights, it's advisable to review the specific contents or supplementary materials provided to ascertain if additional resources or data are available.
14. How can I stay updated on further developments or reports in the Coal Tar Pitch Industry?
To stay informed about further developments, trends, and reports in the Coal Tar Pitch Industry, consider subscribing to industry newsletters, following relevant companies and organizations, or regularly checking reputable industry news sources and publications.
Methodology
Step 1 - Identification of Relevant Samples Size from Population Database


Step 2 - Approaches for Defining Global Market Size (Value, Volume* & Price*)

Note*: In applicable scenarios
Step 3 - Data Sources
Primary Research
- Web Analytics
- Survey Reports
- Research Institute
- Latest Research Reports
- Opinion Leaders
Secondary Research
- Annual Reports
- White Paper
- Latest Press Release
- Industry Association
- Paid Database
- Investor Presentations

Step 4 - Data Triangulation
Involves using different sources of information in order to increase the validity of a study
These sources are likely to be stakeholders in a program - participants, other researchers, program staff, other community members, and so on.
Then we put all data in single framework & apply various statistical tools to find out the dynamic on the market.
During the analysis stage, feedback from the stakeholder groups would be compared to determine areas of agreement as well as areas of divergence