Unveiling CNG Dispenser Industry Industry Trends

CNG Dispenser Industry by Production Analysis, by Consumption Analysis, by Import Market Analysis (Value & Volume), by Export Market Analysis (Value & Volume), by Price Trend Analysis, by North America, by Europe, by Asia Pacific, by South America, by Middle East and Africa Forecast 2025-2033

Jun 25 2025
Base Year: 2024

234 Pages
Main Logo

Unveiling CNG Dispenser Industry Industry Trends


Home
Industries
Energy & Power
sponsor image
sponsor image
sponsor image
sponsor image
sponsor image

Tailored for you

  • In-depth Analysis Tailored to Specified Regions or Segments
  • Company Profiles Customized to User Preferences
  • Comprehensive Insights Focused on Specific Segments or Regions
  • Customized Evaluation of Competitive Landscape to Meet Your Needs
  • Tailored Customization to Address Other Specific Requirements
Ask for customization


Key Insights

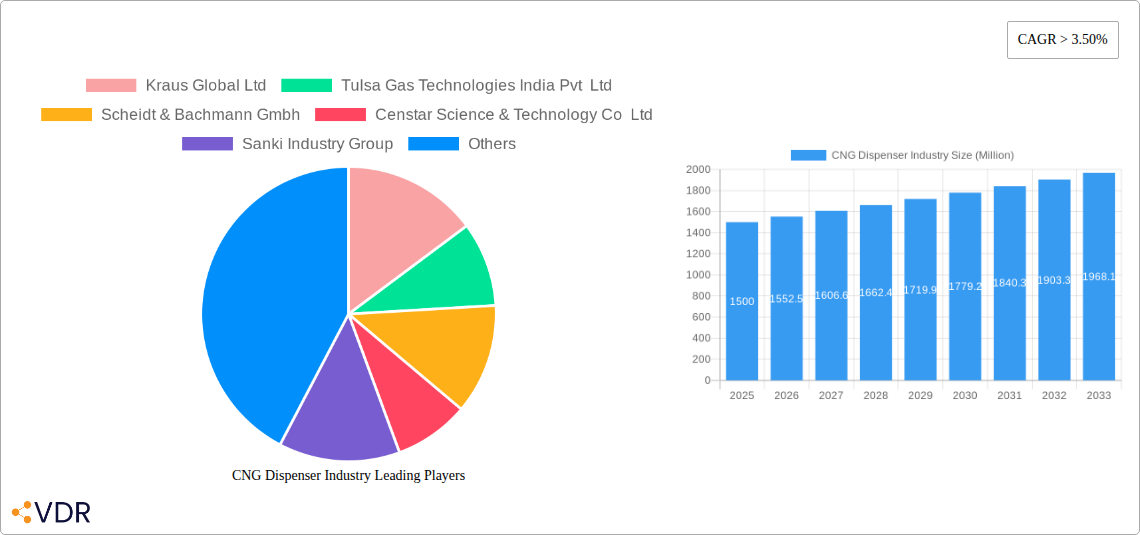
The CNG dispenser market is experiencing robust growth, driven by increasing environmental concerns and government regulations promoting cleaner fuel alternatives. The market's Compound Annual Growth Rate (CAGR) exceeding 3.50% signifies a consistent upward trajectory, projected to continue through 2033. Key market segments include pressure-based dispensers (low, medium, and high-pressure), flow rate classifications (low, medium, and high-flow), diverse applications spanning automotive, commercial vehicles, and power generation, and dispenser types (single, dual, and multi-hose). The substantial growth is fueled by expanding CNG infrastructure globally, particularly in regions like Asia-Pacific and North America, where governments are actively investing in CNG refueling stations to reduce carbon emissions and improve air quality. Furthermore, the rising adoption of CNG vehicles, especially in urban areas grappling with traffic congestion and pollution, significantly boosts demand for CNG dispensers. Leading market players, including Kraus Global Ltd, Tulsa Gas Technologies, and others, are actively engaged in technological advancements, such as developing more efficient and durable dispensers, contributing to the market's expansion.

The market's growth is not without challenges. High initial investment costs associated with establishing CNG refueling infrastructure remain a significant restraint, particularly in developing countries. Furthermore, the fluctuating price of natural gas and its competitiveness against other fuels, such as gasoline and diesel, could influence market growth. However, the long-term prospects remain positive, with continuous technological innovations and supportive government policies mitigating these challenges. The market segmentation highlights various opportunities for specialized products catering to specific application requirements. For instance, high-flow dispensers are likely to see increased demand in commercial vehicle refueling stations, while high-pressure dispensers will be crucial for applications demanding rapid refueling. Regional variations in growth rates will be influenced by government initiatives, economic conditions, and the existing transportation infrastructure in each area.

CNG Dispenser Industry Research Report - Market Size, Growth & Forecast

CNG Dispenser Industry Market Report: 2019-2033

This comprehensive report provides an in-depth analysis of the global CNG dispenser market, encompassing its current state, future trends, and key players. The study period spans 2019-2033, with 2025 serving as the base and estimated year. The report segments the market by pressure, flow rate, application, and type, offering granular insights for informed decision-making. The total market size is projected to reach xx Million units by 2033.

CNG Dispenser Industry Market Dynamics & Structure

The CNG dispenser market, valued at xx Million units in 2025, exhibits a moderately concentrated structure. Key players, including Kraus Global Ltd, Tulsa Gas Technologies India Pvt Ltd, Scheidt & Bachmann Gmbh, Censtar Science & Technology Co Ltd, Sanki Industry Group, Tatsuno Europe AS, Greka Engineering, FTI International Group Inc, Gilbarco Veeder Root, and Parker Hannifin Corp, hold significant market share, but the emergence of smaller, specialized players is also notable. Technological innovation, primarily focused on improving efficiency, safety, and durability, is a significant driver. Stringent regulatory frameworks concerning safety and environmental compliance influence market dynamics. The market faces competition from alternative fuel dispensing technologies but benefits from government incentives promoting CNG adoption.

  • Market Concentration: Moderately concentrated, with top 5 players holding approximately xx% market share in 2025.
  • Technological Innovation: Focus on advanced metering systems, remote diagnostics, and improved safety features.
  • Regulatory Framework: Stringent safety and environmental regulations drive innovation and market growth.
  • Competitive Substitutes: Competition from Electric Vehicle (EV) charging infrastructure and other alternative fuel dispensers.
  • M&A Activity: xx M&A deals recorded between 2019-2024, indicating consolidation within the industry. Further consolidation is anticipated.
  • Innovation Barriers: High initial investment costs and the need for specialized expertise.

CNG Dispenser Industry Growth Trends & Insights

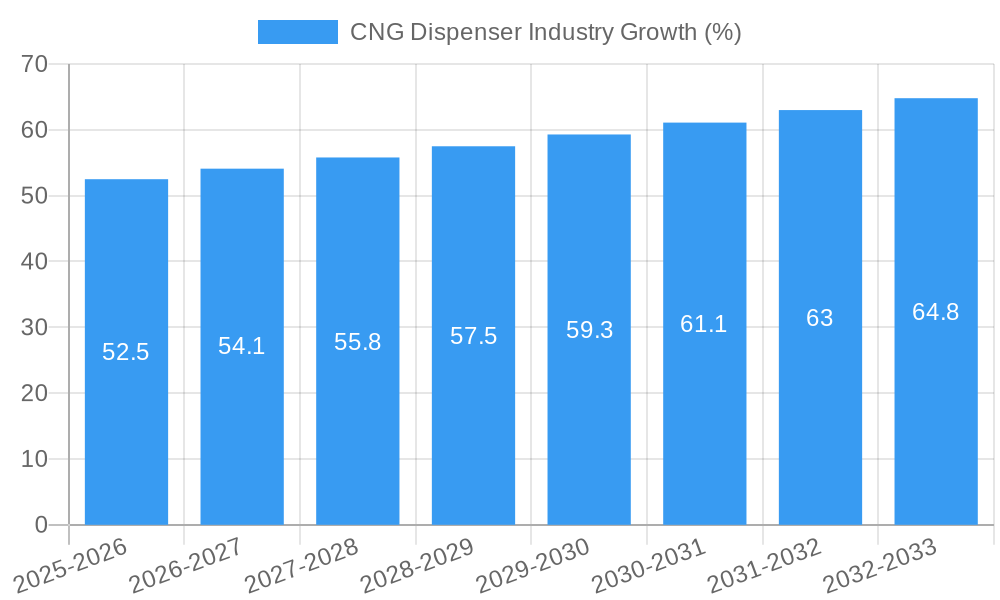
The CNG dispenser market experienced a CAGR of xx% during the historical period (2019-2024), driven by rising CNG vehicle adoption, particularly in the automotive and commercial vehicle sectors. Government initiatives promoting CNG as a cleaner fuel source have significantly accelerated market growth. The forecast period (2025-2033) anticipates continued growth, with a projected CAGR of xx%, fueled by expanding infrastructure, increasing awareness of environmental concerns, and ongoing technological advancements. Market penetration, currently at xx%, is expected to rise to xx% by 2033. Technological disruptions, such as the integration of smart technologies and improved data analytics, further contribute to market expansion. Consumer behavior shifts toward environmentally friendly transportation choices are also bolstering demand.

CNG Dispenser Industry Growth

Dominant Regions, Countries, or Segments in CNG Dispenser Industry

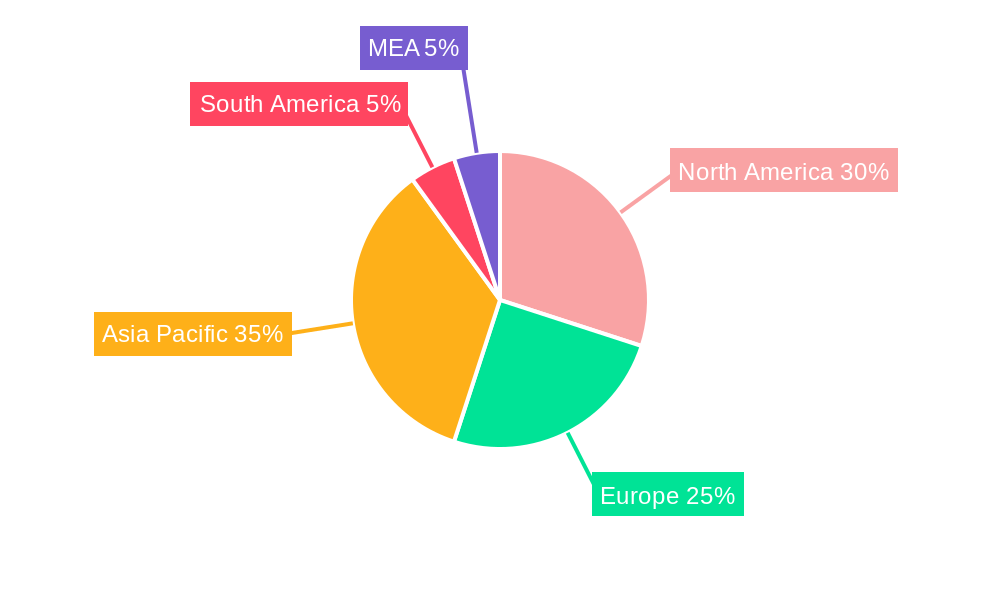
The Asia-Pacific region is expected to dominate the CNG dispenser market throughout the forecast period, driven by strong government support for CNG infrastructure development in countries like India and China. Within segments, the high-pressure dispenser segment is projected to experience the highest growth, followed by the automotive application segment. The medium-flow rate dispensers hold significant market share.

  • Key Drivers (Asia-Pacific): Government policies promoting CNG adoption, growing vehicle population, and expanding CNG fueling infrastructure.
  • Dominance Factors: Large market size, significant government investment, and increasing environmental awareness.
  • Growth Potential: Untapped markets in developing economies within the region.
  • Other Regions: Europe and North America are also showing moderate growth, driven by government regulations and environmental concerns.

CNG Dispenser Industry Product Landscape

CNG dispensers are evolving beyond basic functionalities, integrating advanced features such as electronic flow meters, remote monitoring systems, and enhanced safety mechanisms. Product innovation focuses on improving accuracy, efficiency, and user experience. Unique selling propositions often center on improved durability, ease of maintenance, and cost-effectiveness. Technological advancements emphasize integration with smart grids and improved data analytics capabilities for optimized performance and reduced operational costs.

Key Drivers, Barriers & Challenges in CNG Dispenser Industry

Key Drivers: Growing adoption of CNG vehicles, government incentives and subsidies, increasing environmental concerns, and expanding CNG refueling infrastructure are primary drivers.

Challenges: High initial investment costs for infrastructure development, potential supply chain disruptions due to component shortages, stringent safety regulations that can increase compliance costs, and intense competition from other fuel dispensing technologies pose significant challenges. These challenges can significantly impact market growth, possibly reducing the CAGR by xx% in some scenarios.

Emerging Opportunities in CNG Dispenser Industry

Untapped markets in developing economies, particularly in Africa and South America, represent significant opportunities. The integration of CNG dispensers with renewable energy sources and smart city initiatives also offers substantial potential. The development of multi-fuel dispensers catering to both CNG and other alternative fuels presents a lucrative opportunity for market expansion.

Growth Accelerators in the CNG Dispenser Industry

Technological breakthroughs such as improved compressor technology, more efficient dispensing systems, and enhanced safety features significantly accelerate market growth. Strategic partnerships between manufacturers, infrastructure developers, and government agencies facilitate market expansion. Market expansion into new geographical regions and the diversification of product offerings contribute significantly to long-term growth prospects.

Key Players Shaping the CNG Dispenser Industry Market

  • Kraus Global Ltd
  • Tulsa Gas Technologies India Pvt Ltd
  • Scheidt & Bachmann Gmbh
  • Censtar Science & Technology Co Ltd
  • Sanki Industry Group
  • Tatsuno Europe AS
  • Greka Engineering
  • FTI International Group Inc
  • Gilbarco Veeder-Root
  • Parker Hannifin Corp

Notable Milestones in CNG Dispenser Industry Sector

  • 2020: Introduction of a new high-pressure dispenser model with enhanced safety features by Kraus Global Ltd.
  • 2022: Strategic partnership between Tulsa Gas Technologies and a major CNG vehicle manufacturer.
  • 2023: Acquisition of a smaller CNG dispenser company by Scheidt & Bachmann Gmbh, expanding their market reach.
  • 2024: Launch of a smart CNG dispenser with remote monitoring capabilities by Censtar Science & Technology.

In-Depth CNG Dispenser Industry Market Outlook

The CNG dispenser market is poised for sustained growth, driven by continuous technological advancements, favorable government policies, and rising environmental awareness. Strategic partnerships, investments in research and development, and the expansion into emerging markets represent significant strategic opportunities for industry participants. The market is expected to witness considerable innovation and expansion in the coming years, shaping a more sustainable and efficient transportation landscape.

CNG Dispenser Industry Segmentation

  • 1. Production Analysis
  • 2. Consumption Analysis
  • 3. Import Market Analysis (Value & Volume)
  • 4. Export Market Analysis (Value & Volume)
  • 5. Price Trend Analysis

CNG Dispenser Industry Segmentation By Geography

  • 1. North America
  • 2. Europe
  • 3. Asia Pacific
  • 4. South America
  • 5. Middle East and Africa
CNG Dispenser Industry Regional Share


CNG Dispenser Industry REPORT HIGHLIGHTS

AspectsDetails
Study Period 2019-2033
Base Year 2024
Estimated Year 2025
Forecast Period2025-2033
Historical Period2019-2024
Growth RateCAGR of > 3.50% from 2019-2033
Segmentation
    • By Production Analysis
    • By Consumption Analysis
    • By Import Market Analysis (Value & Volume)
    • By Export Market Analysis (Value & Volume)
    • By Price Trend Analysis
  • By Geography
    • North America
    • Europe
    • Asia Pacific
    • South America
    • Middle East and Africa


Table of Contents

  1. 1. Introduction
    • 1.1. Research Scope
    • 1.2. Market Segmentation
    • 1.3. Research Methodology
    • 1.4. Definitions and Assumptions
  2. 2. Executive Summary
    • 2.1. Introduction
  3. 3. Market Dynamics
    • 3.1. Introduction
      • 3.2. Market Drivers
        • 3.2.1. 4.; Corporate Sustainability Goals4.; Stringent Regultions and Compliance
      • 3.3. Market Restrains
        • 3.3.1. 4.; High Complexity in Carbon Accounting
      • 3.4. Market Trends
        • 3.4.1. Increasing Number of CNG Vehicles to Drive the Market
  4. 4. Market Factor Analysis
    • 4.1. Porters Five Forces
    • 4.2. Supply/Value Chain
    • 4.3. PESTEL analysis
    • 4.4. Market Entropy
    • 4.5. Patent/Trademark Analysis
  5. 5. Global CNG Dispenser Industry Analysis, Insights and Forecast, 2019-2031
    • 5.1. Market Analysis, Insights and Forecast - by Production Analysis
      • 5.2. Market Analysis, Insights and Forecast - by Consumption Analysis
        • 5.3. Market Analysis, Insights and Forecast - by Import Market Analysis (Value & Volume)
          • 5.4. Market Analysis, Insights and Forecast - by Export Market Analysis (Value & Volume)
            • 5.5. Market Analysis, Insights and Forecast - by Price Trend Analysis
              • 5.6. Market Analysis, Insights and Forecast - by Region
                • 5.6.1. North America
                • 5.6.2. Europe
                • 5.6.3. Asia Pacific
                • 5.6.4. South America
                • 5.6.5. Middle East and Africa
            • 6. North America CNG Dispenser Industry Analysis, Insights and Forecast, 2019-2031
              • 6.1. Market Analysis, Insights and Forecast - by Production Analysis
                • 6.2. Market Analysis, Insights and Forecast - by Consumption Analysis
                  • 6.3. Market Analysis, Insights and Forecast - by Import Market Analysis (Value & Volume)
                    • 6.4. Market Analysis, Insights and Forecast - by Export Market Analysis (Value & Volume)
                      • 6.5. Market Analysis, Insights and Forecast - by Price Trend Analysis
                      • 7. Europe CNG Dispenser Industry Analysis, Insights and Forecast, 2019-2031
                        • 7.1. Market Analysis, Insights and Forecast - by Production Analysis
                          • 7.2. Market Analysis, Insights and Forecast - by Consumption Analysis
                            • 7.3. Market Analysis, Insights and Forecast - by Import Market Analysis (Value & Volume)
                              • 7.4. Market Analysis, Insights and Forecast - by Export Market Analysis (Value & Volume)
                                • 7.5. Market Analysis, Insights and Forecast - by Price Trend Analysis
                                • 8. Asia Pacific CNG Dispenser Industry Analysis, Insights and Forecast, 2019-2031
                                  • 8.1. Market Analysis, Insights and Forecast - by Production Analysis
                                    • 8.2. Market Analysis, Insights and Forecast - by Consumption Analysis
                                      • 8.3. Market Analysis, Insights and Forecast - by Import Market Analysis (Value & Volume)
                                        • 8.4. Market Analysis, Insights and Forecast - by Export Market Analysis (Value & Volume)
                                          • 8.5. Market Analysis, Insights and Forecast - by Price Trend Analysis
                                          • 9. South America CNG Dispenser Industry Analysis, Insights and Forecast, 2019-2031
                                            • 9.1. Market Analysis, Insights and Forecast - by Production Analysis
                                              • 9.2. Market Analysis, Insights and Forecast - by Consumption Analysis
                                                • 9.3. Market Analysis, Insights and Forecast - by Import Market Analysis (Value & Volume)
                                                  • 9.4. Market Analysis, Insights and Forecast - by Export Market Analysis (Value & Volume)
                                                    • 9.5. Market Analysis, Insights and Forecast - by Price Trend Analysis
                                                    • 10. Middle East and Africa CNG Dispenser Industry Analysis, Insights and Forecast, 2019-2031
                                                      • 10.1. Market Analysis, Insights and Forecast - by Production Analysis
                                                        • 10.2. Market Analysis, Insights and Forecast - by Consumption Analysis
                                                          • 10.3. Market Analysis, Insights and Forecast - by Import Market Analysis (Value & Volume)
                                                            • 10.4. Market Analysis, Insights and Forecast - by Export Market Analysis (Value & Volume)
                                                              • 10.5. Market Analysis, Insights and Forecast - by Price Trend Analysis
                                                              • 11. North America CNG Dispenser Industry Analysis, Insights and Forecast, 2019-2031
                                                                  • 11.1. Market Analysis, Insights and Forecast - By Country/Sub-region
                                                                    • 11.1.1 United States
                                                                    • 11.1.2 Canada
                                                                    • 11.1.3 Mexico
                                                              • 12. Europe CNG Dispenser Industry Analysis, Insights and Forecast, 2019-2031
                                                                  • 12.1. Market Analysis, Insights and Forecast - By Country/Sub-region
                                                                    • 12.1.1 Germany
                                                                    • 12.1.2 United Kingdom
                                                                    • 12.1.3 France
                                                                    • 12.1.4 Spain
                                                                    • 12.1.5 Italy
                                                                    • 12.1.6 Spain
                                                                    • 12.1.7 Belgium
                                                                    • 12.1.8 Netherland
                                                                    • 12.1.9 Nordics
                                                                    • 12.1.10 Rest of Europe
                                                              • 13. Asia Pacific CNG Dispenser Industry Analysis, Insights and Forecast, 2019-2031
                                                                  • 13.1. Market Analysis, Insights and Forecast - By Country/Sub-region
                                                                    • 13.1.1 China
                                                                    • 13.1.2 Japan
                                                                    • 13.1.3 India
                                                                    • 13.1.4 South Korea
                                                                    • 13.1.5 Southeast Asia
                                                                    • 13.1.6 Australia
                                                                    • 13.1.7 Indonesia
                                                                    • 13.1.8 Phillipes
                                                                    • 13.1.9 Singapore
                                                                    • 13.1.10 Thailandc
                                                                    • 13.1.11 Rest of Asia Pacific
                                                              • 14. South America CNG Dispenser Industry Analysis, Insights and Forecast, 2019-2031
                                                                  • 14.1. Market Analysis, Insights and Forecast - By Country/Sub-region
                                                                    • 14.1.1 Brazil
                                                                    • 14.1.2 Argentina
                                                                    • 14.1.3 Peru
                                                                    • 14.1.4 Chile
                                                                    • 14.1.5 Colombia
                                                                    • 14.1.6 Ecuador
                                                                    • 14.1.7 Venezuela
                                                                    • 14.1.8 Rest of South America
                                                              • 15. MEA CNG Dispenser Industry Analysis, Insights and Forecast, 2019-2031
                                                                  • 15.1. Market Analysis, Insights and Forecast - By Country/Sub-region
                                                                    • 15.1.1 United Arab Emirates
                                                                    • 15.1.2 Saudi Arabia
                                                                    • 15.1.3 South Africa
                                                                    • 15.1.4 Rest of Middle East and Africa
                                                              • 16. Competitive Analysis
                                                                • 16.1. Global Market Share Analysis 2024
                                                                  • 16.2. Company Profiles
                                                                    • 16.2.1 Kraus Global Ltd
                                                                      • 16.2.1.1. Overview
                                                                      • 16.2.1.2. Products
                                                                      • 16.2.1.3. SWOT Analysis
                                                                      • 16.2.1.4. Recent Developments
                                                                      • 16.2.1.5. Financials (Based on Availability)
                                                                    • 16.2.2 Tulsa Gas Technologies India Pvt Ltd
                                                                      • 16.2.2.1. Overview
                                                                      • 16.2.2.2. Products
                                                                      • 16.2.2.3. SWOT Analysis
                                                                      • 16.2.2.4. Recent Developments
                                                                      • 16.2.2.5. Financials (Based on Availability)
                                                                    • 16.2.3 Scheidt & Bachmann Gmbh
                                                                      • 16.2.3.1. Overview
                                                                      • 16.2.3.2. Products
                                                                      • 16.2.3.3. SWOT Analysis
                                                                      • 16.2.3.4. Recent Developments
                                                                      • 16.2.3.5. Financials (Based on Availability)
                                                                    • 16.2.4 Censtar Science & Technology Co Ltd
                                                                      • 16.2.4.1. Overview
                                                                      • 16.2.4.2. Products
                                                                      • 16.2.4.3. SWOT Analysis
                                                                      • 16.2.4.4. Recent Developments
                                                                      • 16.2.4.5. Financials (Based on Availability)
                                                                    • 16.2.5 Sanki Industry Group
                                                                      • 16.2.5.1. Overview
                                                                      • 16.2.5.2. Products
                                                                      • 16.2.5.3. SWOT Analysis
                                                                      • 16.2.5.4. Recent Developments
                                                                      • 16.2.5.5. Financials (Based on Availability)
                                                                    • 16.2.6 Tatsuno Europe AS
                                                                      • 16.2.6.1. Overview
                                                                      • 16.2.6.2. Products
                                                                      • 16.2.6.3. SWOT Analysis
                                                                      • 16.2.6.4. Recent Developments
                                                                      • 16.2.6.5. Financials (Based on Availability)
                                                                    • 16.2.7 Greka Engineering
                                                                      • 16.2.7.1. Overview
                                                                      • 16.2.7.2. Products
                                                                      • 16.2.7.3. SWOT Analysis
                                                                      • 16.2.7.4. Recent Developments
                                                                      • 16.2.7.5. Financials (Based on Availability)
                                                                    • 16.2.8 FTI International Group Inc
                                                                      • 16.2.8.1. Overview
                                                                      • 16.2.8.2. Products
                                                                      • 16.2.8.3. SWOT Analysis
                                                                      • 16.2.8.4. Recent Developments
                                                                      • 16.2.8.5. Financials (Based on Availability)
                                                                    • 16.2.9 Gilbarco Veeder Root
                                                                      • 16.2.9.1. Overview
                                                                      • 16.2.9.2. Products
                                                                      • 16.2.9.3. SWOT Analysis
                                                                      • 16.2.9.4. Recent Developments
                                                                      • 16.2.9.5. Financials (Based on Availability)
                                                                    • 16.2.10 Parker Hannifin Corp
                                                                      • 16.2.10.1. Overview
                                                                      • 16.2.10.2. Products
                                                                      • 16.2.10.3. SWOT Analysis
                                                                      • 16.2.10.4. Recent Developments
                                                                      • 16.2.10.5. Financials (Based on Availability)

                                                              List of Figures

                                                              1. Figure 1: Global CNG Dispenser Industry Revenue Breakdown (Million, %) by Region 2024 & 2032
                                                              2. Figure 2: Global CNG Dispenser Industry Volume Breakdown (K Unit, %) by Region 2024 & 2032
                                                              3. Figure 3: North America CNG Dispenser Industry Revenue (Million), by Country 2024 & 2032
                                                              4. Figure 4: North America CNG Dispenser Industry Volume (K Unit), by Country 2024 & 2032
                                                              5. Figure 5: North America CNG Dispenser Industry Revenue Share (%), by Country 2024 & 2032
                                                              6. Figure 6: North America CNG Dispenser Industry Volume Share (%), by Country 2024 & 2032
                                                              7. Figure 7: Europe CNG Dispenser Industry Revenue (Million), by Country 2024 & 2032
                                                              8. Figure 8: Europe CNG Dispenser Industry Volume (K Unit), by Country 2024 & 2032
                                                              9. Figure 9: Europe CNG Dispenser Industry Revenue Share (%), by Country 2024 & 2032
                                                              10. Figure 10: Europe CNG Dispenser Industry Volume Share (%), by Country 2024 & 2032
                                                              11. Figure 11: Asia Pacific CNG Dispenser Industry Revenue (Million), by Country 2024 & 2032
                                                              12. Figure 12: Asia Pacific CNG Dispenser Industry Volume (K Unit), by Country 2024 & 2032
                                                              13. Figure 13: Asia Pacific CNG Dispenser Industry Revenue Share (%), by Country 2024 & 2032
                                                              14. Figure 14: Asia Pacific CNG Dispenser Industry Volume Share (%), by Country 2024 & 2032
                                                              15. Figure 15: South America CNG Dispenser Industry Revenue (Million), by Country 2024 & 2032
                                                              16. Figure 16: South America CNG Dispenser Industry Volume (K Unit), by Country 2024 & 2032
                                                              17. Figure 17: South America CNG Dispenser Industry Revenue Share (%), by Country 2024 & 2032
                                                              18. Figure 18: South America CNG Dispenser Industry Volume Share (%), by Country 2024 & 2032
                                                              19. Figure 19: MEA CNG Dispenser Industry Revenue (Million), by Country 2024 & 2032
                                                              20. Figure 20: MEA CNG Dispenser Industry Volume (K Unit), by Country 2024 & 2032
                                                              21. Figure 21: MEA CNG Dispenser Industry Revenue Share (%), by Country 2024 & 2032
                                                              22. Figure 22: MEA CNG Dispenser Industry Volume Share (%), by Country 2024 & 2032
                                                              23. Figure 23: North America CNG Dispenser Industry Revenue (Million), by Production Analysis 2024 & 2032
                                                              24. Figure 24: North America CNG Dispenser Industry Volume (K Unit), by Production Analysis 2024 & 2032
                                                              25. Figure 25: North America CNG Dispenser Industry Revenue Share (%), by Production Analysis 2024 & 2032
                                                              26. Figure 26: North America CNG Dispenser Industry Volume Share (%), by Production Analysis 2024 & 2032
                                                              27. Figure 27: North America CNG Dispenser Industry Revenue (Million), by Consumption Analysis 2024 & 2032
                                                              28. Figure 28: North America CNG Dispenser Industry Volume (K Unit), by Consumption Analysis 2024 & 2032
                                                              29. Figure 29: North America CNG Dispenser Industry Revenue Share (%), by Consumption Analysis 2024 & 2032
                                                              30. Figure 30: North America CNG Dispenser Industry Volume Share (%), by Consumption Analysis 2024 & 2032
                                                              31. Figure 31: North America CNG Dispenser Industry Revenue (Million), by Import Market Analysis (Value & Volume) 2024 & 2032
                                                              32. Figure 32: North America CNG Dispenser Industry Volume (K Unit), by Import Market Analysis (Value & Volume) 2024 & 2032
                                                              33. Figure 33: North America CNG Dispenser Industry Revenue Share (%), by Import Market Analysis (Value & Volume) 2024 & 2032
                                                              34. Figure 34: North America CNG Dispenser Industry Volume Share (%), by Import Market Analysis (Value & Volume) 2024 & 2032
                                                              35. Figure 35: North America CNG Dispenser Industry Revenue (Million), by Export Market Analysis (Value & Volume) 2024 & 2032
                                                              36. Figure 36: North America CNG Dispenser Industry Volume (K Unit), by Export Market Analysis (Value & Volume) 2024 & 2032
                                                              37. Figure 37: North America CNG Dispenser Industry Revenue Share (%), by Export Market Analysis (Value & Volume) 2024 & 2032
                                                              38. Figure 38: North America CNG Dispenser Industry Volume Share (%), by Export Market Analysis (Value & Volume) 2024 & 2032
                                                              39. Figure 39: North America CNG Dispenser Industry Revenue (Million), by Price Trend Analysis 2024 & 2032
                                                              40. Figure 40: North America CNG Dispenser Industry Volume (K Unit), by Price Trend Analysis 2024 & 2032
                                                              41. Figure 41: North America CNG Dispenser Industry Revenue Share (%), by Price Trend Analysis 2024 & 2032
                                                              42. Figure 42: North America CNG Dispenser Industry Volume Share (%), by Price Trend Analysis 2024 & 2032
                                                              43. Figure 43: North America CNG Dispenser Industry Revenue (Million), by Country 2024 & 2032
                                                              44. Figure 44: North America CNG Dispenser Industry Volume (K Unit), by Country 2024 & 2032
                                                              45. Figure 45: North America CNG Dispenser Industry Revenue Share (%), by Country 2024 & 2032
                                                              46. Figure 46: North America CNG Dispenser Industry Volume Share (%), by Country 2024 & 2032
                                                              47. Figure 47: Europe CNG Dispenser Industry Revenue (Million), by Production Analysis 2024 & 2032
                                                              48. Figure 48: Europe CNG Dispenser Industry Volume (K Unit), by Production Analysis 2024 & 2032
                                                              49. Figure 49: Europe CNG Dispenser Industry Revenue Share (%), by Production Analysis 2024 & 2032
                                                              50. Figure 50: Europe CNG Dispenser Industry Volume Share (%), by Production Analysis 2024 & 2032
                                                              51. Figure 51: Europe CNG Dispenser Industry Revenue (Million), by Consumption Analysis 2024 & 2032
                                                              52. Figure 52: Europe CNG Dispenser Industry Volume (K Unit), by Consumption Analysis 2024 & 2032
                                                              53. Figure 53: Europe CNG Dispenser Industry Revenue Share (%), by Consumption Analysis 2024 & 2032
                                                              54. Figure 54: Europe CNG Dispenser Industry Volume Share (%), by Consumption Analysis 2024 & 2032
                                                              55. Figure 55: Europe CNG Dispenser Industry Revenue (Million), by Import Market Analysis (Value & Volume) 2024 & 2032
                                                              56. Figure 56: Europe CNG Dispenser Industry Volume (K Unit), by Import Market Analysis (Value & Volume) 2024 & 2032
                                                              57. Figure 57: Europe CNG Dispenser Industry Revenue Share (%), by Import Market Analysis (Value & Volume) 2024 & 2032
                                                              58. Figure 58: Europe CNG Dispenser Industry Volume Share (%), by Import Market Analysis (Value & Volume) 2024 & 2032
                                                              59. Figure 59: Europe CNG Dispenser Industry Revenue (Million), by Export Market Analysis (Value & Volume) 2024 & 2032
                                                              60. Figure 60: Europe CNG Dispenser Industry Volume (K Unit), by Export Market Analysis (Value & Volume) 2024 & 2032
                                                              61. Figure 61: Europe CNG Dispenser Industry Revenue Share (%), by Export Market Analysis (Value & Volume) 2024 & 2032
                                                              62. Figure 62: Europe CNG Dispenser Industry Volume Share (%), by Export Market Analysis (Value & Volume) 2024 & 2032
                                                              63. Figure 63: Europe CNG Dispenser Industry Revenue (Million), by Price Trend Analysis 2024 & 2032
                                                              64. Figure 64: Europe CNG Dispenser Industry Volume (K Unit), by Price Trend Analysis 2024 & 2032
                                                              65. Figure 65: Europe CNG Dispenser Industry Revenue Share (%), by Price Trend Analysis 2024 & 2032
                                                              66. Figure 66: Europe CNG Dispenser Industry Volume Share (%), by Price Trend Analysis 2024 & 2032
                                                              67. Figure 67: Europe CNG Dispenser Industry Revenue (Million), by Country 2024 & 2032
                                                              68. Figure 68: Europe CNG Dispenser Industry Volume (K Unit), by Country 2024 & 2032
                                                              69. Figure 69: Europe CNG Dispenser Industry Revenue Share (%), by Country 2024 & 2032
                                                              70. Figure 70: Europe CNG Dispenser Industry Volume Share (%), by Country 2024 & 2032
                                                              71. Figure 71: Asia Pacific CNG Dispenser Industry Revenue (Million), by Production Analysis 2024 & 2032
                                                              72. Figure 72: Asia Pacific CNG Dispenser Industry Volume (K Unit), by Production Analysis 2024 & 2032
                                                              73. Figure 73: Asia Pacific CNG Dispenser Industry Revenue Share (%), by Production Analysis 2024 & 2032
                                                              74. Figure 74: Asia Pacific CNG Dispenser Industry Volume Share (%), by Production Analysis 2024 & 2032
                                                              75. Figure 75: Asia Pacific CNG Dispenser Industry Revenue (Million), by Consumption Analysis 2024 & 2032
                                                              76. Figure 76: Asia Pacific CNG Dispenser Industry Volume (K Unit), by Consumption Analysis 2024 & 2032
                                                              77. Figure 77: Asia Pacific CNG Dispenser Industry Revenue Share (%), by Consumption Analysis 2024 & 2032
                                                              78. Figure 78: Asia Pacific CNG Dispenser Industry Volume Share (%), by Consumption Analysis 2024 & 2032
                                                              79. Figure 79: Asia Pacific CNG Dispenser Industry Revenue (Million), by Import Market Analysis (Value & Volume) 2024 & 2032
                                                              80. Figure 80: Asia Pacific CNG Dispenser Industry Volume (K Unit), by Import Market Analysis (Value & Volume) 2024 & 2032
                                                              81. Figure 81: Asia Pacific CNG Dispenser Industry Revenue Share (%), by Import Market Analysis (Value & Volume) 2024 & 2032
                                                              82. Figure 82: Asia Pacific CNG Dispenser Industry Volume Share (%), by Import Market Analysis (Value & Volume) 2024 & 2032
                                                              83. Figure 83: Asia Pacific CNG Dispenser Industry Revenue (Million), by Export Market Analysis (Value & Volume) 2024 & 2032
                                                              84. Figure 84: Asia Pacific CNG Dispenser Industry Volume (K Unit), by Export Market Analysis (Value & Volume) 2024 & 2032
                                                              85. Figure 85: Asia Pacific CNG Dispenser Industry Revenue Share (%), by Export Market Analysis (Value & Volume) 2024 & 2032
                                                              86. Figure 86: Asia Pacific CNG Dispenser Industry Volume Share (%), by Export Market Analysis (Value & Volume) 2024 & 2032
                                                              87. Figure 87: Asia Pacific CNG Dispenser Industry Revenue (Million), by Price Trend Analysis 2024 & 2032
                                                              88. Figure 88: Asia Pacific CNG Dispenser Industry Volume (K Unit), by Price Trend Analysis 2024 & 2032
                                                              89. Figure 89: Asia Pacific CNG Dispenser Industry Revenue Share (%), by Price Trend Analysis 2024 & 2032
                                                              90. Figure 90: Asia Pacific CNG Dispenser Industry Volume Share (%), by Price Trend Analysis 2024 & 2032
                                                              91. Figure 91: Asia Pacific CNG Dispenser Industry Revenue (Million), by Country 2024 & 2032
                                                              92. Figure 92: Asia Pacific CNG Dispenser Industry Volume (K Unit), by Country 2024 & 2032
                                                              93. Figure 93: Asia Pacific CNG Dispenser Industry Revenue Share (%), by Country 2024 & 2032
                                                              94. Figure 94: Asia Pacific CNG Dispenser Industry Volume Share (%), by Country 2024 & 2032
                                                              95. Figure 95: South America CNG Dispenser Industry Revenue (Million), by Production Analysis 2024 & 2032
                                                              96. Figure 96: South America CNG Dispenser Industry Volume (K Unit), by Production Analysis 2024 & 2032
                                                              97. Figure 97: South America CNG Dispenser Industry Revenue Share (%), by Production Analysis 2024 & 2032
                                                              98. Figure 98: South America CNG Dispenser Industry Volume Share (%), by Production Analysis 2024 & 2032
                                                              99. Figure 99: South America CNG Dispenser Industry Revenue (Million), by Consumption Analysis 2024 & 2032
                                                              100. Figure 100: South America CNG Dispenser Industry Volume (K Unit), by Consumption Analysis 2024 & 2032
                                                              101. Figure 101: South America CNG Dispenser Industry Revenue Share (%), by Consumption Analysis 2024 & 2032
                                                              102. Figure 102: South America CNG Dispenser Industry Volume Share (%), by Consumption Analysis 2024 & 2032
                                                              103. Figure 103: South America CNG Dispenser Industry Revenue (Million), by Import Market Analysis (Value & Volume) 2024 & 2032
                                                              104. Figure 104: South America CNG Dispenser Industry Volume (K Unit), by Import Market Analysis (Value & Volume) 2024 & 2032
                                                              105. Figure 105: South America CNG Dispenser Industry Revenue Share (%), by Import Market Analysis (Value & Volume) 2024 & 2032
                                                              106. Figure 106: South America CNG Dispenser Industry Volume Share (%), by Import Market Analysis (Value & Volume) 2024 & 2032
                                                              107. Figure 107: South America CNG Dispenser Industry Revenue (Million), by Export Market Analysis (Value & Volume) 2024 & 2032
                                                              108. Figure 108: South America CNG Dispenser Industry Volume (K Unit), by Export Market Analysis (Value & Volume) 2024 & 2032
                                                              109. Figure 109: South America CNG Dispenser Industry Revenue Share (%), by Export Market Analysis (Value & Volume) 2024 & 2032
                                                              110. Figure 110: South America CNG Dispenser Industry Volume Share (%), by Export Market Analysis (Value & Volume) 2024 & 2032
                                                              111. Figure 111: South America CNG Dispenser Industry Revenue (Million), by Price Trend Analysis 2024 & 2032
                                                              112. Figure 112: South America CNG Dispenser Industry Volume (K Unit), by Price Trend Analysis 2024 & 2032
                                                              113. Figure 113: South America CNG Dispenser Industry Revenue Share (%), by Price Trend Analysis 2024 & 2032
                                                              114. Figure 114: South America CNG Dispenser Industry Volume Share (%), by Price Trend Analysis 2024 & 2032
                                                              115. Figure 115: South America CNG Dispenser Industry Revenue (Million), by Country 2024 & 2032
                                                              116. Figure 116: South America CNG Dispenser Industry Volume (K Unit), by Country 2024 & 2032
                                                              117. Figure 117: South America CNG Dispenser Industry Revenue Share (%), by Country 2024 & 2032
                                                              118. Figure 118: South America CNG Dispenser Industry Volume Share (%), by Country 2024 & 2032
                                                              119. Figure 119: Middle East and Africa CNG Dispenser Industry Revenue (Million), by Production Analysis 2024 & 2032
                                                              120. Figure 120: Middle East and Africa CNG Dispenser Industry Volume (K Unit), by Production Analysis 2024 & 2032
                                                              121. Figure 121: Middle East and Africa CNG Dispenser Industry Revenue Share (%), by Production Analysis 2024 & 2032
                                                              122. Figure 122: Middle East and Africa CNG Dispenser Industry Volume Share (%), by Production Analysis 2024 & 2032
                                                              123. Figure 123: Middle East and Africa CNG Dispenser Industry Revenue (Million), by Consumption Analysis 2024 & 2032
                                                              124. Figure 124: Middle East and Africa CNG Dispenser Industry Volume (K Unit), by Consumption Analysis 2024 & 2032
                                                              125. Figure 125: Middle East and Africa CNG Dispenser Industry Revenue Share (%), by Consumption Analysis 2024 & 2032
                                                              126. Figure 126: Middle East and Africa CNG Dispenser Industry Volume Share (%), by Consumption Analysis 2024 & 2032
                                                              127. Figure 127: Middle East and Africa CNG Dispenser Industry Revenue (Million), by Import Market Analysis (Value & Volume) 2024 & 2032
                                                              128. Figure 128: Middle East and Africa CNG Dispenser Industry Volume (K Unit), by Import Market Analysis (Value & Volume) 2024 & 2032
                                                              129. Figure 129: Middle East and Africa CNG Dispenser Industry Revenue Share (%), by Import Market Analysis (Value & Volume) 2024 & 2032
                                                              130. Figure 130: Middle East and Africa CNG Dispenser Industry Volume Share (%), by Import Market Analysis (Value & Volume) 2024 & 2032
                                                              131. Figure 131: Middle East and Africa CNG Dispenser Industry Revenue (Million), by Export Market Analysis (Value & Volume) 2024 & 2032
                                                              132. Figure 132: Middle East and Africa CNG Dispenser Industry Volume (K Unit), by Export Market Analysis (Value & Volume) 2024 & 2032
                                                              133. Figure 133: Middle East and Africa CNG Dispenser Industry Revenue Share (%), by Export Market Analysis (Value & Volume) 2024 & 2032
                                                              134. Figure 134: Middle East and Africa CNG Dispenser Industry Volume Share (%), by Export Market Analysis (Value & Volume) 2024 & 2032
                                                              135. Figure 135: Middle East and Africa CNG Dispenser Industry Revenue (Million), by Price Trend Analysis 2024 & 2032
                                                              136. Figure 136: Middle East and Africa CNG Dispenser Industry Volume (K Unit), by Price Trend Analysis 2024 & 2032
                                                              137. Figure 137: Middle East and Africa CNG Dispenser Industry Revenue Share (%), by Price Trend Analysis 2024 & 2032
                                                              138. Figure 138: Middle East and Africa CNG Dispenser Industry Volume Share (%), by Price Trend Analysis 2024 & 2032
                                                              139. Figure 139: Middle East and Africa CNG Dispenser Industry Revenue (Million), by Country 2024 & 2032
                                                              140. Figure 140: Middle East and Africa CNG Dispenser Industry Volume (K Unit), by Country 2024 & 2032
                                                              141. Figure 141: Middle East and Africa CNG Dispenser Industry Revenue Share (%), by Country 2024 & 2032
                                                              142. Figure 142: Middle East and Africa CNG Dispenser Industry Volume Share (%), by Country 2024 & 2032

                                                              List of Tables

                                                              1. Table 1: Global CNG Dispenser Industry Revenue Million Forecast, by Region 2019 & 2032
                                                              2. Table 2: Global CNG Dispenser Industry Volume K Unit Forecast, by Region 2019 & 2032
                                                              3. Table 3: Global CNG Dispenser Industry Revenue Million Forecast, by Production Analysis 2019 & 2032
                                                              4. Table 4: Global CNG Dispenser Industry Volume K Unit Forecast, by Production Analysis 2019 & 2032
                                                              5. Table 5: Global CNG Dispenser Industry Revenue Million Forecast, by Consumption Analysis 2019 & 2032
                                                              6. Table 6: Global CNG Dispenser Industry Volume K Unit Forecast, by Consumption Analysis 2019 & 2032
                                                              7. Table 7: Global CNG Dispenser Industry Revenue Million Forecast, by Import Market Analysis (Value & Volume) 2019 & 2032
                                                              8. Table 8: Global CNG Dispenser Industry Volume K Unit Forecast, by Import Market Analysis (Value & Volume) 2019 & 2032
                                                              9. Table 9: Global CNG Dispenser Industry Revenue Million Forecast, by Export Market Analysis (Value & Volume) 2019 & 2032
                                                              10. Table 10: Global CNG Dispenser Industry Volume K Unit Forecast, by Export Market Analysis (Value & Volume) 2019 & 2032
                                                              11. Table 11: Global CNG Dispenser Industry Revenue Million Forecast, by Price Trend Analysis 2019 & 2032
                                                              12. Table 12: Global CNG Dispenser Industry Volume K Unit Forecast, by Price Trend Analysis 2019 & 2032
                                                              13. Table 13: Global CNG Dispenser Industry Revenue Million Forecast, by Region 2019 & 2032
                                                              14. Table 14: Global CNG Dispenser Industry Volume K Unit Forecast, by Region 2019 & 2032
                                                              15. Table 15: Global CNG Dispenser Industry Revenue Million Forecast, by Country 2019 & 2032
                                                              16. Table 16: Global CNG Dispenser Industry Volume K Unit Forecast, by Country 2019 & 2032
                                                              17. Table 17: United States CNG Dispenser Industry Revenue (Million) Forecast, by Application 2019 & 2032
                                                              18. Table 18: United States CNG Dispenser Industry Volume (K Unit) Forecast, by Application 2019 & 2032
                                                              19. Table 19: Canada CNG Dispenser Industry Revenue (Million) Forecast, by Application 2019 & 2032
                                                              20. Table 20: Canada CNG Dispenser Industry Volume (K Unit) Forecast, by Application 2019 & 2032
                                                              21. Table 21: Mexico CNG Dispenser Industry Revenue (Million) Forecast, by Application 2019 & 2032
                                                              22. Table 22: Mexico CNG Dispenser Industry Volume (K Unit) Forecast, by Application 2019 & 2032
                                                              23. Table 23: Global CNG Dispenser Industry Revenue Million Forecast, by Country 2019 & 2032
                                                              24. Table 24: Global CNG Dispenser Industry Volume K Unit Forecast, by Country 2019 & 2032
                                                              25. Table 25: Germany CNG Dispenser Industry Revenue (Million) Forecast, by Application 2019 & 2032
                                                              26. Table 26: Germany CNG Dispenser Industry Volume (K Unit) Forecast, by Application 2019 & 2032
                                                              27. Table 27: United Kingdom CNG Dispenser Industry Revenue (Million) Forecast, by Application 2019 & 2032
                                                              28. Table 28: United Kingdom CNG Dispenser Industry Volume (K Unit) Forecast, by Application 2019 & 2032
                                                              29. Table 29: France CNG Dispenser Industry Revenue (Million) Forecast, by Application 2019 & 2032
                                                              30. Table 30: France CNG Dispenser Industry Volume (K Unit) Forecast, by Application 2019 & 2032
                                                              31. Table 31: Spain CNG Dispenser Industry Revenue (Million) Forecast, by Application 2019 & 2032
                                                              32. Table 32: Spain CNG Dispenser Industry Volume (K Unit) Forecast, by Application 2019 & 2032
                                                              33. Table 33: Italy CNG Dispenser Industry Revenue (Million) Forecast, by Application 2019 & 2032
                                                              34. Table 34: Italy CNG Dispenser Industry Volume (K Unit) Forecast, by Application 2019 & 2032
                                                              35. Table 35: Spain CNG Dispenser Industry Revenue (Million) Forecast, by Application 2019 & 2032
                                                              36. Table 36: Spain CNG Dispenser Industry Volume (K Unit) Forecast, by Application 2019 & 2032
                                                              37. Table 37: Belgium CNG Dispenser Industry Revenue (Million) Forecast, by Application 2019 & 2032
                                                              38. Table 38: Belgium CNG Dispenser Industry Volume (K Unit) Forecast, by Application 2019 & 2032
                                                              39. Table 39: Netherland CNG Dispenser Industry Revenue (Million) Forecast, by Application 2019 & 2032
                                                              40. Table 40: Netherland CNG Dispenser Industry Volume (K Unit) Forecast, by Application 2019 & 2032
                                                              41. Table 41: Nordics CNG Dispenser Industry Revenue (Million) Forecast, by Application 2019 & 2032
                                                              42. Table 42: Nordics CNG Dispenser Industry Volume (K Unit) Forecast, by Application 2019 & 2032
                                                              43. Table 43: Rest of Europe CNG Dispenser Industry Revenue (Million) Forecast, by Application 2019 & 2032
                                                              44. Table 44: Rest of Europe CNG Dispenser Industry Volume (K Unit) Forecast, by Application 2019 & 2032
                                                              45. Table 45: Global CNG Dispenser Industry Revenue Million Forecast, by Country 2019 & 2032
                                                              46. Table 46: Global CNG Dispenser Industry Volume K Unit Forecast, by Country 2019 & 2032
                                                              47. Table 47: China CNG Dispenser Industry Revenue (Million) Forecast, by Application 2019 & 2032
                                                              48. Table 48: China CNG Dispenser Industry Volume (K Unit) Forecast, by Application 2019 & 2032
                                                              49. Table 49: Japan CNG Dispenser Industry Revenue (Million) Forecast, by Application 2019 & 2032
                                                              50. Table 50: Japan CNG Dispenser Industry Volume (K Unit) Forecast, by Application 2019 & 2032
                                                              51. Table 51: India CNG Dispenser Industry Revenue (Million) Forecast, by Application 2019 & 2032
                                                              52. Table 52: India CNG Dispenser Industry Volume (K Unit) Forecast, by Application 2019 & 2032
                                                              53. Table 53: South Korea CNG Dispenser Industry Revenue (Million) Forecast, by Application 2019 & 2032
                                                              54. Table 54: South Korea CNG Dispenser Industry Volume (K Unit) Forecast, by Application 2019 & 2032
                                                              55. Table 55: Southeast Asia CNG Dispenser Industry Revenue (Million) Forecast, by Application 2019 & 2032
                                                              56. Table 56: Southeast Asia CNG Dispenser Industry Volume (K Unit) Forecast, by Application 2019 & 2032
                                                              57. Table 57: Australia CNG Dispenser Industry Revenue (Million) Forecast, by Application 2019 & 2032
                                                              58. Table 58: Australia CNG Dispenser Industry Volume (K Unit) Forecast, by Application 2019 & 2032
                                                              59. Table 59: Indonesia CNG Dispenser Industry Revenue (Million) Forecast, by Application 2019 & 2032
                                                              60. Table 60: Indonesia CNG Dispenser Industry Volume (K Unit) Forecast, by Application 2019 & 2032
                                                              61. Table 61: Phillipes CNG Dispenser Industry Revenue (Million) Forecast, by Application 2019 & 2032
                                                              62. Table 62: Phillipes CNG Dispenser Industry Volume (K Unit) Forecast, by Application 2019 & 2032
                                                              63. Table 63: Singapore CNG Dispenser Industry Revenue (Million) Forecast, by Application 2019 & 2032
                                                              64. Table 64: Singapore CNG Dispenser Industry Volume (K Unit) Forecast, by Application 2019 & 2032
                                                              65. Table 65: Thailandc CNG Dispenser Industry Revenue (Million) Forecast, by Application 2019 & 2032
                                                              66. Table 66: Thailandc CNG Dispenser Industry Volume (K Unit) Forecast, by Application 2019 & 2032
                                                              67. Table 67: Rest of Asia Pacific CNG Dispenser Industry Revenue (Million) Forecast, by Application 2019 & 2032
                                                              68. Table 68: Rest of Asia Pacific CNG Dispenser Industry Volume (K Unit) Forecast, by Application 2019 & 2032
                                                              69. Table 69: Global CNG Dispenser Industry Revenue Million Forecast, by Country 2019 & 2032
                                                              70. Table 70: Global CNG Dispenser Industry Volume K Unit Forecast, by Country 2019 & 2032
                                                              71. Table 71: Brazil CNG Dispenser Industry Revenue (Million) Forecast, by Application 2019 & 2032
                                                              72. Table 72: Brazil CNG Dispenser Industry Volume (K Unit) Forecast, by Application 2019 & 2032
                                                              73. Table 73: Argentina CNG Dispenser Industry Revenue (Million) Forecast, by Application 2019 & 2032
                                                              74. Table 74: Argentina CNG Dispenser Industry Volume (K Unit) Forecast, by Application 2019 & 2032
                                                              75. Table 75: Peru CNG Dispenser Industry Revenue (Million) Forecast, by Application 2019 & 2032
                                                              76. Table 76: Peru CNG Dispenser Industry Volume (K Unit) Forecast, by Application 2019 & 2032
                                                              77. Table 77: Chile CNG Dispenser Industry Revenue (Million) Forecast, by Application 2019 & 2032
                                                              78. Table 78: Chile CNG Dispenser Industry Volume (K Unit) Forecast, by Application 2019 & 2032
                                                              79. Table 79: Colombia CNG Dispenser Industry Revenue (Million) Forecast, by Application 2019 & 2032
                                                              80. Table 80: Colombia CNG Dispenser Industry Volume (K Unit) Forecast, by Application 2019 & 2032
                                                              81. Table 81: Ecuador CNG Dispenser Industry Revenue (Million) Forecast, by Application 2019 & 2032
                                                              82. Table 82: Ecuador CNG Dispenser Industry Volume (K Unit) Forecast, by Application 2019 & 2032
                                                              83. Table 83: Venezuela CNG Dispenser Industry Revenue (Million) Forecast, by Application 2019 & 2032
                                                              84. Table 84: Venezuela CNG Dispenser Industry Volume (K Unit) Forecast, by Application 2019 & 2032
                                                              85. Table 85: Rest of South America CNG Dispenser Industry Revenue (Million) Forecast, by Application 2019 & 2032
                                                              86. Table 86: Rest of South America CNG Dispenser Industry Volume (K Unit) Forecast, by Application 2019 & 2032
                                                              87. Table 87: Global CNG Dispenser Industry Revenue Million Forecast, by Country 2019 & 2032
                                                              88. Table 88: Global CNG Dispenser Industry Volume K Unit Forecast, by Country 2019 & 2032
                                                              89. Table 89: United Arab Emirates CNG Dispenser Industry Revenue (Million) Forecast, by Application 2019 & 2032
                                                              90. Table 90: United Arab Emirates CNG Dispenser Industry Volume (K Unit) Forecast, by Application 2019 & 2032
                                                              91. Table 91: Saudi Arabia CNG Dispenser Industry Revenue (Million) Forecast, by Application 2019 & 2032
                                                              92. Table 92: Saudi Arabia CNG Dispenser Industry Volume (K Unit) Forecast, by Application 2019 & 2032
                                                              93. Table 93: South Africa CNG Dispenser Industry Revenue (Million) Forecast, by Application 2019 & 2032
                                                              94. Table 94: South Africa CNG Dispenser Industry Volume (K Unit) Forecast, by Application 2019 & 2032
                                                              95. Table 95: Rest of Middle East and Africa CNG Dispenser Industry Revenue (Million) Forecast, by Application 2019 & 2032
                                                              96. Table 96: Rest of Middle East and Africa CNG Dispenser Industry Volume (K Unit) Forecast, by Application 2019 & 2032
                                                              97. Table 97: Global CNG Dispenser Industry Revenue Million Forecast, by Production Analysis 2019 & 2032
                                                              98. Table 98: Global CNG Dispenser Industry Volume K Unit Forecast, by Production Analysis 2019 & 2032
                                                              99. Table 99: Global CNG Dispenser Industry Revenue Million Forecast, by Consumption Analysis 2019 & 2032
                                                              100. Table 100: Global CNG Dispenser Industry Volume K Unit Forecast, by Consumption Analysis 2019 & 2032
                                                              101. Table 101: Global CNG Dispenser Industry Revenue Million Forecast, by Import Market Analysis (Value & Volume) 2019 & 2032
                                                              102. Table 102: Global CNG Dispenser Industry Volume K Unit Forecast, by Import Market Analysis (Value & Volume) 2019 & 2032
                                                              103. Table 103: Global CNG Dispenser Industry Revenue Million Forecast, by Export Market Analysis (Value & Volume) 2019 & 2032
                                                              104. Table 104: Global CNG Dispenser Industry Volume K Unit Forecast, by Export Market Analysis (Value & Volume) 2019 & 2032
                                                              105. Table 105: Global CNG Dispenser Industry Revenue Million Forecast, by Price Trend Analysis 2019 & 2032
                                                              106. Table 106: Global CNG Dispenser Industry Volume K Unit Forecast, by Price Trend Analysis 2019 & 2032
                                                              107. Table 107: Global CNG Dispenser Industry Revenue Million Forecast, by Country 2019 & 2032
                                                              108. Table 108: Global CNG Dispenser Industry Volume K Unit Forecast, by Country 2019 & 2032
                                                              109. Table 109: Global CNG Dispenser Industry Revenue Million Forecast, by Production Analysis 2019 & 2032
                                                              110. Table 110: Global CNG Dispenser Industry Volume K Unit Forecast, by Production Analysis 2019 & 2032
                                                              111. Table 111: Global CNG Dispenser Industry Revenue Million Forecast, by Consumption Analysis 2019 & 2032
                                                              112. Table 112: Global CNG Dispenser Industry Volume K Unit Forecast, by Consumption Analysis 2019 & 2032
                                                              113. Table 113: Global CNG Dispenser Industry Revenue Million Forecast, by Import Market Analysis (Value & Volume) 2019 & 2032
                                                              114. Table 114: Global CNG Dispenser Industry Volume K Unit Forecast, by Import Market Analysis (Value & Volume) 2019 & 2032
                                                              115. Table 115: Global CNG Dispenser Industry Revenue Million Forecast, by Export Market Analysis (Value & Volume) 2019 & 2032
                                                              116. Table 116: Global CNG Dispenser Industry Volume K Unit Forecast, by Export Market Analysis (Value & Volume) 2019 & 2032
                                                              117. Table 117: Global CNG Dispenser Industry Revenue Million Forecast, by Price Trend Analysis 2019 & 2032
                                                              118. Table 118: Global CNG Dispenser Industry Volume K Unit Forecast, by Price Trend Analysis 2019 & 2032
                                                              119. Table 119: Global CNG Dispenser Industry Revenue Million Forecast, by Country 2019 & 2032
                                                              120. Table 120: Global CNG Dispenser Industry Volume K Unit Forecast, by Country 2019 & 2032
                                                              121. Table 121: Global CNG Dispenser Industry Revenue Million Forecast, by Production Analysis 2019 & 2032
                                                              122. Table 122: Global CNG Dispenser Industry Volume K Unit Forecast, by Production Analysis 2019 & 2032
                                                              123. Table 123: Global CNG Dispenser Industry Revenue Million Forecast, by Consumption Analysis 2019 & 2032
                                                              124. Table 124: Global CNG Dispenser Industry Volume K Unit Forecast, by Consumption Analysis 2019 & 2032
                                                              125. Table 125: Global CNG Dispenser Industry Revenue Million Forecast, by Import Market Analysis (Value & Volume) 2019 & 2032
                                                              126. Table 126: Global CNG Dispenser Industry Volume K Unit Forecast, by Import Market Analysis (Value & Volume) 2019 & 2032
                                                              127. Table 127: Global CNG Dispenser Industry Revenue Million Forecast, by Export Market Analysis (Value & Volume) 2019 & 2032
                                                              128. Table 128: Global CNG Dispenser Industry Volume K Unit Forecast, by Export Market Analysis (Value & Volume) 2019 & 2032
                                                              129. Table 129: Global CNG Dispenser Industry Revenue Million Forecast, by Price Trend Analysis 2019 & 2032
                                                              130. Table 130: Global CNG Dispenser Industry Volume K Unit Forecast, by Price Trend Analysis 2019 & 2032
                                                              131. Table 131: Global CNG Dispenser Industry Revenue Million Forecast, by Country 2019 & 2032
                                                              132. Table 132: Global CNG Dispenser Industry Volume K Unit Forecast, by Country 2019 & 2032
                                                              133. Table 133: Global CNG Dispenser Industry Revenue Million Forecast, by Production Analysis 2019 & 2032
                                                              134. Table 134: Global CNG Dispenser Industry Volume K Unit Forecast, by Production Analysis 2019 & 2032
                                                              135. Table 135: Global CNG Dispenser Industry Revenue Million Forecast, by Consumption Analysis 2019 & 2032
                                                              136. Table 136: Global CNG Dispenser Industry Volume K Unit Forecast, by Consumption Analysis 2019 & 2032
                                                              137. Table 137: Global CNG Dispenser Industry Revenue Million Forecast, by Import Market Analysis (Value & Volume) 2019 & 2032
                                                              138. Table 138: Global CNG Dispenser Industry Volume K Unit Forecast, by Import Market Analysis (Value & Volume) 2019 & 2032
                                                              139. Table 139: Global CNG Dispenser Industry Revenue Million Forecast, by Export Market Analysis (Value & Volume) 2019 & 2032
                                                              140. Table 140: Global CNG Dispenser Industry Volume K Unit Forecast, by Export Market Analysis (Value & Volume) 2019 & 2032
                                                              141. Table 141: Global CNG Dispenser Industry Revenue Million Forecast, by Price Trend Analysis 2019 & 2032
                                                              142. Table 142: Global CNG Dispenser Industry Volume K Unit Forecast, by Price Trend Analysis 2019 & 2032
                                                              143. Table 143: Global CNG Dispenser Industry Revenue Million Forecast, by Country 2019 & 2032
                                                              144. Table 144: Global CNG Dispenser Industry Volume K Unit Forecast, by Country 2019 & 2032
                                                              145. Table 145: Global CNG Dispenser Industry Revenue Million Forecast, by Production Analysis 2019 & 2032
                                                              146. Table 146: Global CNG Dispenser Industry Volume K Unit Forecast, by Production Analysis 2019 & 2032
                                                              147. Table 147: Global CNG Dispenser Industry Revenue Million Forecast, by Consumption Analysis 2019 & 2032
                                                              148. Table 148: Global CNG Dispenser Industry Volume K Unit Forecast, by Consumption Analysis 2019 & 2032
                                                              149. Table 149: Global CNG Dispenser Industry Revenue Million Forecast, by Import Market Analysis (Value & Volume) 2019 & 2032
                                                              150. Table 150: Global CNG Dispenser Industry Volume K Unit Forecast, by Import Market Analysis (Value & Volume) 2019 & 2032
                                                              151. Table 151: Global CNG Dispenser Industry Revenue Million Forecast, by Export Market Analysis (Value & Volume) 2019 & 2032
                                                              152. Table 152: Global CNG Dispenser Industry Volume K Unit Forecast, by Export Market Analysis (Value & Volume) 2019 & 2032
                                                              153. Table 153: Global CNG Dispenser Industry Revenue Million Forecast, by Price Trend Analysis 2019 & 2032
                                                              154. Table 154: Global CNG Dispenser Industry Volume K Unit Forecast, by Price Trend Analysis 2019 & 2032
                                                              155. Table 155: Global CNG Dispenser Industry Revenue Million Forecast, by Country 2019 & 2032
                                                              156. Table 156: Global CNG Dispenser Industry Volume K Unit Forecast, by Country 2019 & 2032


                                                              Frequently Asked Questions

                                                              1. What is the projected Compound Annual Growth Rate (CAGR) of the CNG Dispenser Industry?

                                                              The projected CAGR is approximately > 3.50%.

                                                              2. Which companies are prominent players in the CNG Dispenser Industry?

                                                              Key companies in the market include Kraus Global Ltd, Tulsa Gas Technologies India Pvt Ltd, Scheidt & Bachmann Gmbh, Censtar Science & Technology Co Ltd , Sanki Industry Group, Tatsuno Europe AS, Greka Engineering, FTI International Group Inc, Gilbarco Veeder Root, Parker Hannifin Corp.

                                                              3. What are the main segments of the CNG Dispenser Industry?

                                                              The market segments include Production Analysis, Consumption Analysis, Import Market Analysis (Value & Volume), Export Market Analysis (Value & Volume), Price Trend Analysis.

                                                              4. Can you provide details about the market size?

                                                              The market size is estimated to be USD XX Million as of 2022.

                                                              5. What are some drivers contributing to market growth?

                                                              4.; Corporate Sustainability Goals4.; Stringent Regultions and Compliance.

                                                              6. What are the notable trends driving market growth?

                                                              Increasing Number of CNG Vehicles to Drive the Market.

                                                              7. Are there any restraints impacting market growth?

                                                              4.; High Complexity in Carbon Accounting.

                                                              8. Can you provide examples of recent developments in the market?

                                                              N/A

                                                              9. What pricing options are available for accessing the report?

                                                              Pricing options include single-user, multi-user, and enterprise licenses priced at USD 4750, USD 5250, and USD 8750 respectively.

                                                              10. Is the market size provided in terms of value or volume?

                                                              The market size is provided in terms of value, measured in Million and volume, measured in K Unit.

                                                              11. Are there any specific market keywords associated with the report?

                                                              Yes, the market keyword associated with the report is "CNG Dispenser Industry," which aids in identifying and referencing the specific market segment covered.

                                                              12. How do I determine which pricing option suits my needs best?

                                                              The pricing options vary based on user requirements and access needs. Individual users may opt for single-user licenses, while businesses requiring broader access may choose multi-user or enterprise licenses for cost-effective access to the report.

                                                              13. Are there any additional resources or data provided in the CNG Dispenser Industry report?

                                                              While the report offers comprehensive insights, it's advisable to review the specific contents or supplementary materials provided to ascertain if additional resources or data are available.

                                                              14. How can I stay updated on further developments or reports in the CNG Dispenser Industry?

                                                              To stay informed about further developments, trends, and reports in the CNG Dispenser Industry, consider subscribing to industry newsletters, following relevant companies and organizations, or regularly checking reputable industry news sources and publications.


                                                              Methodology

                                                              Step 1 - Identification of Relevant Samples Size from Population Database

                                                              Step Chart
                                                              Bar Chart
                                                              Method Chart

                                                              Step 2 - Approaches for Defining Global Market Size (Value, Volume* & Price*)

                                                              Approach Chart
                                                              Top-down and bottom-up approaches are used to validate the global market size and estimate the market size for manufactures, regional segments, product, and application.

                                                              Note*: In applicable scenarios

                                                              Step 3 - Data Sources

                                                              Primary Research

                                                              • Web Analytics
                                                              • Survey Reports
                                                              • Research Institute
                                                              • Latest Research Reports
                                                              • Opinion Leaders

                                                              Secondary Research

                                                              • Annual Reports
                                                              • White Paper
                                                              • Latest Press Release
                                                              • Industry Association
                                                              • Paid Database
                                                              • Investor Presentations
                                                              Analyst Chart

                                                              Step 4 - Data Triangulation

                                                              Involves using different sources of information in order to increase the validity of a study

                                                              These sources are likely to be stakeholders in a program - participants, other researchers, program staff, other community members, and so on.

                                                              Then we put all data in single framework & apply various statistical tools to find out the dynamic on the market.

                                                              During the analysis stage, feedback from the stakeholder groups would be compared to determine areas of agreement as well as areas of divergence

                                                              Additionally, after gathering mixed and scattered data from a wide range of sources, data is triangulated and correlated to come up with estimated figures which are further validated through primary mediums or industry experts, opinion leaders.

                                                              About Visionary Data Reports

                                                              Visionary Data Reports provides future-focused market research, advanced analytics, and strategic insights for technology, healthcare, green energy, and finance. Our reports help you anticipate trends, innovate, and lead in your industry. Our expert team combines primary research, data science, and industry knowledge to deliver actionable intelligence. We offer syndicated reports, custom analytics, and consulting services tailored to your business needs. At Visionary Data Reports, we are committed to quality, transparency, and client satisfaction. Every report is rigorously validated to ensure accuracy and relevance. Our global perspective and forward-thinking approach help you understand both current and emerging market dynamics.

                                                              Stay ahead with Visionary Data Reports. Subscribe to our newsletter for the latest insights and research highlights, and follow us on social media for real-time updates. Visionary Data Reports – Your Guide to Tomorrow’s Opportunities.

                                                              artwork spiralartwork spiralRelated Reports
                                                              artwork underline

                                                              Gabon Power Industry Insights: Growth at XX CAGR Through 2033

                                                              Discover the lucrative growth opportunities in Gabon's booming power industry. This comprehensive market analysis reveals key drivers, trends, and challenges shaping the sector's future, including hydropower, natural gas, and the role of major players like Engie and Wartsila. Explore the projected market size, CAGR, and regional breakdowns for informed investment decisions. Invest in Gabon's energy future.

                                                              July 2025
                                                              Base Year: 2024
                                                              No Of Pages: 197
                                                              Price: $3800

                                                              Algeria Power Market Market’s Consumer Insights and Trends

                                                              Discover the booming Algerian power market, projected to grow at a CAGR exceeding 8.5% until 2033. This in-depth analysis reveals key drivers, trends, and challenges, highlighting opportunities for investment in renewable energy and grid modernization. Explore market size, segmentation, and key players shaping this dynamic sector.

                                                              July 2025
                                                              Base Year: 2024
                                                              No Of Pages: 197
                                                              Price: $3800

                                                              US Fixed-tilt Solar PV Industry 2025-2033 Analysis: Trends, Competitor Dynamics, and Growth Opportunities

                                                              Discover the booming US fixed-tilt solar PV market! This comprehensive analysis reveals a CAGR exceeding 13.60%, driven by strong demand, government incentives, and technological advancements. Learn about key trends, regional variations, leading companies, and future growth projections for 2025-2033.

                                                              July 2025
                                                              Base Year: 2024
                                                              No Of Pages: 197
                                                              Price: $3800

                                                              Artificial Lift Software Industry Strategic Insights: Analysis 2025 and Forecasts 2033

                                                              The Artificial Lift Systems market is booming, projected to reach $XX million by 2033 with a CAGR exceeding 4.50%. Driven by increasing oil & gas production and technological advancements in ESP, PCP, and Rod Lift systems, key players like Baker Hughes and Schlumberger are shaping this lucrative sector. Explore market trends and regional analysis in our comprehensive report.

                                                              July 2025
                                                              Base Year: 2024
                                                              No Of Pages: 234
                                                              Price: $4750

                                                              Middle East and Africa Bunker Fuel Industry: Disruptive Technologies Driving Market Growth 2025-2033

                                                              Discover the booming Middle East & Africa Bunker Fuel market! This comprehensive analysis reveals a CAGR exceeding 12%, driven by increasing maritime trade and the shift towards cleaner fuels like LNG. Learn about market trends, key players (Shell, ExxonMobil, Uniper), and regional growth forecasts for 2025-2033.

                                                              July 2025
                                                              Base Year: 2024
                                                              No Of Pages: 234
                                                              Price: $4750

                                                              Gas Generator Rental Industry Unlocking Growth Potential: 2025-2033 Analysis and Forecasts

                                                              The gas generator rental market is booming, projected to exceed a CAGR of 5.20% through 2033. Discover key drivers, regional trends, and leading companies shaping this dynamic industry. Explore market size, segmentation (oil & gas, construction, data centers), and future growth projections in our comprehensive analysis.

                                                              July 2025
                                                              Base Year: 2024
                                                              No Of Pages: 234
                                                              Price: $4750

                                                              Unveiling Oil and Gas CAPEX Outlook Industry Trends

                                                              Discover the latest Oil & Gas CAPEX Outlook, projecting a 4.27% CAGR through 2033. Analyze market trends, regional breakdowns (North America, Europe, Asia-Pacific), key players (Shell, ExxonMobil, CNPC), and investment drivers shaping this dynamic sector. Get the data-driven insights you need for strategic decision-making.

                                                              July 2025
                                                              Base Year: 2024
                                                              No Of Pages: 234
                                                              Price: $4750

                                                              Oil and Gas Market in Malaysia Market’s Consumer Insights and Trends

                                                              Discover the booming Malaysian oil and gas market! This comprehensive analysis reveals key trends, drivers, and challenges impacting this $15B+ sector through 2033, profiling major players like Petronas and Royal Vopak. Learn about growth projections, market segmentation (transportation, storage, LNG terminals), and investment opportunities.

                                                              July 2025
                                                              Base Year: 2024
                                                              No Of Pages: 197
                                                              Price: $3800

                                                              Navigating Asia-Pacific Completion Equipment and Services Market Market Growth 2025-2033

                                                              Discover the booming Asia-Pacific completion equipment and services market! This in-depth analysis reveals key trends, growth drivers, and leading companies shaping this dynamic sector, projected to reach significant value by 2033. Explore market segments, regional breakdowns, and future growth potential.

                                                              July 2025
                                                              Base Year: 2024
                                                              No Of Pages: 234
                                                              Price: $4750

                                                              Exploring Consumer Shifts in Gas Generator Industry Market 2025-2033

                                                              The global gas generator market is booming, projected to reach $XX million by 2033 with a 4.95% CAGR. Driven by industrialization and unreliable grids, this report analyzes market trends, segments (industrial, commercial, residential, power rating), key players (Cummins, Generac, Caterpillar), and regional growth (North America, Europe, Asia-Pacific). Discover insights into this expanding market.

                                                              July 2025
                                                              Base Year: 2024
                                                              No Of Pages: 234
                                                              Price: $4750

                                                              Decoding Tunisia Power Industry Consumer Preferences 2025-2033

                                                              Discover the booming Tunisian power industry! This comprehensive market analysis reveals a CAGR of 7.70%, driven by renewable energy adoption and infrastructure modernization. Explore market size, key players (STEG, Seeraj Energy, more), and future growth projections (2025-2033) in this insightful report.

                                                              July 2025
                                                              Base Year: 2024
                                                              No Of Pages: 197
                                                              Price: $3800

                                                              High Voltage Switchgear Market Market Trends and Insights

                                                              The global high-voltage switchgear market is booming, projected to reach [insert projected 2033 value based on chart data] by 2033, driven by renewable energy integration and grid modernization. Explore market trends, key players (ABB, Siemens, Schneider Electric), and regional insights in this comprehensive analysis.

                                                              July 2025
                                                              Base Year: 2024
                                                              No Of Pages: 234
                                                              Price: $4750

                                                              Regional Trends and Opportunities for Excitation Systems Industry Market

                                                              Discover the booming Excitation Systems market! This in-depth analysis reveals a CAGR exceeding 4.35% through 2033, driven by renewable energy and industrial growth. Explore market size, key players (ABB, Siemens, GE), regional trends, and future projections for synchronous generators, motors, static & brushless systems.

                                                              July 2025
                                                              Base Year: 2024
                                                              No Of Pages: 234
                                                              Price: $4750

                                                              Comprehensive Review of Residential Combined Heat & Power System Market Growth Potential

                                                              Discover the booming Residential Combined Heat & Power (CHP) System market! Explore key trends, growth drivers, leading companies, and regional insights for 2025-2033. Learn about fuel cell and engine-based systems, and the impact of government policies on this sustainable energy solution.

                                                              July 2025
                                                              Base Year: 2024
                                                              No Of Pages: 234
                                                              Price: $4750

                                                              Opportunities in Emerging Indonesia Oil & Gas Downstream Market Industry Markets

                                                              Discover the booming Indonesia Oil & Gas Downstream Market analysis revealing a CAGR exceeding 4% through 2033. This in-depth report covers key players, segments (refined products, natural gas, petrochemicals), and regional trends, offering invaluable insights for investors and industry professionals. Explore growth drivers, restraints, and future projections for this dynamic market.

                                                              July 2025
                                                              Base Year: 2024
                                                              No Of Pages: 197
                                                              Price: $3800

                                                              Europe Nuclear Power Plant and Equipment Industry Market Trends and Strategic Roadmap

                                                              Discover the latest market analysis on the thriving European Nuclear Power Plant & Equipment industry. Explore growth drivers, market size (€20B in 2025), key players (Westinghouse, Rosatom, Framatome), and future trends impacting PWR, PHWR, and SMR technologies. Learn about the investment opportunities and challenges in this dynamic sector.

                                                              July 2025
                                                              Base Year: 2024
                                                              No Of Pages: 234
                                                              Price: $4750

                                                              Europe Hydraulic Fracturing Fluids Market Market Expansion: Growth Outlook 2025-2033

                                                              Discover the latest trends in the European hydraulic fracturing fluids market. Our in-depth analysis reveals a steady growth trajectory driven by natural gas demand, despite environmental regulations. Learn about market segmentation, key players (Schlumberger, Halliburton, Baker Hughes), and future projections for 2025-2033.

                                                              July 2025
                                                              Base Year: 2024
                                                              No Of Pages: 180
                                                              Price: $4750

                                                              Consumer Battery Industry Market’s Strategic Roadmap: Insights for 2025-2033

                                                              Discover the booming consumer battery market! This in-depth analysis reveals a CAGR of 7.47% through 2033, driven by consumer electronics, EVs, and industrial demand. Explore market size, key players (Samsung SDI, LG Chem, Panasonic), and regional trends. Learn about lithium-ion, alkaline, and other battery types.

                                                              July 2025
                                                              Base Year: 2024
                                                              No Of Pages: 234
                                                              Price: $4750

                                                              Kuwait Oil & Gas Market Market Predictions: Growth and Size Trends to 2033

                                                              Discover the booming Kuwait Oil & Gas market forecast to 2033! This in-depth analysis reveals market size, growth drivers (upstream, midstream, downstream), key players (Kuwait Petroleum Corporation, Chevron, Shell), and challenges. Learn about investment opportunities and future trends in this dynamic sector.

                                                              July 2025
                                                              Base Year: 2024
                                                              No Of Pages: 197
                                                              Price: $3800

                                                              France Tidal Power Market 2025-2033 Trends and Competitor Dynamics: Unlocking Growth Opportunities

                                                              Discover the booming France Tidal Power Market! Explore its €175-200 million (2025 est.) size, 4.54% CAGR, key drivers, restraints, and top companies. Learn about tidal barrage, floating platforms, and stream generation technologies shaping this renewable energy sector.

                                                              July 2025
                                                              Base Year: 2024
                                                              No Of Pages: 197
                                                              Price: $3800
                                                              • Home
                                                              • About Us
                                                              • Industries
                                                                • Aerospace & Defense
                                                                • Agriculture
                                                                • Animal Nutrition & Wellness
                                                                • Automotive
                                                                • Chemicals & Materials
                                                                • Consumer Goods and Services
                                                                • Energy & Power
                                                                • Financial Services and Investment Intelligence
                                                                • Food & Beverage
                                                                • Home and Property Improvement
                                                                • Hospitality and Tourism
                                                                • Logistics
                                                                • Manufacturing Products and Services
                                                                • Packaging
                                                                • Professional and Commercial Services
                                                                • Real Estate and Construction
                                                                • Retail
                                                                • Technology, Media and Telecom
                                                                • Healthcare
                                                              • Services
                                                              • Contact
                                                              Main Logo
                                                              • Home
                                                              • About Us
                                                              • Industries
                                                                • Aerospace & Defense
                                                                • Agriculture
                                                                • Animal Nutrition & Wellness
                                                                • Automotive
                                                                • Chemicals & Materials
                                                                • Consumer Goods and Services
                                                                • Energy & Power
                                                                • Financial Services and Investment Intelligence
                                                                • Food & Beverage
                                                                • Home and Property Improvement
                                                                • Hospitality and Tourism
                                                                • Logistics
                                                                • Manufacturing Products and Services
                                                                • Packaging
                                                                • Professional and Commercial Services
                                                                • Real Estate and Construction
                                                                • Retail
                                                                • Technology, Media and Telecom
                                                                • Healthcare
                                                              • Services
                                                              • Contact
                                                              +17162654855
                                                              [email protected]

                                                              +17162654855

                                                              [email protected]

                                                              Business Address

                                                              Head Office

                                                              Office no. A 5010, fifth floor, Solitaire Business Hub, Near Phoenix mall, Pune, Maharashtra 411014

                                                              Contact Information

                                                              Craig Francis

                                                              Business Development Head

                                                              +17162654855

                                                              [email protected]

                                                              Connect With Us

                                                              Secure Payment Partners

                                                              payment image
                                                              RetailLogisticsPackagingAutomotiveHealthcareAgricultureEnergy & PowerFood & BeverageAerospace & DefenseChemicals & MaterialsHospitality and TourismAnimal Nutrition & WellnessConsumer Goods and ServicesReal Estate and ConstructionHome and Property ImprovementTechnology, Media and TelecomManufacturing Products and ServicesFinancial Services and Investment Intelligence

                                                              © 2025 All rights reserved


                                                              Privacy Policy
                                                              Terms and Conditions
                                                              FAQ