Clove Industry in Focus: Growth Trajectories and Strategic Insights 2025-2033

Clove Industry by Production Analysis, by Consumption Analysis, by Import Market Analysis (Value & Volume), by Export Market Analysis (Value & Volume), by Price Trend Analysis, by North America (United States), by Europe (United Kingdom, Germany, France), by Asia Pacific (Indonesia, China, India, Singapore, Malaysia, Sri Lanka, Vietnam), by Middle East, by Madagascar (Kingdom of Saudi Arabia, United Arab Emirates, Kenya, Comoros, Tanzania) Forecast 2025-2033

Jun 27 2025
Base Year: 2024

234 Pages
Main Logo

Clove Industry in Focus: Growth Trajectories and Strategic Insights 2025-2033


Home
Industries
Agriculture
sponsor image

Tailored for you

  • In-depth Analysis Tailored to Specified Regions or Segments
  • Company Profiles Customized to User Preferences
  • Comprehensive Insights Focused on Specific Segments or Regions
  • Customized Evaluation of Competitive Landscape to Meet Your Needs
  • Tailored Customization to Address Other Specific Requirements
Ask for customization


Key Insights

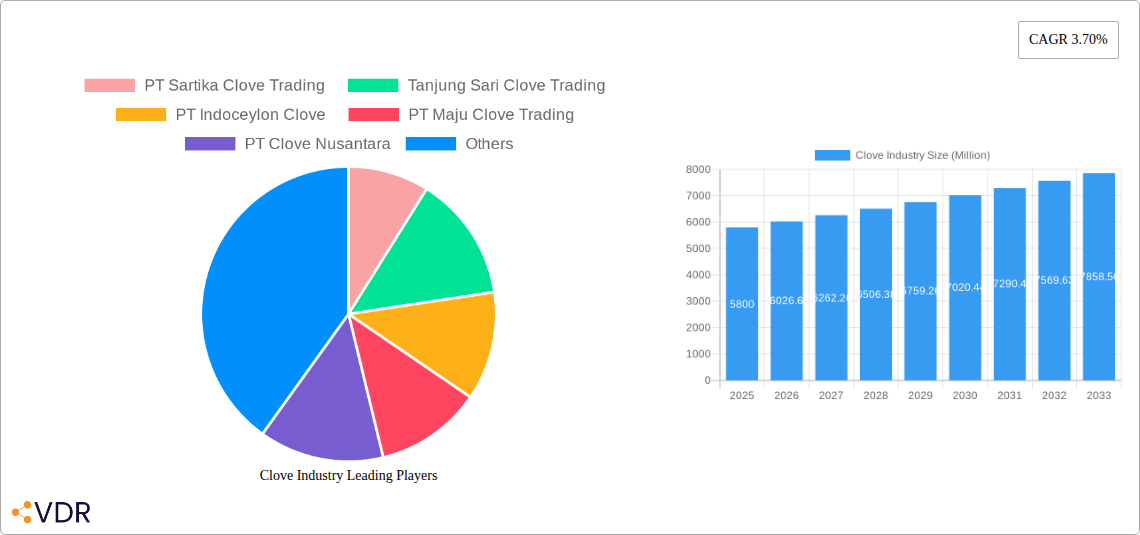
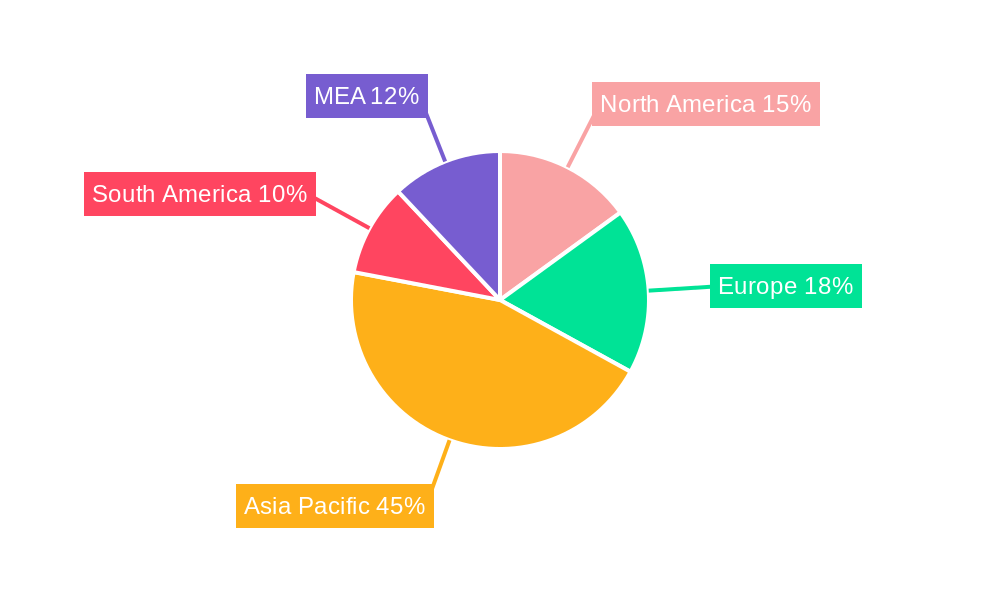
The global clove industry, valued at $5.80 billion in 2025, is projected to experience steady growth, driven by increasing demand for clove buds and clove oil across culinary and medicinal applications. The compound annual growth rate (CAGR) of 3.70% from 2025 to 2033 indicates a sustained expansion of the market, primarily fueled by the rising popularity of clove-infused foods and beverages, particularly in developing economies in Asia-Pacific and South America. Furthermore, the increasing awareness of clove's medicinal properties, such as its antioxidant and antimicrobial effects, is driving its integration into various pharmaceutical and health products, further bolstering market growth. While factors such as fluctuating clove prices and competition from synthetic substitutes could pose challenges, the overall market outlook remains positive. The growth is expected to be relatively consistent across regions, with Asia-Pacific continuing to dominate due to high consumption and production, followed by North America and Europe, which exhibit strong demand driven by a burgeoning health-conscious population and a growing interest in exotic spices.

Segment-wise, clove buds are anticipated to maintain a significant market share due to their widespread use in culinary applications. However, the clove oil segment is projected to witness higher growth rates, fueled by expanding applications in aromatherapy, pharmaceuticals, and personal care products. The culinary application segment will remain dominant, however medicinal applications are predicted to show significant growth due to increasing research showcasing clove's health benefits and rising interest in natural remedies. Key players in the market are strategically focusing on expanding their distribution networks and introducing innovative clove-based products to cater to evolving consumer preferences and maintain their competitive edge. The forecast period from 2025-2033 provides a positive trajectory for industry players to capitalize on the expanding global demand for cloves.

Clove Industry Market Report: 2019-2033

This comprehensive report provides an in-depth analysis of the global clove industry, encompassing market dynamics, growth trends, regional dominance, product landscape, challenges, opportunities, and key players. The study covers the period from 2019 to 2033, with a base year of 2025 and a forecast period of 2025-2033. The report segments the market by Product Type (Clove Buds, Clove Oil) and Application (Culinary, Medicinal), offering granular insights for informed decision-making. Key players such as PT Sartika Clove Trading, Tanjung Sari Clove Trading, PT Indoceylon Clove, PT Maju Clove Trading, and PT Clove Nusantara are analyzed in detail.

Clove Industry Research Report - Market Size, Growth & Forecast

Clove Industry Market Dynamics & Structure

The global clove market is moderately concentrated, with a few large players dominating the supply chain alongside numerous smaller producers. Technological innovation, primarily in processing and extraction techniques for clove oil, is a key driver, increasing efficiency and yield. Regulatory frameworks related to food safety and pesticide use significantly impact production and trade. While there are some substitutes for cloves in specific culinary applications, the unique flavor and medicinal properties of cloves limit widespread substitution. End-user demographics show a diverse consumer base across various geographies, with consumption driven by culinary and traditional medicinal practices. M&A activity in the sector has been relatively low in recent years, with xx Million USD in total deal value from 2019-2024, indicating potential for consolidation in the future.

  • Market Concentration: Moderately concentrated, with top 5 players holding approximately 45% market share in 2024.
  • Technological Innovation: Focus on improving oil extraction efficiency and quality.
  • Regulatory Framework: Stringent food safety and pesticide regulations influence production.
  • Product Substitutes: Limited substitutes due to unique flavor and medicinal properties.
  • End-User Demographics: Diverse consumer base across regions, driven by culinary and medicinal use.
  • M&A Trends: Low activity in recent years (xx Million USD from 2019-2024), potential for future consolidation.

Clove Industry Growth Trends & Insights

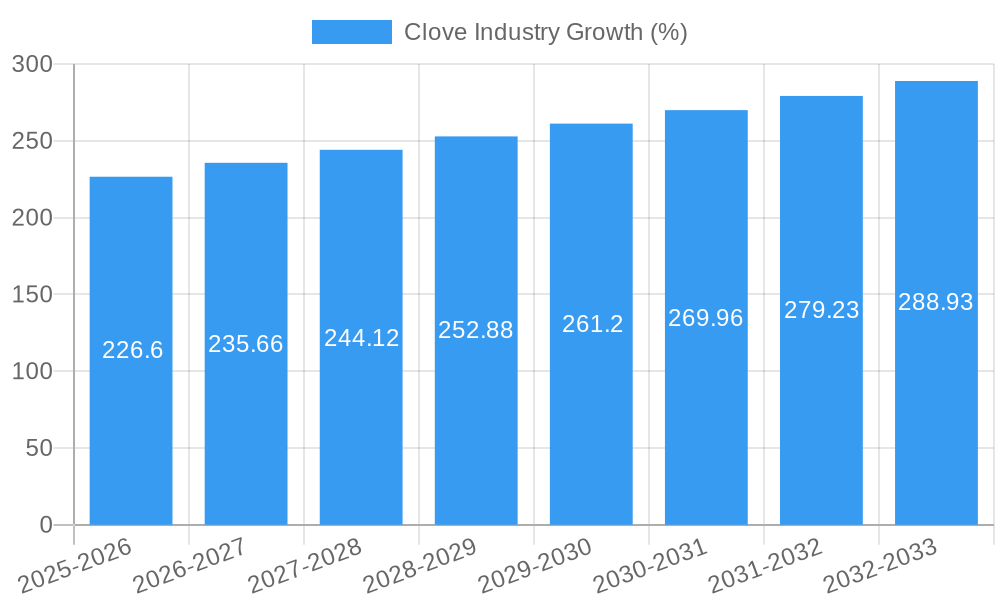
The global clove market experienced steady growth during the historical period (2019-2024), driven by increasing demand from both culinary and medicinal applications. The market size in 2024 is estimated at 1500 Million USD. This growth is projected to continue during the forecast period (2025-2033), with a Compound Annual Growth Rate (CAGR) of approximately 4%. Factors such as rising disposable incomes in emerging economies, growing awareness of clove's health benefits, and increasing adoption in food processing industries are propelling this growth. Technological advancements in clove oil extraction and processing are further enhancing the market's potential, though supply chain disruptions and price volatility remain challenges. Consumer behavior shifts towards healthier and more natural products also contribute positively to the growth trajectory. Market penetration in key regions is steadily increasing, with significant growth potential in untapped markets.

Clove Industry Growth

Dominant Regions, Countries, or Segments in Clove Industry

Indonesia dominates the global clove market, accounting for approximately 60% of global production in 2024, driven by its favorable climate and established agricultural practices. The clove bud segment holds a larger market share (75% in 2024) than clove oil, primarily due to higher culinary applications. However, the clove oil segment is witnessing faster growth due to increasing use in pharmaceuticals and cosmetics.

  • Key Drivers in Indonesia: Favorable climate, established agricultural practices, government support for spice cultivation.
  • Market Share: Indonesia holds approximately 60% of the global market share in 2024.
  • Growth Potential: Untapped markets in other regions present significant growth opportunities for clove oil, especially in the medicinal and cosmetic sectors.
  • Segment Dominance: Clove buds dominate by volume, while clove oil demonstrates higher growth rate.

Clove Industry Product Landscape

The clove industry primarily offers two main product types: clove buds and clove oil. Innovations focus on enhancing the quality and consistency of clove oil extraction, exploring new applications in cosmetics, pharmaceuticals, and food processing. Unique selling propositions include the unique flavor profile of clove buds and the antimicrobial and antioxidant properties of clove oil. Technological advancements in distillation methods are improving the purity and yield of clove oil.

Key Drivers, Barriers & Challenges in Clove Industry

Key Drivers: Growing demand from food and beverage industries, increasing awareness of health benefits, technological advancements improving oil extraction, expansion into new applications (cosmetics, pharmaceuticals), and rising disposable incomes in developing countries.

Challenges & Restraints: Price volatility due to fluctuating crop yields, supply chain disruptions from weather events or political instability, stringent regulations impacting trade and processing, and competition from synthetic flavorings and substitutes. These factors can significantly impact profitability and market stability. The estimated impact of these challenges on the market size is approximately -2% year on year during the forecast period.

Emerging Opportunities in Clove Industry

Emerging opportunities lie in expanding into untapped markets in regions with growing populations and higher disposable incomes. Innovative applications of clove oil in cosmetics and pharmaceuticals offer significant growth potential. Evolving consumer preferences for natural and healthy products create further opportunities for clove-based products and formulations. Furthermore, strategic partnerships with larger food and beverage companies could significantly expand market reach and penetration.

Growth Accelerators in the Clove Industry

Technological advancements in clove oil extraction and processing are a major growth accelerator. Strategic partnerships between clove producers and manufacturers in downstream industries (food and beverage, pharmaceuticals) provide access to new markets and increased distribution channels. Market expansion strategies focused on untapped regions and consumer segments are crucial for sustaining long-term growth.

Key Players Shaping the Clove Industry Market

  • PT Sartika Clove Trading
  • Tanjung Sari Clove Trading
  • PT Indoceylon Clove
  • PT Maju Clove Trading
  • PT Clove Nusantara

Notable Milestones in Clove Industry Sector

  • 2021-Q3: Successful implementation of a new clove oil extraction technology by a leading Indonesian producer resulted in a 15% increase in yield.
  • 2022-Q4: A major international food and beverage company launched a new product line incorporating clove extract, boosting consumer demand.
  • 2023-Q1: A new regulatory framework aimed at standardizing clove processing practices was introduced in Indonesia, enhancing quality control.

In-Depth Clove Industry Market Outlook

The clove industry presents a promising outlook with substantial growth potential in the coming years. Continued innovation in clove oil extraction, expansion into new markets, and strategic partnerships with major players will drive market expansion and unlock new opportunities. The global market is expected to reach approximately 2500 Million USD by 2033, fueled by growing demand and the increasing awareness of the versatile applications of cloves and clove oil. The focus on sustainability and ethical sourcing will also be crucial for long-term market success.

Clove Industry Segmentation

  • 1. Production Analysis
  • 2. Consumption Analysis
  • 3. Import Market Analysis (Value & Volume)
  • 4. Export Market Analysis (Value & Volume)
  • 5. Price Trend Analysis

Clove Industry Segmentation By Geography

  • 1. North America
    • 1.1. United States
  • 2. Europe
    • 2.1. United Kingdom
    • 2.2. Germany
    • 2.3. France
  • 3. Asia Pacific
    • 3.1. Indonesia
    • 3.2. China
    • 3.3. India
    • 3.4. Singapore
    • 3.5. Malaysia
    • 3.6. Sri Lanka
    • 3.7. Vietnam
  • 4. Middle East
  • 5. Madagascar
    • 5.1. Kingdom of Saudi Arabia
    • 5.2. United Arab Emirates
    • 5.3. Kenya
    • 5.4. Comoros
    • 5.5. Tanzania
Clove Industry Regional Share


Clove Industry REPORT HIGHLIGHTS

AspectsDetails
Study Period 2019-2033
Base Year 2024
Estimated Year 2025
Forecast Period2025-2033
Historical Period2019-2024
Growth RateCAGR of 3.70% from 2019-2033
Segmentation
    • By Production Analysis
    • By Consumption Analysis
    • By Import Market Analysis (Value & Volume)
    • By Export Market Analysis (Value & Volume)
    • By Price Trend Analysis
  • By Geography
    • North America
      • United States
    • Europe
      • United Kingdom
      • Germany
      • France
    • Asia Pacific
      • Indonesia
      • China
      • India
      • Singapore
      • Malaysia
      • Sri Lanka
      • Vietnam
    • Middle East
    • Madagascar
      • Kingdom of Saudi Arabia
      • United Arab Emirates
      • Kenya
      • Comoros
      • Tanzania


Table of Contents

  1. 1. Introduction
    • 1.1. Research Scope
    • 1.2. Market Segmentation
    • 1.3. Research Methodology
    • 1.4. Definitions and Assumptions
  2. 2. Executive Summary
    • 2.1. Introduction
  3. 3. Market Dynamics
    • 3.1. Introduction
      • 3.2. Market Drivers
        • 3.2.1. Increasing Demand for Garlic Due to Various Uses in Industries; Rising Demad of Organic Garlic; Increasing Government Initiatives
      • 3.3. Market Restrains
        • 3.3.1. Lack of Technical Knowledge of Farmers; Price Fluctuations
      • 3.4. Market Trends
        • 3.4.1. Increased Demand from Various Industries is Aiding the Production
  4. 4. Market Factor Analysis
    • 4.1. Porters Five Forces
    • 4.2. Supply/Value Chain
    • 4.3. PESTEL analysis
    • 4.4. Market Entropy
    • 4.5. Patent/Trademark Analysis
  5. 5. Global Clove Industry Analysis, Insights and Forecast, 2019-2031
    • 5.1. Market Analysis, Insights and Forecast - by Production Analysis
      • 5.2. Market Analysis, Insights and Forecast - by Consumption Analysis
        • 5.3. Market Analysis, Insights and Forecast - by Import Market Analysis (Value & Volume)
          • 5.4. Market Analysis, Insights and Forecast - by Export Market Analysis (Value & Volume)
            • 5.5. Market Analysis, Insights and Forecast - by Price Trend Analysis
              • 5.6. Market Analysis, Insights and Forecast - by Region
                • 5.6.1. North America
                • 5.6.2. Europe
                • 5.6.3. Asia Pacific
                • 5.6.4. Middle East
                • 5.6.5. Madagascar
            • 6. North America Clove Industry Analysis, Insights and Forecast, 2019-2031
              • 6.1. Market Analysis, Insights and Forecast - by Production Analysis
                • 6.2. Market Analysis, Insights and Forecast - by Consumption Analysis
                  • 6.3. Market Analysis, Insights and Forecast - by Import Market Analysis (Value & Volume)
                    • 6.4. Market Analysis, Insights and Forecast - by Export Market Analysis (Value & Volume)
                      • 6.5. Market Analysis, Insights and Forecast - by Price Trend Analysis
                      • 7. Europe Clove Industry Analysis, Insights and Forecast, 2019-2031
                        • 7.1. Market Analysis, Insights and Forecast - by Production Analysis
                          • 7.2. Market Analysis, Insights and Forecast - by Consumption Analysis
                            • 7.3. Market Analysis, Insights and Forecast - by Import Market Analysis (Value & Volume)
                              • 7.4. Market Analysis, Insights and Forecast - by Export Market Analysis (Value & Volume)
                                • 7.5. Market Analysis, Insights and Forecast - by Price Trend Analysis
                                • 8. Asia Pacific Clove Industry Analysis, Insights and Forecast, 2019-2031
                                  • 8.1. Market Analysis, Insights and Forecast - by Production Analysis
                                    • 8.2. Market Analysis, Insights and Forecast - by Consumption Analysis
                                      • 8.3. Market Analysis, Insights and Forecast - by Import Market Analysis (Value & Volume)
                                        • 8.4. Market Analysis, Insights and Forecast - by Export Market Analysis (Value & Volume)
                                          • 8.5. Market Analysis, Insights and Forecast - by Price Trend Analysis
                                          • 9. Middle East Clove Industry Analysis, Insights and Forecast, 2019-2031
                                            • 9.1. Market Analysis, Insights and Forecast - by Production Analysis
                                              • 9.2. Market Analysis, Insights and Forecast - by Consumption Analysis
                                                • 9.3. Market Analysis, Insights and Forecast - by Import Market Analysis (Value & Volume)
                                                  • 9.4. Market Analysis, Insights and Forecast - by Export Market Analysis (Value & Volume)
                                                    • 9.5. Market Analysis, Insights and Forecast - by Price Trend Analysis
                                                    • 10. Madagascar Clove Industry Analysis, Insights and Forecast, 2019-2031
                                                      • 10.1. Market Analysis, Insights and Forecast - by Production Analysis
                                                        • 10.2. Market Analysis, Insights and Forecast - by Consumption Analysis
                                                          • 10.3. Market Analysis, Insights and Forecast - by Import Market Analysis (Value & Volume)
                                                            • 10.4. Market Analysis, Insights and Forecast - by Export Market Analysis (Value & Volume)
                                                              • 10.5. Market Analysis, Insights and Forecast - by Price Trend Analysis
                                                              • 11. North America Clove Industry Analysis, Insights and Forecast, 2019-2031
                                                                  • 11.1. Market Analysis, Insights and Forecast - By Country/Sub-region
                                                                    • 11.1.1 United States
                                                                    • 11.1.2 Canada
                                                                    • 11.1.3 Mexico
                                                              • 12. Europe Clove Industry Analysis, Insights and Forecast, 2019-2031
                                                                  • 12.1. Market Analysis, Insights and Forecast - By Country/Sub-region
                                                                    • 12.1.1 Germany
                                                                    • 12.1.2 United Kingdom
                                                                    • 12.1.3 France
                                                                    • 12.1.4 Spain
                                                                    • 12.1.5 Italy
                                                                    • 12.1.6 Spain
                                                                    • 12.1.7 Belgium
                                                                    • 12.1.8 Netherland
                                                                    • 12.1.9 Nordics
                                                                    • 12.1.10 Rest of Europe
                                                              • 13. Asia Pacific Clove Industry Analysis, Insights and Forecast, 2019-2031
                                                                  • 13.1. Market Analysis, Insights and Forecast - By Country/Sub-region
                                                                    • 13.1.1 China
                                                                    • 13.1.2 Japan
                                                                    • 13.1.3 India
                                                                    • 13.1.4 South Korea
                                                                    • 13.1.5 Southeast Asia
                                                                    • 13.1.6 Australia
                                                                    • 13.1.7 Indonesia
                                                                    • 13.1.8 Phillipes
                                                                    • 13.1.9 Singapore
                                                                    • 13.1.10 Thailandc
                                                                    • 13.1.11 Rest of Asia Pacific
                                                              • 14. South America Clove Industry Analysis, Insights and Forecast, 2019-2031
                                                                  • 14.1. Market Analysis, Insights and Forecast - By Country/Sub-region
                                                                    • 14.1.1 Brazil
                                                                    • 14.1.2 Argentina
                                                                    • 14.1.3 Peru
                                                                    • 14.1.4 Chile
                                                                    • 14.1.5 Colombia
                                                                    • 14.1.6 Ecuador
                                                                    • 14.1.7 Venezuela
                                                                    • 14.1.8 Rest of South America
                                                              • 15. MEA Clove Industry Analysis, Insights and Forecast, 2019-2031
                                                                  • 15.1. Market Analysis, Insights and Forecast - By Country/Sub-region
                                                                    • 15.1.1 United Arab Emirates
                                                                    • 15.1.2 Saudi Arabia
                                                                    • 15.1.3 South Africa
                                                                    • 15.1.4 Rest of Middle East and Africa
                                                              • 16. Competitive Analysis
                                                                • 16.1. Global Market Share Analysis 2024
                                                                  • 16.2. Company Profiles
                                                                    • 16.2.1 PT Sartika Clove Trading
                                                                      • 16.2.1.1. Overview
                                                                      • 16.2.1.2. Products
                                                                      • 16.2.1.3. SWOT Analysis
                                                                      • 16.2.1.4. Recent Developments
                                                                      • 16.2.1.5. Financials (Based on Availability)
                                                                    • 16.2.2 Tanjung Sari Clove Trading
                                                                      • 16.2.2.1. Overview
                                                                      • 16.2.2.2. Products
                                                                      • 16.2.2.3. SWOT Analysis
                                                                      • 16.2.2.4. Recent Developments
                                                                      • 16.2.2.5. Financials (Based on Availability)
                                                                    • 16.2.3 PT Indoceylon Clove
                                                                      • 16.2.3.1. Overview
                                                                      • 16.2.3.2. Products
                                                                      • 16.2.3.3. SWOT Analysis
                                                                      • 16.2.3.4. Recent Developments
                                                                      • 16.2.3.5. Financials (Based on Availability)
                                                                    • 16.2.4 PT Maju Clove Trading
                                                                      • 16.2.4.1. Overview
                                                                      • 16.2.4.2. Products
                                                                      • 16.2.4.3. SWOT Analysis
                                                                      • 16.2.4.4. Recent Developments
                                                                      • 16.2.4.5. Financials (Based on Availability)
                                                                    • 16.2.5 PT Clove Nusantara
                                                                      • 16.2.5.1. Overview
                                                                      • 16.2.5.2. Products
                                                                      • 16.2.5.3. SWOT Analysis
                                                                      • 16.2.5.4. Recent Developments
                                                                      • 16.2.5.5. Financials (Based on Availability)

                                                              List of Figures

                                                              1. Figure 1: Global Clove Industry Revenue Breakdown (Million, %) by Region 2024 & 2032
                                                              2. Figure 2: North America Clove Industry Revenue (Million), by Country 2024 & 2032
                                                              3. Figure 3: North America Clove Industry Revenue Share (%), by Country 2024 & 2032
                                                              4. Figure 4: Europe Clove Industry Revenue (Million), by Country 2024 & 2032
                                                              5. Figure 5: Europe Clove Industry Revenue Share (%), by Country 2024 & 2032
                                                              6. Figure 6: Asia Pacific Clove Industry Revenue (Million), by Country 2024 & 2032
                                                              7. Figure 7: Asia Pacific Clove Industry Revenue Share (%), by Country 2024 & 2032
                                                              8. Figure 8: South America Clove Industry Revenue (Million), by Country 2024 & 2032
                                                              9. Figure 9: South America Clove Industry Revenue Share (%), by Country 2024 & 2032
                                                              10. Figure 10: MEA Clove Industry Revenue (Million), by Country 2024 & 2032
                                                              11. Figure 11: MEA Clove Industry Revenue Share (%), by Country 2024 & 2032
                                                              12. Figure 12: North America Clove Industry Revenue (Million), by Production Analysis 2024 & 2032
                                                              13. Figure 13: North America Clove Industry Revenue Share (%), by Production Analysis 2024 & 2032
                                                              14. Figure 14: North America Clove Industry Revenue (Million), by Consumption Analysis 2024 & 2032
                                                              15. Figure 15: North America Clove Industry Revenue Share (%), by Consumption Analysis 2024 & 2032
                                                              16. Figure 16: North America Clove Industry Revenue (Million), by Import Market Analysis (Value & Volume) 2024 & 2032
                                                              17. Figure 17: North America Clove Industry Revenue Share (%), by Import Market Analysis (Value & Volume) 2024 & 2032
                                                              18. Figure 18: North America Clove Industry Revenue (Million), by Export Market Analysis (Value & Volume) 2024 & 2032
                                                              19. Figure 19: North America Clove Industry Revenue Share (%), by Export Market Analysis (Value & Volume) 2024 & 2032
                                                              20. Figure 20: North America Clove Industry Revenue (Million), by Price Trend Analysis 2024 & 2032
                                                              21. Figure 21: North America Clove Industry Revenue Share (%), by Price Trend Analysis 2024 & 2032
                                                              22. Figure 22: North America Clove Industry Revenue (Million), by Country 2024 & 2032
                                                              23. Figure 23: North America Clove Industry Revenue Share (%), by Country 2024 & 2032
                                                              24. Figure 24: Europe Clove Industry Revenue (Million), by Production Analysis 2024 & 2032
                                                              25. Figure 25: Europe Clove Industry Revenue Share (%), by Production Analysis 2024 & 2032
                                                              26. Figure 26: Europe Clove Industry Revenue (Million), by Consumption Analysis 2024 & 2032
                                                              27. Figure 27: Europe Clove Industry Revenue Share (%), by Consumption Analysis 2024 & 2032
                                                              28. Figure 28: Europe Clove Industry Revenue (Million), by Import Market Analysis (Value & Volume) 2024 & 2032
                                                              29. Figure 29: Europe Clove Industry Revenue Share (%), by Import Market Analysis (Value & Volume) 2024 & 2032
                                                              30. Figure 30: Europe Clove Industry Revenue (Million), by Export Market Analysis (Value & Volume) 2024 & 2032
                                                              31. Figure 31: Europe Clove Industry Revenue Share (%), by Export Market Analysis (Value & Volume) 2024 & 2032
                                                              32. Figure 32: Europe Clove Industry Revenue (Million), by Price Trend Analysis 2024 & 2032
                                                              33. Figure 33: Europe Clove Industry Revenue Share (%), by Price Trend Analysis 2024 & 2032
                                                              34. Figure 34: Europe Clove Industry Revenue (Million), by Country 2024 & 2032
                                                              35. Figure 35: Europe Clove Industry Revenue Share (%), by Country 2024 & 2032
                                                              36. Figure 36: Asia Pacific Clove Industry Revenue (Million), by Production Analysis 2024 & 2032
                                                              37. Figure 37: Asia Pacific Clove Industry Revenue Share (%), by Production Analysis 2024 & 2032
                                                              38. Figure 38: Asia Pacific Clove Industry Revenue (Million), by Consumption Analysis 2024 & 2032
                                                              39. Figure 39: Asia Pacific Clove Industry Revenue Share (%), by Consumption Analysis 2024 & 2032
                                                              40. Figure 40: Asia Pacific Clove Industry Revenue (Million), by Import Market Analysis (Value & Volume) 2024 & 2032
                                                              41. Figure 41: Asia Pacific Clove Industry Revenue Share (%), by Import Market Analysis (Value & Volume) 2024 & 2032
                                                              42. Figure 42: Asia Pacific Clove Industry Revenue (Million), by Export Market Analysis (Value & Volume) 2024 & 2032
                                                              43. Figure 43: Asia Pacific Clove Industry Revenue Share (%), by Export Market Analysis (Value & Volume) 2024 & 2032
                                                              44. Figure 44: Asia Pacific Clove Industry Revenue (Million), by Price Trend Analysis 2024 & 2032
                                                              45. Figure 45: Asia Pacific Clove Industry Revenue Share (%), by Price Trend Analysis 2024 & 2032
                                                              46. Figure 46: Asia Pacific Clove Industry Revenue (Million), by Country 2024 & 2032
                                                              47. Figure 47: Asia Pacific Clove Industry Revenue Share (%), by Country 2024 & 2032
                                                              48. Figure 48: Middle East Clove Industry Revenue (Million), by Production Analysis 2024 & 2032
                                                              49. Figure 49: Middle East Clove Industry Revenue Share (%), by Production Analysis 2024 & 2032
                                                              50. Figure 50: Middle East Clove Industry Revenue (Million), by Consumption Analysis 2024 & 2032
                                                              51. Figure 51: Middle East Clove Industry Revenue Share (%), by Consumption Analysis 2024 & 2032
                                                              52. Figure 52: Middle East Clove Industry Revenue (Million), by Import Market Analysis (Value & Volume) 2024 & 2032
                                                              53. Figure 53: Middle East Clove Industry Revenue Share (%), by Import Market Analysis (Value & Volume) 2024 & 2032
                                                              54. Figure 54: Middle East Clove Industry Revenue (Million), by Export Market Analysis (Value & Volume) 2024 & 2032
                                                              55. Figure 55: Middle East Clove Industry Revenue Share (%), by Export Market Analysis (Value & Volume) 2024 & 2032
                                                              56. Figure 56: Middle East Clove Industry Revenue (Million), by Price Trend Analysis 2024 & 2032
                                                              57. Figure 57: Middle East Clove Industry Revenue Share (%), by Price Trend Analysis 2024 & 2032
                                                              58. Figure 58: Middle East Clove Industry Revenue (Million), by Country 2024 & 2032
                                                              59. Figure 59: Middle East Clove Industry Revenue Share (%), by Country 2024 & 2032
                                                              60. Figure 60: Madagascar Clove Industry Revenue (Million), by Production Analysis 2024 & 2032
                                                              61. Figure 61: Madagascar Clove Industry Revenue Share (%), by Production Analysis 2024 & 2032
                                                              62. Figure 62: Madagascar Clove Industry Revenue (Million), by Consumption Analysis 2024 & 2032
                                                              63. Figure 63: Madagascar Clove Industry Revenue Share (%), by Consumption Analysis 2024 & 2032
                                                              64. Figure 64: Madagascar Clove Industry Revenue (Million), by Import Market Analysis (Value & Volume) 2024 & 2032
                                                              65. Figure 65: Madagascar Clove Industry Revenue Share (%), by Import Market Analysis (Value & Volume) 2024 & 2032
                                                              66. Figure 66: Madagascar Clove Industry Revenue (Million), by Export Market Analysis (Value & Volume) 2024 & 2032
                                                              67. Figure 67: Madagascar Clove Industry Revenue Share (%), by Export Market Analysis (Value & Volume) 2024 & 2032
                                                              68. Figure 68: Madagascar Clove Industry Revenue (Million), by Price Trend Analysis 2024 & 2032
                                                              69. Figure 69: Madagascar Clove Industry Revenue Share (%), by Price Trend Analysis 2024 & 2032
                                                              70. Figure 70: Madagascar Clove Industry Revenue (Million), by Country 2024 & 2032
                                                              71. Figure 71: Madagascar Clove Industry Revenue Share (%), by Country 2024 & 2032

                                                              List of Tables

                                                              1. Table 1: Global Clove Industry Revenue Million Forecast, by Region 2019 & 2032
                                                              2. Table 2: Global Clove Industry Revenue Million Forecast, by Production Analysis 2019 & 2032
                                                              3. Table 3: Global Clove Industry Revenue Million Forecast, by Consumption Analysis 2019 & 2032
                                                              4. Table 4: Global Clove Industry Revenue Million Forecast, by Import Market Analysis (Value & Volume) 2019 & 2032
                                                              5. Table 5: Global Clove Industry Revenue Million Forecast, by Export Market Analysis (Value & Volume) 2019 & 2032
                                                              6. Table 6: Global Clove Industry Revenue Million Forecast, by Price Trend Analysis 2019 & 2032
                                                              7. Table 7: Global Clove Industry Revenue Million Forecast, by Region 2019 & 2032
                                                              8. Table 8: Global Clove Industry Revenue Million Forecast, by Country 2019 & 2032
                                                              9. Table 9: United States Clove Industry Revenue (Million) Forecast, by Application 2019 & 2032
                                                              10. Table 10: Canada Clove Industry Revenue (Million) Forecast, by Application 2019 & 2032
                                                              11. Table 11: Mexico Clove Industry Revenue (Million) Forecast, by Application 2019 & 2032
                                                              12. Table 12: Global Clove Industry Revenue Million Forecast, by Country 2019 & 2032
                                                              13. Table 13: Germany Clove Industry Revenue (Million) Forecast, by Application 2019 & 2032
                                                              14. Table 14: United Kingdom Clove Industry Revenue (Million) Forecast, by Application 2019 & 2032
                                                              15. Table 15: France Clove Industry Revenue (Million) Forecast, by Application 2019 & 2032
                                                              16. Table 16: Spain Clove Industry Revenue (Million) Forecast, by Application 2019 & 2032
                                                              17. Table 17: Italy Clove Industry Revenue (Million) Forecast, by Application 2019 & 2032
                                                              18. Table 18: Spain Clove Industry Revenue (Million) Forecast, by Application 2019 & 2032
                                                              19. Table 19: Belgium Clove Industry Revenue (Million) Forecast, by Application 2019 & 2032
                                                              20. Table 20: Netherland Clove Industry Revenue (Million) Forecast, by Application 2019 & 2032
                                                              21. Table 21: Nordics Clove Industry Revenue (Million) Forecast, by Application 2019 & 2032
                                                              22. Table 22: Rest of Europe Clove Industry Revenue (Million) Forecast, by Application 2019 & 2032
                                                              23. Table 23: Global Clove Industry Revenue Million Forecast, by Country 2019 & 2032
                                                              24. Table 24: China Clove Industry Revenue (Million) Forecast, by Application 2019 & 2032
                                                              25. Table 25: Japan Clove Industry Revenue (Million) Forecast, by Application 2019 & 2032
                                                              26. Table 26: India Clove Industry Revenue (Million) Forecast, by Application 2019 & 2032
                                                              27. Table 27: South Korea Clove Industry Revenue (Million) Forecast, by Application 2019 & 2032
                                                              28. Table 28: Southeast Asia Clove Industry Revenue (Million) Forecast, by Application 2019 & 2032
                                                              29. Table 29: Australia Clove Industry Revenue (Million) Forecast, by Application 2019 & 2032
                                                              30. Table 30: Indonesia Clove Industry Revenue (Million) Forecast, by Application 2019 & 2032
                                                              31. Table 31: Phillipes Clove Industry Revenue (Million) Forecast, by Application 2019 & 2032
                                                              32. Table 32: Singapore Clove Industry Revenue (Million) Forecast, by Application 2019 & 2032
                                                              33. Table 33: Thailandc Clove Industry Revenue (Million) Forecast, by Application 2019 & 2032
                                                              34. Table 34: Rest of Asia Pacific Clove Industry Revenue (Million) Forecast, by Application 2019 & 2032
                                                              35. Table 35: Global Clove Industry Revenue Million Forecast, by Country 2019 & 2032
                                                              36. Table 36: Brazil Clove Industry Revenue (Million) Forecast, by Application 2019 & 2032
                                                              37. Table 37: Argentina Clove Industry Revenue (Million) Forecast, by Application 2019 & 2032
                                                              38. Table 38: Peru Clove Industry Revenue (Million) Forecast, by Application 2019 & 2032
                                                              39. Table 39: Chile Clove Industry Revenue (Million) Forecast, by Application 2019 & 2032
                                                              40. Table 40: Colombia Clove Industry Revenue (Million) Forecast, by Application 2019 & 2032
                                                              41. Table 41: Ecuador Clove Industry Revenue (Million) Forecast, by Application 2019 & 2032
                                                              42. Table 42: Venezuela Clove Industry Revenue (Million) Forecast, by Application 2019 & 2032
                                                              43. Table 43: Rest of South America Clove Industry Revenue (Million) Forecast, by Application 2019 & 2032
                                                              44. Table 44: Global Clove Industry Revenue Million Forecast, by Country 2019 & 2032
                                                              45. Table 45: United Arab Emirates Clove Industry Revenue (Million) Forecast, by Application 2019 & 2032
                                                              46. Table 46: Saudi Arabia Clove Industry Revenue (Million) Forecast, by Application 2019 & 2032
                                                              47. Table 47: South Africa Clove Industry Revenue (Million) Forecast, by Application 2019 & 2032
                                                              48. Table 48: Rest of Middle East and Africa Clove Industry Revenue (Million) Forecast, by Application 2019 & 2032
                                                              49. Table 49: Global Clove Industry Revenue Million Forecast, by Production Analysis 2019 & 2032
                                                              50. Table 50: Global Clove Industry Revenue Million Forecast, by Consumption Analysis 2019 & 2032
                                                              51. Table 51: Global Clove Industry Revenue Million Forecast, by Import Market Analysis (Value & Volume) 2019 & 2032
                                                              52. Table 52: Global Clove Industry Revenue Million Forecast, by Export Market Analysis (Value & Volume) 2019 & 2032
                                                              53. Table 53: Global Clove Industry Revenue Million Forecast, by Price Trend Analysis 2019 & 2032
                                                              54. Table 54: Global Clove Industry Revenue Million Forecast, by Country 2019 & 2032
                                                              55. Table 55: United States Clove Industry Revenue (Million) Forecast, by Application 2019 & 2032
                                                              56. Table 56: Global Clove Industry Revenue Million Forecast, by Production Analysis 2019 & 2032
                                                              57. Table 57: Global Clove Industry Revenue Million Forecast, by Consumption Analysis 2019 & 2032
                                                              58. Table 58: Global Clove Industry Revenue Million Forecast, by Import Market Analysis (Value & Volume) 2019 & 2032
                                                              59. Table 59: Global Clove Industry Revenue Million Forecast, by Export Market Analysis (Value & Volume) 2019 & 2032
                                                              60. Table 60: Global Clove Industry Revenue Million Forecast, by Price Trend Analysis 2019 & 2032
                                                              61. Table 61: Global Clove Industry Revenue Million Forecast, by Country 2019 & 2032
                                                              62. Table 62: United Kingdom Clove Industry Revenue (Million) Forecast, by Application 2019 & 2032
                                                              63. Table 63: Germany Clove Industry Revenue (Million) Forecast, by Application 2019 & 2032
                                                              64. Table 64: France Clove Industry Revenue (Million) Forecast, by Application 2019 & 2032
                                                              65. Table 65: Global Clove Industry Revenue Million Forecast, by Production Analysis 2019 & 2032
                                                              66. Table 66: Global Clove Industry Revenue Million Forecast, by Consumption Analysis 2019 & 2032
                                                              67. Table 67: Global Clove Industry Revenue Million Forecast, by Import Market Analysis (Value & Volume) 2019 & 2032
                                                              68. Table 68: Global Clove Industry Revenue Million Forecast, by Export Market Analysis (Value & Volume) 2019 & 2032
                                                              69. Table 69: Global Clove Industry Revenue Million Forecast, by Price Trend Analysis 2019 & 2032
                                                              70. Table 70: Global Clove Industry Revenue Million Forecast, by Country 2019 & 2032
                                                              71. Table 71: Indonesia Clove Industry Revenue (Million) Forecast, by Application 2019 & 2032
                                                              72. Table 72: China Clove Industry Revenue (Million) Forecast, by Application 2019 & 2032
                                                              73. Table 73: India Clove Industry Revenue (Million) Forecast, by Application 2019 & 2032
                                                              74. Table 74: Singapore Clove Industry Revenue (Million) Forecast, by Application 2019 & 2032
                                                              75. Table 75: Malaysia Clove Industry Revenue (Million) Forecast, by Application 2019 & 2032
                                                              76. Table 76: Sri Lanka Clove Industry Revenue (Million) Forecast, by Application 2019 & 2032
                                                              77. Table 77: Vietnam Clove Industry Revenue (Million) Forecast, by Application 2019 & 2032
                                                              78. Table 78: Global Clove Industry Revenue Million Forecast, by Production Analysis 2019 & 2032
                                                              79. Table 79: Global Clove Industry Revenue Million Forecast, by Consumption Analysis 2019 & 2032
                                                              80. Table 80: Global Clove Industry Revenue Million Forecast, by Import Market Analysis (Value & Volume) 2019 & 2032
                                                              81. Table 81: Global Clove Industry Revenue Million Forecast, by Export Market Analysis (Value & Volume) 2019 & 2032
                                                              82. Table 82: Global Clove Industry Revenue Million Forecast, by Price Trend Analysis 2019 & 2032
                                                              83. Table 83: Global Clove Industry Revenue Million Forecast, by Country 2019 & 2032
                                                              84. Table 84: Global Clove Industry Revenue Million Forecast, by Production Analysis 2019 & 2032
                                                              85. Table 85: Global Clove Industry Revenue Million Forecast, by Consumption Analysis 2019 & 2032
                                                              86. Table 86: Global Clove Industry Revenue Million Forecast, by Import Market Analysis (Value & Volume) 2019 & 2032
                                                              87. Table 87: Global Clove Industry Revenue Million Forecast, by Export Market Analysis (Value & Volume) 2019 & 2032
                                                              88. Table 88: Global Clove Industry Revenue Million Forecast, by Price Trend Analysis 2019 & 2032
                                                              89. Table 89: Global Clove Industry Revenue Million Forecast, by Country 2019 & 2032
                                                              90. Table 90: Kingdom of Saudi Arabia Clove Industry Revenue (Million) Forecast, by Application 2019 & 2032
                                                              91. Table 91: United Arab Emirates Clove Industry Revenue (Million) Forecast, by Application 2019 & 2032
                                                              92. Table 92: Kenya Clove Industry Revenue (Million) Forecast, by Application 2019 & 2032
                                                              93. Table 93: Comoros Clove Industry Revenue (Million) Forecast, by Application 2019 & 2032
                                                              94. Table 94: Tanzania Clove Industry Revenue (Million) Forecast, by Application 2019 & 2032


                                                              Frequently Asked Questions

                                                              1. What is the projected Compound Annual Growth Rate (CAGR) of the Clove Industry?

                                                              The projected CAGR is approximately 3.70%.

                                                              2. Which companies are prominent players in the Clove Industry?

                                                              Key companies in the market include PT Sartika Clove Trading , Tanjung Sari Clove Trading , PT Indoceylon Clove , PT Maju Clove Trading , PT Clove Nusantara.

                                                              3. What are the main segments of the Clove Industry?

                                                              The market segments include Production Analysis, Consumption Analysis, Import Market Analysis (Value & Volume), Export Market Analysis (Value & Volume), Price Trend Analysis.

                                                              4. Can you provide details about the market size?

                                                              The market size is estimated to be USD 5.80 Million as of 2022.

                                                              5. What are some drivers contributing to market growth?

                                                              Increasing Demand for Garlic Due to Various Uses in Industries; Rising Demad of Organic Garlic; Increasing Government Initiatives.

                                                              6. What are the notable trends driving market growth?

                                                              Increased Demand from Various Industries is Aiding the Production.

                                                              7. Are there any restraints impacting market growth?

                                                              Lack of Technical Knowledge of Farmers; Price Fluctuations.

                                                              8. Can you provide examples of recent developments in the market?

                                                              N/A

                                                              9. What pricing options are available for accessing the report?

                                                              Pricing options include single-user, multi-user, and enterprise licenses priced at USD 4750, USD 5250, and USD 8750 respectively.

                                                              10. Is the market size provided in terms of value or volume?

                                                              The market size is provided in terms of value, measured in Million.

                                                              11. Are there any specific market keywords associated with the report?

                                                              Yes, the market keyword associated with the report is "Clove Industry," which aids in identifying and referencing the specific market segment covered.

                                                              12. How do I determine which pricing option suits my needs best?

                                                              The pricing options vary based on user requirements and access needs. Individual users may opt for single-user licenses, while businesses requiring broader access may choose multi-user or enterprise licenses for cost-effective access to the report.

                                                              13. Are there any additional resources or data provided in the Clove Industry report?

                                                              While the report offers comprehensive insights, it's advisable to review the specific contents or supplementary materials provided to ascertain if additional resources or data are available.

                                                              14. How can I stay updated on further developments or reports in the Clove Industry?

                                                              To stay informed about further developments, trends, and reports in the Clove Industry, consider subscribing to industry newsletters, following relevant companies and organizations, or regularly checking reputable industry news sources and publications.


                                                              Methodology

                                                              Step 1 - Identification of Relevant Samples Size from Population Database

                                                              Step Chart
                                                              Bar Chart
                                                              Method Chart

                                                              Step 2 - Approaches for Defining Global Market Size (Value, Volume* & Price*)

                                                              Approach Chart
                                                              Top-down and bottom-up approaches are used to validate the global market size and estimate the market size for manufactures, regional segments, product, and application.

                                                              Note*: In applicable scenarios

                                                              Step 3 - Data Sources

                                                              Primary Research

                                                              • Web Analytics
                                                              • Survey Reports
                                                              • Research Institute
                                                              • Latest Research Reports
                                                              • Opinion Leaders

                                                              Secondary Research

                                                              • Annual Reports
                                                              • White Paper
                                                              • Latest Press Release
                                                              • Industry Association
                                                              • Paid Database
                                                              • Investor Presentations
                                                              Analyst Chart

                                                              Step 4 - Data Triangulation

                                                              Involves using different sources of information in order to increase the validity of a study

                                                              These sources are likely to be stakeholders in a program - participants, other researchers, program staff, other community members, and so on.

                                                              Then we put all data in single framework & apply various statistical tools to find out the dynamic on the market.

                                                              During the analysis stage, feedback from the stakeholder groups would be compared to determine areas of agreement as well as areas of divergence

                                                              Additionally, after gathering mixed and scattered data from a wide range of sources, data is triangulated and correlated to come up with estimated figures which are further validated through primary mediums or industry experts, opinion leaders.

                                                              About Visionary Data Reports

                                                              Visionary Data Reports provides future-focused market research, advanced analytics, and strategic insights for technology, healthcare, green energy, and finance. Our reports help you anticipate trends, innovate, and lead in your industry. Our expert team combines primary research, data science, and industry knowledge to deliver actionable intelligence. We offer syndicated reports, custom analytics, and consulting services tailored to your business needs. At Visionary Data Reports, we are committed to quality, transparency, and client satisfaction. Every report is rigorously validated to ensure accuracy and relevance. Our global perspective and forward-thinking approach help you understand both current and emerging market dynamics.

                                                              Stay ahead with Visionary Data Reports. Subscribe to our newsletter for the latest insights and research highlights, and follow us on social media for real-time updates. Visionary Data Reports – Your Guide to Tomorrow’s Opportunities.

                                                              artwork spiralartwork spiralRelated Reports
                                                              artwork underline

                                                              Sudan Alfalfa Market Trends and Forecasts: Comprehensive Insights

                                                              Discover the booming Sudan alfalfa market! Projected to reach $373.33 million by 2033, with a 5.5% CAGR, this report analyzes market drivers, trends, and key players like Syngenta and DLF Seeds across segments including hay, pellets & seeds for livestock and human consumption. Explore regional data and investment opportunities.

                                                              July 2025
                                                              Base Year: 2024
                                                              No Of Pages: 150
                                                              Price: $3800

                                                              North America Specialty Fertilizer Market 2025-2033 Overview: Trends, Competitor Dynamics, and Opportunities

                                                              The North American specialty fertilizer market is experiencing robust growth, driven by precision agriculture, sustainable farming practices, and demand for high-yield crops. Explore market size, CAGR, key players (Koch Industries, Mosaic, Nutrien), and regional trends (US, Canada, Mexico) in this in-depth analysis. Discover opportunities and challenges in the liquid, slow-release, and water-soluble fertilizer segments.

                                                              July 2025
                                                              Base Year: 2024
                                                              No Of Pages: 197
                                                              Price: $3800

                                                              Europe Chia Seeds Market Market’s Role in Emerging Tech: Insights and Projections 2025-2033

                                                              Discover the booming European chia seeds market! This in-depth analysis reveals market size, CAGR, key players (The Chia Company, Salba, Nutiva), and growth drivers. Explore trends in packaging, applications (food, supplements, personal care), and regional variations. Learn how this €414.20 million market is poised for significant expansion.

                                                              July 2025
                                                              Base Year: 2024
                                                              No Of Pages: 180
                                                              Price: $4750

                                                              Drivers of Change in Thailand Vegetable Seed Market Market 2025-2033

                                                              Discover the thriving Thailand vegetable seed market's growth trajectory (CAGR 5.20%), driven by consumer demand and technological advancements. Explore market segmentation, key players, and challenges impacting this dynamic sector projected to reach $XXX million by 2033.

                                                              July 2025
                                                              Base Year: 2024
                                                              No Of Pages: 150
                                                              Price: $3800

                                                              Consumer Trends Driving Indonesia Fungicide Market Market Growth

                                                              Discover the booming Indonesia Fungicide Market! This report reveals a projected 16.50% CAGR from 2025-2033, driven by rising disease prevalence, advanced application methods, and government support. Learn about market size, key players (Bayer, Syngenta, BASF), and future trends impacting this dynamic agricultural sector.

                                                              July 2025
                                                              Base Year: 2024
                                                              No Of Pages: 197
                                                              Price: $3800

                                                              Tomato Seed Market 2025-2033 Overview: Trends, Competitor Dynamics, and Opportunities

                                                              Discover the booming global tomato seed market! This comprehensive analysis reveals key trends, growth drivers (hybrid seeds, protected cultivation), restraints, and regional insights (Asia-Pacific leading) for the period 2019-2033, featuring top players like Sakata Seeds and Syngenta. Projected CAGR of 4.70% showcases significant investment opportunities.

                                                              July 2025
                                                              Base Year: 2024
                                                              No Of Pages: 180
                                                              Price: $3800

                                                              Emerging Trends in Brazil Maize Market: A Technology Perspective 2025-2033

                                                              Discover the dynamic Brazil maize market forecast (2025-2033)! This in-depth analysis reveals key growth drivers, including animal feed, biofuel, and human consumption, alongside major players like Syngenta and Corteva. Explore market size, CAGR, and regional insights to understand this lucrative opportunity.

                                                              July 2025
                                                              Base Year: 2024
                                                              No Of Pages: 180
                                                              Price: $3800

                                                              Future Forecasts for North America Seed Treatment Market Industry Growth

                                                              Discover the booming North American seed treatment market! This in-depth analysis reveals a CAGR of 4.20% (2025-2033), driven by precision farming, pest control needs, and government support. Explore key players, market segments (fungicides, insecticides, crops), and regional trends in the US, Canada, and Mexico. Get the data-driven insights you need to succeed.

                                                              July 2025
                                                              Base Year: 2024
                                                              No Of Pages: 150
                                                              Price: $3800

                                                              Africa Chia Seeds Industry Market’s Drivers and Challenges: Strategic Overview 2025-2033

                                                              Discover the booming African chia seed market! Our analysis reveals a $13.87M market in 2025, projected to grow at a 2.10% CAGR through 2033. Explore key trends, segments (organic, hybrid, processed, omega-3 rich), applications (food & beverage, supplements, personal care), and leading companies. Get insights for investment and market entry.

                                                              July 2025
                                                              Base Year: 2024
                                                              No Of Pages: 180
                                                              Price: $4750

                                                              Strategic Trends in Asia-Pacific Seed Coating Materials Market Market 2025-2033

                                                              The Asia-Pacific seed coating materials market is booming, with an 8% CAGR. Discover key trends, leading companies (BASF, Bayer), and segment analysis (polymers, colorants) driving growth in this $XX million market. Explore the forecast to 2033.

                                                              July 2025
                                                              Base Year: 2024
                                                              No Of Pages: 150
                                                              Price: $3800

                                                              Comprehensive Review of UK Fruits and Vegetables Market Growth Potential

                                                              Discover the booming UK fruits and vegetables market! This in-depth analysis reveals a £31.58 billion market with a 2.97% CAGR (2025-2033), driven by health trends and major players like Tesco and Sainsbury's. Explore regional data, consumption patterns, and future growth potential.

                                                              July 2025
                                                              Base Year: 2024
                                                              No Of Pages: 180
                                                              Price: $3800

                                                              Malaysia Agrochemical Market Market’s Drivers and Challenges: Strategic Overview 2025-2033

                                                              Discover the booming Malaysian agrochemical market! This comprehensive analysis reveals a RM 679.59 million market in 2025, projected to grow at a 4.56% CAGR until 2033. Explore key drivers, trends, restraints, and leading companies shaping this dynamic sector. Learn about fertilizers, pesticides, and other agrochemical segments.

                                                              July 2025
                                                              Base Year: 2024
                                                              No Of Pages: 150
                                                              Price: $3800

                                                              Drivers of Change in Agricultural Surfactant Market Market 2025-2033

                                                              The global agricultural surfactant market is booming, projected to reach $3.56 billion by 2033 with a 6.70% CAGR. Driven by precision agriculture and sustainable farming, this market analysis explores key segments (anionic, nonionic, bio-based), top players (BASF, Clariant), and regional growth trends. Discover the future of agricultural surfactants.

                                                              July 2025
                                                              Base Year: 2024
                                                              No Of Pages: 234
                                                              Price: $4750

                                                              Cameroon Grains Industry Industry Analysis and Consumer Behavior

                                                              Discover the booming Cameroon grains industry! Explore market size, growth trends (4.80% CAGR), key players (Sodecoton, CDC, etc.), and challenges impacting cereals, pulses, and oilseeds in Cameroon from 2019-2033. Invest wisely in this promising African market.

                                                              July 2025
                                                              Base Year: 2024
                                                              No Of Pages: 180
                                                              Price: $3800

                                                              Analyzing Consumer Behavior in Agriculture Market in Tanzania Market

                                                              Discover the booming Tanzanian agriculture market! Projected to reach $17.44 billion in 2025, with a 5.63% CAGR, this report analyzes market size, key players (Syngenta, Rijk Zwaan), growth drivers, and future trends in Tanzania's agricultural sector. Explore market segments, including food crops and investment opportunities.

                                                              July 2025
                                                              Base Year: 2024
                                                              No Of Pages: 150
                                                              Price: $3800

                                                              Analyzing Consumer Behavior in Artificial Intelligence in Agriculture Industry Market

                                                              Discover the booming AI in Agriculture market! This comprehensive analysis reveals a 4.20% CAGR, key drivers, trends, restraints, and regional insights from 2019-2033. Learn about leading companies and applications like precision farming, drone analytics, and weather tracking. Explore market size projections and future growth potential.

                                                              July 2025
                                                              Base Year: 2024
                                                              No Of Pages: 150
                                                              Price: $4750

                                                              Exploring Forestry Machinery Market’s Market Size Dynamics 2025-2033

                                                              The global forestry machinery market is booming, projected to reach $15 billion by 2033, driven by rising timber demand and technological advancements. Explore market trends, key players (Deere, Komatsu, etc.), and regional growth in our comprehensive analysis.

                                                              July 2025
                                                              Base Year: 2024
                                                              No Of Pages: 150
                                                              Price: $4750

                                                              Nutrition Canary Seed Market Competitive Strategies: Trends and Forecasts 2025-2033

                                                              Discover the booming nutrition canary seed market! Explore key trends, growth drivers, and regional market share projections for 2025-2033. Learn about leading companies and the increasing demand driven by health-conscious consumers and the birdseed industry.

                                                              July 2025
                                                              Base Year: 2024
                                                              No Of Pages: 234
                                                              Price: $4750

                                                              Consumer Behavior and Cashews Market in South America Trends

                                                              Discover the booming South American cashew market! This comprehensive analysis reveals a $582.24 million market in 2025, projected to grow at a 5.20% CAGR through 2033. Explore key trends, drivers, and leading companies shaping this lucrative industry.

                                                              July 2025
                                                              Base Year: 2024
                                                              No Of Pages: 180
                                                              Price: $3800

                                                              Strategic Growth Drivers for Rye Industry Market

                                                              Discover the latest market analysis of the global rye industry, projecting a steady CAGR of 2.20% to 2033. Explore key drivers, restraints, and regional trends impacting the growth of rye in food, feed, and beverage applications. Learn about leading companies and future market opportunities.

                                                              July 2025
                                                              Base Year: 2024
                                                              No Of Pages: 234
                                                              Price: $4750
                                                              • Home
                                                              • About Us
                                                              • Industries
                                                                • Aerospace & Defense
                                                                • Agriculture
                                                                • Animal Nutrition & Wellness
                                                                • Automotive
                                                                • Chemicals & Materials
                                                                • Consumer Goods and Services
                                                                • Energy & Power
                                                                • Financial Services and Investment Intelligence
                                                                • Food & Beverage
                                                                • Home and Property Improvement
                                                                • Hospitality and Tourism
                                                                • Logistics
                                                                • Manufacturing Products and Services
                                                                • Packaging
                                                                • Professional and Commercial Services
                                                                • Real Estate and Construction
                                                                • Retail
                                                                • Technology, Media and Telecom
                                                                • Healthcare
                                                              • Services
                                                              • Contact
                                                              Main Logo
                                                              • Home
                                                              • About Us
                                                              • Industries
                                                                • Aerospace & Defense
                                                                • Agriculture
                                                                • Animal Nutrition & Wellness
                                                                • Automotive
                                                                • Chemicals & Materials
                                                                • Consumer Goods and Services
                                                                • Energy & Power
                                                                • Financial Services and Investment Intelligence
                                                                • Food & Beverage
                                                                • Home and Property Improvement
                                                                • Hospitality and Tourism
                                                                • Logistics
                                                                • Manufacturing Products and Services
                                                                • Packaging
                                                                • Professional and Commercial Services
                                                                • Real Estate and Construction
                                                                • Retail
                                                                • Technology, Media and Telecom
                                                                • Healthcare
                                                              • Services
                                                              • Contact
                                                              +17162654855
                                                              [email protected]

                                                              +17162654855

                                                              [email protected]

                                                              Business Address

                                                              Head Office

                                                              Office no. A 5010, fifth floor, Solitaire Business Hub, Near Phoenix mall, Pune, Maharashtra 411014

                                                              Contact Information

                                                              Craig Francis

                                                              Business Development Head

                                                              +17162654855

                                                              [email protected]

                                                              Connect With Us

                                                              Secure Payment Partners

                                                              payment image
                                                              RetailLogisticsPackagingAutomotiveHealthcareAgricultureEnergy & PowerFood & BeverageAerospace & DefenseChemicals & MaterialsHospitality and TourismAnimal Nutrition & WellnessConsumer Goods and ServicesReal Estate and ConstructionHome and Property ImprovementTechnology, Media and TelecomManufacturing Products and ServicesFinancial Services and Investment Intelligence

                                                              © 2025 All rights reserved


                                                              Privacy Policy
                                                              Terms and Conditions
                                                              FAQ