

Key Insights
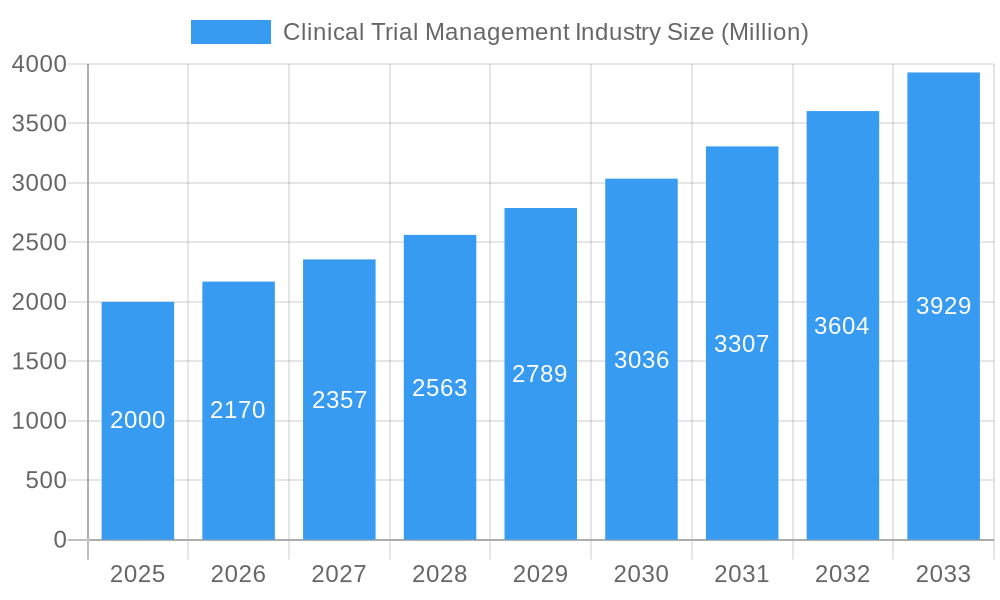
The global Clinical Trial Management (CTM) market is poised for substantial expansion, driven by an escalating volume of clinical trials, the increasing incidence of chronic diseases, and the rapid integration of advanced technologies such as AI and machine learning. These innovations are crucial for optimizing trial efficiency and reducing associated costs. The CTM market was valued at $21 billion in 2025, with a projected Compound Annual Growth Rate (CAGR) of 5.9% from 2025 to 2033. Growth is further propelled by the widespread adoption of scalable, collaborative, and secure cloud-based solutions. Key market drivers include pharmaceutical companies and Contract Research Organizations (CROs), who increasingly depend on CTM software and services for effective management of complex trials. While on-premise solutions are still utilized, the industry trend is a clear shift towards cloud-based delivery models, reflecting a broader digital transformation. The software segment dominates the market, followed by supporting services for implementation, training, and maintenance. Geographically, North America and Europe lead market presence, while the Asia Pacific region is anticipated to witness significant growth due to rising investments in healthcare infrastructure and clinical research. However, navigating regulatory complexities and data privacy concerns remain key challenges.
Clinical Trial Management Industry Market Size (In Billion)
The competitive CTM market features established leaders such as Veeva Systems, Medidata Solutions (Dassault Systèmes), and Oracle Corporation, alongside innovative emerging technology providers. These entities are committed to continuous innovation, integrating advanced analytics and refining user interfaces to deliver comprehensive CTM solutions. Strategic mergers and acquisitions further highlight the market's dynamism and inherent growth potential. While data security and interoperability are critical considerations, the overall market outlook remains highly positive. Consistent demand for efficient and compliant clinical trial management, coupled with ongoing technological advancements, underpins this optimism. The forecast period of 2025-2033 presents considerable opportunities for both established and nascent market participants. Sustained innovation and a steadfast commitment to evolving regulatory standards will be paramount for success in this competitive landscape.
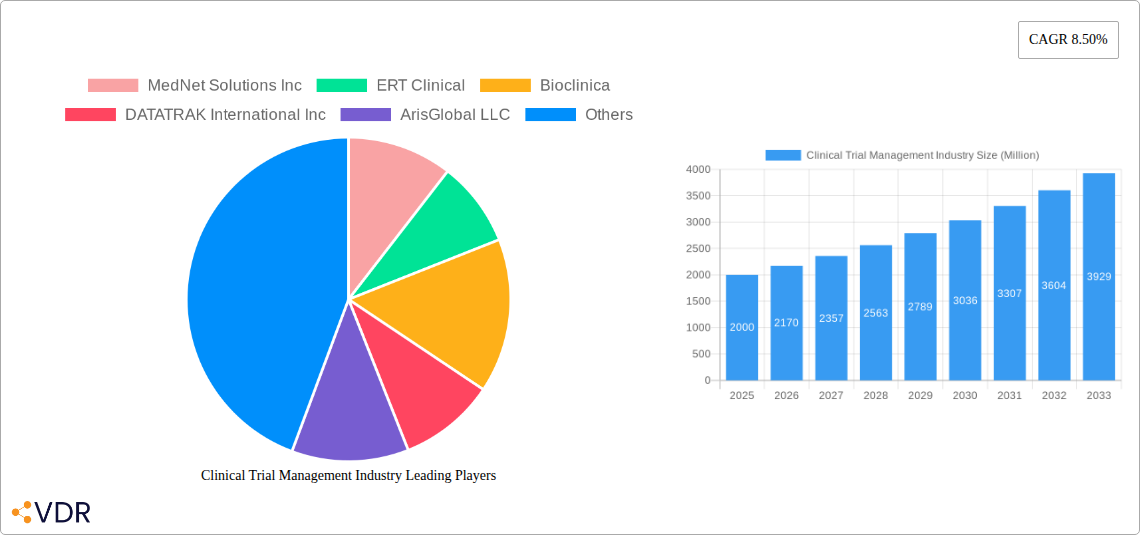
Clinical Trial Management Industry Company Market Share
This comprehensive report provides an in-depth analysis of the Clinical Trial Management (CTM) industry, examining market dynamics, growth trajectories, the competitive environment, and future prospects. The report encompasses the broader Healthcare IT market and the specialized Clinical Trial Management segment. Key market segments analyzed include delivery models (on-premise, cloud-based), core components (software, services), and primary end-users (pharmaceuticals, CROs, others). The study covers the period from 2019-2033, with 2025 designated as the base and estimated year. The forecast period extends from 2025-2033, building upon the historical data from 2019-2024. The market size is projected to reach significant figures by 2033.
Clinical Trial Management Industry Market Dynamics & Structure
The CTM market is characterized by moderate concentration, with key players like Veeva Systems, Medidata Solutions (Dassault Systèmes), and Oracle holding significant shares. Technological innovation, particularly in AI and machine learning for data analysis and automation, is a major driver. Stringent regulatory frameworks like those from the FDA and EMA heavily influence market practices. Competitive substitutes include legacy systems and in-house solutions, but the increasing complexity of trials favors specialized CTM solutions. The end-user demographic is predominantly large pharmaceutical companies and CROs, but smaller biotech firms and academic institutions are growing segments. M&A activity has been consistent, with approximately xx deals annually in the past five years, reflecting consolidation and expansion strategies.
- Market Concentration: Moderately concentrated, with top 5 players holding approximately 55% market share in 2025.
- Technological Innovation: AI, machine learning, and blockchain driving efficiency and data integrity improvements.
- Regulatory Framework: Stringent FDA and EMA regulations influencing software validation and data security practices.
- Competitive Substitutes: Legacy systems and in-house solutions offer limited competition due to scalability and regulatory compliance challenges.
- M&A Activity: Average of xx M&A deals annually (2020-2024), driven by consolidation and expansion.
- Innovation Barriers: High initial investment costs and regulatory compliance complexity.
Clinical Trial Management Industry Growth Trends & Insights
The CTM market exhibited a CAGR of xx% during 2019-2024, driven by increasing clinical trial complexity, growing adoption of cloud-based solutions, and the need for enhanced data management. The market is expected to continue its growth trajectory, with a projected CAGR of xx% during 2025-2033. Cloud-based solutions are experiencing faster adoption rates than on-premise deployments, driven by scalability, cost-effectiveness, and accessibility. The shift toward decentralized clinical trials is fueling demand for innovative CTM solutions that support remote patient monitoring and data collection. Consumer behavior is shifting towards greater patient engagement and data privacy awareness, influencing CTM platform development. Market penetration for cloud-based solutions is projected to reach xx% by 2033.
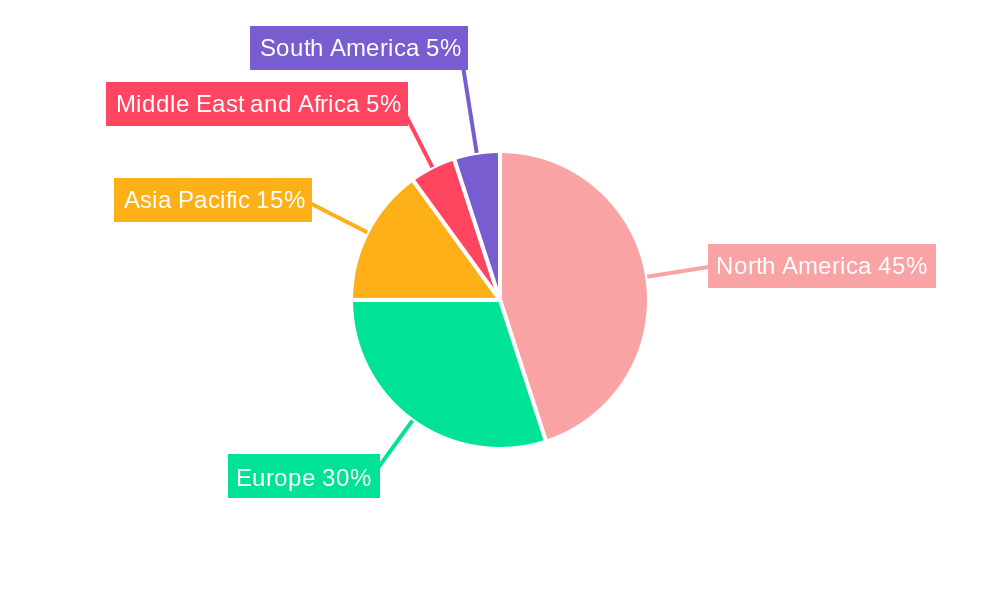
Dominant Regions, Countries, or Segments in Clinical Trial Management Industry
North America remains the dominant region, accounting for approximately xx% of the global market in 2025, driven by high pharmaceutical R&D spending, presence of major CROs, and robust regulatory frameworks. Within North America, the United States holds the largest market share. Europe follows as the second-largest region. The cloud-based delivery mode is experiencing the fastest growth, with a projected market share of xx% by 2033, driven by its scalability and cost-effectiveness. The software component segment holds a larger market share compared to services due to higher initial investment in software solutions. Pharmaceutical companies represent the largest end-user segment.
- Key Drivers (North America): High pharmaceutical R&D spending, presence of major CROs, and robust regulatory frameworks.
- Key Drivers (Cloud-based): Scalability, cost-effectiveness, and accessibility.
- Market Share (2025): North America (xx%), Europe (xx%), Asia Pacific (xx%), Rest of World (xx%).
Clinical Trial Management Industry Product Landscape
CTM solutions are evolving beyond basic data management to incorporate AI-powered analytics, predictive modeling, and automated workflows. The focus is on improving efficiency, reducing costs, and enhancing data quality throughout the clinical trial lifecycle. Unique selling propositions include integrated platforms, robust security features, compliance adherence, and user-friendly interfaces. Technological advancements center around AI-driven insights, advanced analytics, and real-time data visualization.
Key Drivers, Barriers & Challenges in Clinical Trial Management Industry
Key Drivers: Increased clinical trial complexity, growing regulatory scrutiny, demand for faster trial completion times, and the rising adoption of decentralized clinical trials.
Key Challenges: High implementation costs, integration challenges with legacy systems, data security and privacy concerns, and the need for skilled professionals to manage complex CTM systems. The high cost of implementation and integration can hinder adoption, particularly for smaller organizations, which affects the market growth by approximately xx Million annually.
Emerging Opportunities in Clinical Trial Management Industry
Emerging opportunities lie in the integration of wearable sensors for real-time patient data capture, expansion into emerging markets with growing R&D activities, development of specialized CTM solutions for specific therapeutic areas, and the increased focus on patient-centric trial design.
Growth Accelerators in the Clinical Trial Management Industry
Technological breakthroughs in AI and machine learning, strategic partnerships between CTM providers and pharmaceutical companies and CROs, and expansion into underserved markets will be key drivers of long-term growth. Furthermore, the increasing adoption of decentralized clinical trials and the growing demand for improved data management capabilities will fuel the market expansion.
Key Players Shaping the Clinical Trial Management Industry Market
Notable Milestones in Clinical Trial Management Industry Sector
- March 2023: Assentia launched GrantPay and GrantPact, SaaS-based applications for clinical trial contract negotiation and payment services. This significantly improves efficiency and transparency in clinical trial financial management.
- February 2023: Vial partnered with Egnyte to integrate Egnyte's eTMF, enhancing eTMF management, compliance, and audit readiness for Vial's clients. This strengthens their offering in a highly regulated space.
In-Depth Clinical Trial Management Industry Market Outlook
The CTM market is poised for substantial growth, driven by continuous technological advancements, increasing clinical trial complexity, and the ongoing shift towards decentralized clinical trials. Strategic partnerships, expansion into new markets, and the development of innovative solutions will further accelerate market expansion. The focus on data integrity, patient engagement, and regulatory compliance will continue to shape the future of the CTM industry.
Clinical Trial Management Industry Segmentation
-
1. Delivery Mode
- 1.1. On-premise
- 1.2. Cloud-based
-
2. Component
- 2.1. Software
- 2.2. Services
-
3. End User
- 3.1. Pharmaceuticals
- 3.2. Contract Research Organization
- 3.3. Other End Users
Clinical Trial Management Industry Segmentation By Geography
-
1. North America
- 1.1. United States
- 1.2. Canada
- 1.3. Mexico
-
2. Europe
- 2.1. Germany
- 2.2. United Kingdom
- 2.3. France
- 2.4. Italy
- 2.5. Spain
- 2.6. Rest of Europe
-
3. Asia Pacific
- 3.1. China
- 3.2. Japan
- 3.3. India
- 3.4. Australia
- 3.5. South Korea
- 3.6. Rest of Asia Pacific
-
4. Middle East and Africa
- 4.1. GCC
- 4.2. South Africa
- 4.3. Rest of Middle East and Africa
-
5. South America
- 5.1. Brazil
- 5.2. Argentina
- 5.3. Rest of South America
Clinical Trial Management Industry Regional Market Share
Geographic Coverage of Clinical Trial Management Industry
Clinical Trial Management Industry REPORT HIGHLIGHTS
| Aspects | Details |
|---|---|
| Study Period | 2020-2034 |
| Base Year | 2025 |
| Estimated Year | 2026 |
| Forecast Period | 2026-2034 |
| Historical Period | 2020-2025 |
| Growth Rate | CAGR of 5.9% from 2020-2034 |
| Segmentation |
|
Table of Contents
- 1. Introduction
- 1.1. Research Scope
- 1.2. Market Segmentation
- 1.3. Research Objective
- 1.4. Definitions and Assumptions
- 2. Executive Summary
- 2.1. Market Snapshot
- 3. Market Dynamics
- 3.1. Market Drivers
- 3.2. Market Restrains
- 3.3. Market Trends
- 3.4. Market Opportunities
- 4. Market Factor Analysis
- 4.1. Porters Five Forces
- 4.1.1. Bargaining Power of Suppliers
- 4.1.2. Bargaining Power of Buyers
- 4.1.3. Threat of New Entrants
- 4.1.4. Threat of Substitutes
- 4.1.5. Competitive Rivalry
- 4.2. PESTEL analysis
- 4.3. BCG Analysis
- 4.3.1. Stars (High Growth, High Market Share)
- 4.3.2. Cash Cows (Low Growth, High Market Share)
- 4.3.3. Question Mark (High Growth, Low Market Share)
- 4.3.4. Dogs (Low Growth, Low Market Share)
- 4.4. Ansoff Matrix Analysis
- 4.5. Supply Chain Analysis
- 4.6. Regulatory Landscape
- 4.7. Current Market Potential and Opportunity Assessment (TAM–SAM–SOM Framework)
- 4.8. VDR Analyst Note
- 4.1. Porters Five Forces
- 5. Market Analysis, Insights and Forecast 2021-2033
- 5.1. Market Analysis, Insights and Forecast - by Delivery Mode
- 5.1.1. On-premise
- 5.1.2. Cloud-based
- 5.2. Market Analysis, Insights and Forecast - by Component
- 5.2.1. Software
- 5.2.2. Services
- 5.3. Market Analysis, Insights and Forecast - by End User
- 5.3.1. Pharmaceuticals
- 5.3.2. Contract Research Organization
- 5.3.3. Other End Users
- 5.4. Market Analysis, Insights and Forecast - by Region
- 5.4.1. North America
- 5.4.2. Europe
- 5.4.3. Asia Pacific
- 5.4.4. Middle East and Africa
- 5.4.5. South America
- 5.1. Market Analysis, Insights and Forecast - by Delivery Mode
- 6. Global Clinical Trial Management Industry Analysis, Insights and Forecast, 2021-2033
- 6.1. Market Analysis, Insights and Forecast - by Delivery Mode
- 6.1.1. On-premise
- 6.1.2. Cloud-based
- 6.2. Market Analysis, Insights and Forecast - by Component
- 6.2.1. Software
- 6.2.2. Services
- 6.3. Market Analysis, Insights and Forecast - by End User
- 6.3.1. Pharmaceuticals
- 6.3.2. Contract Research Organization
- 6.3.3. Other End Users
- 6.1. Market Analysis, Insights and Forecast - by Delivery Mode
- 7. North America Clinical Trial Management Industry Analysis, Insights and Forecast, 2021-2033
- 7.1. Market Analysis, Insights and Forecast - by Delivery Mode
- 7.1.1. On-premise
- 7.1.2. Cloud-based
- 7.2. Market Analysis, Insights and Forecast - by Component
- 7.2.1. Software
- 7.2.2. Services
- 7.3. Market Analysis, Insights and Forecast - by End User
- 7.3.1. Pharmaceuticals
- 7.3.2. Contract Research Organization
- 7.3.3. Other End Users
- 7.1. Market Analysis, Insights and Forecast - by Delivery Mode
- 8. Europe Clinical Trial Management Industry Analysis, Insights and Forecast, 2021-2033
- 8.1. Market Analysis, Insights and Forecast - by Delivery Mode
- 8.1.1. On-premise
- 8.1.2. Cloud-based
- 8.2. Market Analysis, Insights and Forecast - by Component
- 8.2.1. Software
- 8.2.2. Services
- 8.3. Market Analysis, Insights and Forecast - by End User
- 8.3.1. Pharmaceuticals
- 8.3.2. Contract Research Organization
- 8.3.3. Other End Users
- 8.1. Market Analysis, Insights and Forecast - by Delivery Mode
- 9. Asia Pacific Clinical Trial Management Industry Analysis, Insights and Forecast, 2021-2033
- 9.1. Market Analysis, Insights and Forecast - by Delivery Mode
- 9.1.1. On-premise
- 9.1.2. Cloud-based
- 9.2. Market Analysis, Insights and Forecast - by Component
- 9.2.1. Software
- 9.2.2. Services
- 9.3. Market Analysis, Insights and Forecast - by End User
- 9.3.1. Pharmaceuticals
- 9.3.2. Contract Research Organization
- 9.3.3. Other End Users
- 9.1. Market Analysis, Insights and Forecast - by Delivery Mode
- 10. Middle East and Africa Clinical Trial Management Industry Analysis, Insights and Forecast, 2021-2033
- 10.1. Market Analysis, Insights and Forecast - by Delivery Mode
- 10.1.1. On-premise
- 10.1.2. Cloud-based
- 10.2. Market Analysis, Insights and Forecast - by Component
- 10.2.1. Software
- 10.2.2. Services
- 10.3. Market Analysis, Insights and Forecast - by End User
- 10.3.1. Pharmaceuticals
- 10.3.2. Contract Research Organization
- 10.3.3. Other End Users
- 10.1. Market Analysis, Insights and Forecast - by Delivery Mode
- 11. South America Clinical Trial Management Industry Analysis, Insights and Forecast, 2021-2033
- 11.1. Market Analysis, Insights and Forecast - by Delivery Mode
- 11.1.1. On-premise
- 11.1.2. Cloud-based
- 11.2. Market Analysis, Insights and Forecast - by Component
- 11.2.1. Software
- 11.2.2. Services
- 11.3. Market Analysis, Insights and Forecast - by End User
- 11.3.1. Pharmaceuticals
- 11.3.2. Contract Research Organization
- 11.3.3. Other End Users
- 11.1. Market Analysis, Insights and Forecast - by Delivery Mode
- 12. Competitive Analysis
- 12.1. Company Profiles
- 12.1.1 MedNet Solutions Inc
- 12.1.1.1. Company Overview
- 12.1.1.2. Products
- 12.1.1.3. Company Financials
- 12.1.1.4. SWOT Analysis
- 12.1.2 ERT Clinical
- 12.1.2.1. Company Overview
- 12.1.2.2. Products
- 12.1.2.3. Company Financials
- 12.1.2.4. SWOT Analysis
- 12.1.3 Bioclinica
- 12.1.3.1. Company Overview
- 12.1.3.2. Products
- 12.1.3.3. Company Financials
- 12.1.3.4. SWOT Analysis
- 12.1.4 DATATRAK International Inc
- 12.1.4.1. Company Overview
- 12.1.4.2. Products
- 12.1.4.3. Company Financials
- 12.1.4.4. SWOT Analysis
- 12.1.5 ArisGlobal LLC
- 12.1.5.1. Company Overview
- 12.1.5.2. Products
- 12.1.5.3. Company Financials
- 12.1.5.4. SWOT Analysis
- 12.1.6 RealTime Software Solutions LLC
- 12.1.6.1. Company Overview
- 12.1.6.2. Products
- 12.1.6.3. Company Financials
- 12.1.6.4. SWOT Analysis
- 12.1.7 Advarra
- 12.1.7.1. Company Overview
- 12.1.7.2. Products
- 12.1.7.3. Company Financials
- 12.1.7.4. SWOT Analysis
- 12.1.8 DZS Clinical Services
- 12.1.8.1. Company Overview
- 12.1.8.2. Products
- 12.1.8.3. Company Financials
- 12.1.8.4. SWOT Analysis
- 12.1.9 Oracle Corporation
- 12.1.9.1. Company Overview
- 12.1.9.2. Products
- 12.1.9.3. Company Financials
- 12.1.9.4. SWOT Analysis
- 12.1.10 Veeva Systems
- 12.1.10.1. Company Overview
- 12.1.10.2. Products
- 12.1.10.3. Company Financials
- 12.1.10.4. SWOT Analysis
- 12.1.11 Calyx
- 12.1.11.1. Company Overview
- 12.1.11.2. Products
- 12.1.11.3. Company Financials
- 12.1.11.4. SWOT Analysis
- 12.1.12 Dassault Systèmes (Medidata Solutions Inc )
- 12.1.12.1. Company Overview
- 12.1.12.2. Products
- 12.1.12.3. Company Financials
- 12.1.12.4. SWOT Analysis
- 12.1.13 IBM
- 12.1.13.1. Company Overview
- 12.1.13.2. Products
- 12.1.13.3. Company Financials
- 12.1.13.4. SWOT Analysis
- 12.1.1 MedNet Solutions Inc
- 12.2. Market Entropy
- 12.2.1 Company's Key Areas Served
- 12.2.2 Recent Developments
- 12.3. Company Market Share Analysis 2025
- 12.3.1 Top 5 Companies Market Share Analysis
- 12.3.2 Top 3 Companies Market Share Analysis
- 12.4. List of Potential Customers
- 13. Research Methodology
List of Figures
- Figure 1: Global Clinical Trial Management Industry Revenue Breakdown (billion, %) by Region 2025 & 2033
- Figure 2: Global Clinical Trial Management Industry Volume Breakdown (K Unit, %) by Region 2025 & 2033
- Figure 3: North America Clinical Trial Management Industry Revenue (billion), by Delivery Mode 2025 & 2033
- Figure 4: North America Clinical Trial Management Industry Volume (K Unit), by Delivery Mode 2025 & 2033
- Figure 5: North America Clinical Trial Management Industry Revenue Share (%), by Delivery Mode 2025 & 2033
- Figure 6: North America Clinical Trial Management Industry Volume Share (%), by Delivery Mode 2025 & 2033
- Figure 7: North America Clinical Trial Management Industry Revenue (billion), by Component 2025 & 2033
- Figure 8: North America Clinical Trial Management Industry Volume (K Unit), by Component 2025 & 2033
- Figure 9: North America Clinical Trial Management Industry Revenue Share (%), by Component 2025 & 2033
- Figure 10: North America Clinical Trial Management Industry Volume Share (%), by Component 2025 & 2033
- Figure 11: North America Clinical Trial Management Industry Revenue (billion), by End User 2025 & 2033
- Figure 12: North America Clinical Trial Management Industry Volume (K Unit), by End User 2025 & 2033
- Figure 13: North America Clinical Trial Management Industry Revenue Share (%), by End User 2025 & 2033
- Figure 14: North America Clinical Trial Management Industry Volume Share (%), by End User 2025 & 2033
- Figure 15: North America Clinical Trial Management Industry Revenue (billion), by Country 2025 & 2033
- Figure 16: North America Clinical Trial Management Industry Volume (K Unit), by Country 2025 & 2033
- Figure 17: North America Clinical Trial Management Industry Revenue Share (%), by Country 2025 & 2033
- Figure 18: North America Clinical Trial Management Industry Volume Share (%), by Country 2025 & 2033
- Figure 19: Europe Clinical Trial Management Industry Revenue (billion), by Delivery Mode 2025 & 2033
- Figure 20: Europe Clinical Trial Management Industry Volume (K Unit), by Delivery Mode 2025 & 2033
- Figure 21: Europe Clinical Trial Management Industry Revenue Share (%), by Delivery Mode 2025 & 2033
- Figure 22: Europe Clinical Trial Management Industry Volume Share (%), by Delivery Mode 2025 & 2033
- Figure 23: Europe Clinical Trial Management Industry Revenue (billion), by Component 2025 & 2033
- Figure 24: Europe Clinical Trial Management Industry Volume (K Unit), by Component 2025 & 2033
- Figure 25: Europe Clinical Trial Management Industry Revenue Share (%), by Component 2025 & 2033
- Figure 26: Europe Clinical Trial Management Industry Volume Share (%), by Component 2025 & 2033
- Figure 27: Europe Clinical Trial Management Industry Revenue (billion), by End User 2025 & 2033
- Figure 28: Europe Clinical Trial Management Industry Volume (K Unit), by End User 2025 & 2033
- Figure 29: Europe Clinical Trial Management Industry Revenue Share (%), by End User 2025 & 2033
- Figure 30: Europe Clinical Trial Management Industry Volume Share (%), by End User 2025 & 2033
- Figure 31: Europe Clinical Trial Management Industry Revenue (billion), by Country 2025 & 2033
- Figure 32: Europe Clinical Trial Management Industry Volume (K Unit), by Country 2025 & 2033
- Figure 33: Europe Clinical Trial Management Industry Revenue Share (%), by Country 2025 & 2033
- Figure 34: Europe Clinical Trial Management Industry Volume Share (%), by Country 2025 & 2033
- Figure 35: Asia Pacific Clinical Trial Management Industry Revenue (billion), by Delivery Mode 2025 & 2033
- Figure 36: Asia Pacific Clinical Trial Management Industry Volume (K Unit), by Delivery Mode 2025 & 2033
- Figure 37: Asia Pacific Clinical Trial Management Industry Revenue Share (%), by Delivery Mode 2025 & 2033
- Figure 38: Asia Pacific Clinical Trial Management Industry Volume Share (%), by Delivery Mode 2025 & 2033
- Figure 39: Asia Pacific Clinical Trial Management Industry Revenue (billion), by Component 2025 & 2033
- Figure 40: Asia Pacific Clinical Trial Management Industry Volume (K Unit), by Component 2025 & 2033
- Figure 41: Asia Pacific Clinical Trial Management Industry Revenue Share (%), by Component 2025 & 2033
- Figure 42: Asia Pacific Clinical Trial Management Industry Volume Share (%), by Component 2025 & 2033
- Figure 43: Asia Pacific Clinical Trial Management Industry Revenue (billion), by End User 2025 & 2033
- Figure 44: Asia Pacific Clinical Trial Management Industry Volume (K Unit), by End User 2025 & 2033
- Figure 45: Asia Pacific Clinical Trial Management Industry Revenue Share (%), by End User 2025 & 2033
- Figure 46: Asia Pacific Clinical Trial Management Industry Volume Share (%), by End User 2025 & 2033
- Figure 47: Asia Pacific Clinical Trial Management Industry Revenue (billion), by Country 2025 & 2033
- Figure 48: Asia Pacific Clinical Trial Management Industry Volume (K Unit), by Country 2025 & 2033
- Figure 49: Asia Pacific Clinical Trial Management Industry Revenue Share (%), by Country 2025 & 2033
- Figure 50: Asia Pacific Clinical Trial Management Industry Volume Share (%), by Country 2025 & 2033
- Figure 51: Middle East and Africa Clinical Trial Management Industry Revenue (billion), by Delivery Mode 2025 & 2033
- Figure 52: Middle East and Africa Clinical Trial Management Industry Volume (K Unit), by Delivery Mode 2025 & 2033
- Figure 53: Middle East and Africa Clinical Trial Management Industry Revenue Share (%), by Delivery Mode 2025 & 2033
- Figure 54: Middle East and Africa Clinical Trial Management Industry Volume Share (%), by Delivery Mode 2025 & 2033
- Figure 55: Middle East and Africa Clinical Trial Management Industry Revenue (billion), by Component 2025 & 2033
- Figure 56: Middle East and Africa Clinical Trial Management Industry Volume (K Unit), by Component 2025 & 2033
- Figure 57: Middle East and Africa Clinical Trial Management Industry Revenue Share (%), by Component 2025 & 2033
- Figure 58: Middle East and Africa Clinical Trial Management Industry Volume Share (%), by Component 2025 & 2033
- Figure 59: Middle East and Africa Clinical Trial Management Industry Revenue (billion), by End User 2025 & 2033
- Figure 60: Middle East and Africa Clinical Trial Management Industry Volume (K Unit), by End User 2025 & 2033
- Figure 61: Middle East and Africa Clinical Trial Management Industry Revenue Share (%), by End User 2025 & 2033
- Figure 62: Middle East and Africa Clinical Trial Management Industry Volume Share (%), by End User 2025 & 2033
- Figure 63: Middle East and Africa Clinical Trial Management Industry Revenue (billion), by Country 2025 & 2033
- Figure 64: Middle East and Africa Clinical Trial Management Industry Volume (K Unit), by Country 2025 & 2033
- Figure 65: Middle East and Africa Clinical Trial Management Industry Revenue Share (%), by Country 2025 & 2033
- Figure 66: Middle East and Africa Clinical Trial Management Industry Volume Share (%), by Country 2025 & 2033
- Figure 67: South America Clinical Trial Management Industry Revenue (billion), by Delivery Mode 2025 & 2033
- Figure 68: South America Clinical Trial Management Industry Volume (K Unit), by Delivery Mode 2025 & 2033
- Figure 69: South America Clinical Trial Management Industry Revenue Share (%), by Delivery Mode 2025 & 2033
- Figure 70: South America Clinical Trial Management Industry Volume Share (%), by Delivery Mode 2025 & 2033
- Figure 71: South America Clinical Trial Management Industry Revenue (billion), by Component 2025 & 2033
- Figure 72: South America Clinical Trial Management Industry Volume (K Unit), by Component 2025 & 2033
- Figure 73: South America Clinical Trial Management Industry Revenue Share (%), by Component 2025 & 2033
- Figure 74: South America Clinical Trial Management Industry Volume Share (%), by Component 2025 & 2033
- Figure 75: South America Clinical Trial Management Industry Revenue (billion), by End User 2025 & 2033
- Figure 76: South America Clinical Trial Management Industry Volume (K Unit), by End User 2025 & 2033
- Figure 77: South America Clinical Trial Management Industry Revenue Share (%), by End User 2025 & 2033
- Figure 78: South America Clinical Trial Management Industry Volume Share (%), by End User 2025 & 2033
- Figure 79: South America Clinical Trial Management Industry Revenue (billion), by Country 2025 & 2033
- Figure 80: South America Clinical Trial Management Industry Volume (K Unit), by Country 2025 & 2033
- Figure 81: South America Clinical Trial Management Industry Revenue Share (%), by Country 2025 & 2033
- Figure 82: South America Clinical Trial Management Industry Volume Share (%), by Country 2025 & 2033
List of Tables
- Table 1: Global Clinical Trial Management Industry Revenue billion Forecast, by Delivery Mode 2020 & 2033
- Table 2: Global Clinical Trial Management Industry Volume K Unit Forecast, by Delivery Mode 2020 & 2033
- Table 3: Global Clinical Trial Management Industry Revenue billion Forecast, by Component 2020 & 2033
- Table 4: Global Clinical Trial Management Industry Volume K Unit Forecast, by Component 2020 & 2033
- Table 5: Global Clinical Trial Management Industry Revenue billion Forecast, by End User 2020 & 2033
- Table 6: Global Clinical Trial Management Industry Volume K Unit Forecast, by End User 2020 & 2033
- Table 7: Global Clinical Trial Management Industry Revenue billion Forecast, by Region 2020 & 2033
- Table 8: Global Clinical Trial Management Industry Volume K Unit Forecast, by Region 2020 & 2033
- Table 9: Global Clinical Trial Management Industry Revenue billion Forecast, by Delivery Mode 2020 & 2033
- Table 10: Global Clinical Trial Management Industry Volume K Unit Forecast, by Delivery Mode 2020 & 2033
- Table 11: Global Clinical Trial Management Industry Revenue billion Forecast, by Component 2020 & 2033
- Table 12: Global Clinical Trial Management Industry Volume K Unit Forecast, by Component 2020 & 2033
- Table 13: Global Clinical Trial Management Industry Revenue billion Forecast, by End User 2020 & 2033
- Table 14: Global Clinical Trial Management Industry Volume K Unit Forecast, by End User 2020 & 2033
- Table 15: Global Clinical Trial Management Industry Revenue billion Forecast, by Country 2020 & 2033
- Table 16: Global Clinical Trial Management Industry Volume K Unit Forecast, by Country 2020 & 2033
- Table 17: United States Clinical Trial Management Industry Revenue (billion) Forecast, by Application 2020 & 2033
- Table 18: United States Clinical Trial Management Industry Volume (K Unit) Forecast, by Application 2020 & 2033
- Table 19: Canada Clinical Trial Management Industry Revenue (billion) Forecast, by Application 2020 & 2033
- Table 20: Canada Clinical Trial Management Industry Volume (K Unit) Forecast, by Application 2020 & 2033
- Table 21: Mexico Clinical Trial Management Industry Revenue (billion) Forecast, by Application 2020 & 2033
- Table 22: Mexico Clinical Trial Management Industry Volume (K Unit) Forecast, by Application 2020 & 2033
- Table 23: Global Clinical Trial Management Industry Revenue billion Forecast, by Delivery Mode 2020 & 2033
- Table 24: Global Clinical Trial Management Industry Volume K Unit Forecast, by Delivery Mode 2020 & 2033
- Table 25: Global Clinical Trial Management Industry Revenue billion Forecast, by Component 2020 & 2033
- Table 26: Global Clinical Trial Management Industry Volume K Unit Forecast, by Component 2020 & 2033
- Table 27: Global Clinical Trial Management Industry Revenue billion Forecast, by End User 2020 & 2033
- Table 28: Global Clinical Trial Management Industry Volume K Unit Forecast, by End User 2020 & 2033
- Table 29: Global Clinical Trial Management Industry Revenue billion Forecast, by Country 2020 & 2033
- Table 30: Global Clinical Trial Management Industry Volume K Unit Forecast, by Country 2020 & 2033
- Table 31: Germany Clinical Trial Management Industry Revenue (billion) Forecast, by Application 2020 & 2033
- Table 32: Germany Clinical Trial Management Industry Volume (K Unit) Forecast, by Application 2020 & 2033
- Table 33: United Kingdom Clinical Trial Management Industry Revenue (billion) Forecast, by Application 2020 & 2033
- Table 34: United Kingdom Clinical Trial Management Industry Volume (K Unit) Forecast, by Application 2020 & 2033
- Table 35: France Clinical Trial Management Industry Revenue (billion) Forecast, by Application 2020 & 2033
- Table 36: France Clinical Trial Management Industry Volume (K Unit) Forecast, by Application 2020 & 2033
- Table 37: Italy Clinical Trial Management Industry Revenue (billion) Forecast, by Application 2020 & 2033
- Table 38: Italy Clinical Trial Management Industry Volume (K Unit) Forecast, by Application 2020 & 2033
- Table 39: Spain Clinical Trial Management Industry Revenue (billion) Forecast, by Application 2020 & 2033
- Table 40: Spain Clinical Trial Management Industry Volume (K Unit) Forecast, by Application 2020 & 2033
- Table 41: Rest of Europe Clinical Trial Management Industry Revenue (billion) Forecast, by Application 2020 & 2033
- Table 42: Rest of Europe Clinical Trial Management Industry Volume (K Unit) Forecast, by Application 2020 & 2033
- Table 43: Global Clinical Trial Management Industry Revenue billion Forecast, by Delivery Mode 2020 & 2033
- Table 44: Global Clinical Trial Management Industry Volume K Unit Forecast, by Delivery Mode 2020 & 2033
- Table 45: Global Clinical Trial Management Industry Revenue billion Forecast, by Component 2020 & 2033
- Table 46: Global Clinical Trial Management Industry Volume K Unit Forecast, by Component 2020 & 2033
- Table 47: Global Clinical Trial Management Industry Revenue billion Forecast, by End User 2020 & 2033
- Table 48: Global Clinical Trial Management Industry Volume K Unit Forecast, by End User 2020 & 2033
- Table 49: Global Clinical Trial Management Industry Revenue billion Forecast, by Country 2020 & 2033
- Table 50: Global Clinical Trial Management Industry Volume K Unit Forecast, by Country 2020 & 2033
- Table 51: China Clinical Trial Management Industry Revenue (billion) Forecast, by Application 2020 & 2033
- Table 52: China Clinical Trial Management Industry Volume (K Unit) Forecast, by Application 2020 & 2033
- Table 53: Japan Clinical Trial Management Industry Revenue (billion) Forecast, by Application 2020 & 2033
- Table 54: Japan Clinical Trial Management Industry Volume (K Unit) Forecast, by Application 2020 & 2033
- Table 55: India Clinical Trial Management Industry Revenue (billion) Forecast, by Application 2020 & 2033
- Table 56: India Clinical Trial Management Industry Volume (K Unit) Forecast, by Application 2020 & 2033
- Table 57: Australia Clinical Trial Management Industry Revenue (billion) Forecast, by Application 2020 & 2033
- Table 58: Australia Clinical Trial Management Industry Volume (K Unit) Forecast, by Application 2020 & 2033
- Table 59: South Korea Clinical Trial Management Industry Revenue (billion) Forecast, by Application 2020 & 2033
- Table 60: South Korea Clinical Trial Management Industry Volume (K Unit) Forecast, by Application 2020 & 2033
- Table 61: Rest of Asia Pacific Clinical Trial Management Industry Revenue (billion) Forecast, by Application 2020 & 2033
- Table 62: Rest of Asia Pacific Clinical Trial Management Industry Volume (K Unit) Forecast, by Application 2020 & 2033
- Table 63: Global Clinical Trial Management Industry Revenue billion Forecast, by Delivery Mode 2020 & 2033
- Table 64: Global Clinical Trial Management Industry Volume K Unit Forecast, by Delivery Mode 2020 & 2033
- Table 65: Global Clinical Trial Management Industry Revenue billion Forecast, by Component 2020 & 2033
- Table 66: Global Clinical Trial Management Industry Volume K Unit Forecast, by Component 2020 & 2033
- Table 67: Global Clinical Trial Management Industry Revenue billion Forecast, by End User 2020 & 2033
- Table 68: Global Clinical Trial Management Industry Volume K Unit Forecast, by End User 2020 & 2033
- Table 69: Global Clinical Trial Management Industry Revenue billion Forecast, by Country 2020 & 2033
- Table 70: Global Clinical Trial Management Industry Volume K Unit Forecast, by Country 2020 & 2033
- Table 71: GCC Clinical Trial Management Industry Revenue (billion) Forecast, by Application 2020 & 2033
- Table 72: GCC Clinical Trial Management Industry Volume (K Unit) Forecast, by Application 2020 & 2033
- Table 73: South Africa Clinical Trial Management Industry Revenue (billion) Forecast, by Application 2020 & 2033
- Table 74: South Africa Clinical Trial Management Industry Volume (K Unit) Forecast, by Application 2020 & 2033
- Table 75: Rest of Middle East and Africa Clinical Trial Management Industry Revenue (billion) Forecast, by Application 2020 & 2033
- Table 76: Rest of Middle East and Africa Clinical Trial Management Industry Volume (K Unit) Forecast, by Application 2020 & 2033
- Table 77: Global Clinical Trial Management Industry Revenue billion Forecast, by Delivery Mode 2020 & 2033
- Table 78: Global Clinical Trial Management Industry Volume K Unit Forecast, by Delivery Mode 2020 & 2033
- Table 79: Global Clinical Trial Management Industry Revenue billion Forecast, by Component 2020 & 2033
- Table 80: Global Clinical Trial Management Industry Volume K Unit Forecast, by Component 2020 & 2033
- Table 81: Global Clinical Trial Management Industry Revenue billion Forecast, by End User 2020 & 2033
- Table 82: Global Clinical Trial Management Industry Volume K Unit Forecast, by End User 2020 & 2033
- Table 83: Global Clinical Trial Management Industry Revenue billion Forecast, by Country 2020 & 2033
- Table 84: Global Clinical Trial Management Industry Volume K Unit Forecast, by Country 2020 & 2033
- Table 85: Brazil Clinical Trial Management Industry Revenue (billion) Forecast, by Application 2020 & 2033
- Table 86: Brazil Clinical Trial Management Industry Volume (K Unit) Forecast, by Application 2020 & 2033
- Table 87: Argentina Clinical Trial Management Industry Revenue (billion) Forecast, by Application 2020 & 2033
- Table 88: Argentina Clinical Trial Management Industry Volume (K Unit) Forecast, by Application 2020 & 2033
- Table 89: Rest of South America Clinical Trial Management Industry Revenue (billion) Forecast, by Application 2020 & 2033
- Table 90: Rest of South America Clinical Trial Management Industry Volume (K Unit) Forecast, by Application 2020 & 2033
Frequently Asked Questions
1. What is the projected Compound Annual Growth Rate (CAGR) of the Clinical Trial Management Industry?
The projected CAGR is approximately 5.9%.
2. Which companies are prominent players in the Clinical Trial Management Industry?
Key companies in the market include MedNet Solutions Inc, ERT Clinical, Bioclinica, DATATRAK International Inc, ArisGlobal LLC, RealTime Software Solutions LLC, Advarra, DZS Clinical Services, Oracle Corporation, Veeva Systems, Calyx, Dassault Systèmes (Medidata Solutions Inc ), IBM.
3. What are the main segments of the Clinical Trial Management Industry?
The market segments include Delivery Mode, Component, End User.
4. Can you provide details about the market size?
The market size is estimated to be USD 21 billion as of 2022.
5. What are some drivers contributing to market growth?
Growing Number of Clinical Trials Due to Rising Chronic Diseases and Lifestyle-related Disorders; Rise in Outsourcing of Clinical Trials and Implementation by Contract Research Organizations.
6. What are the notable trends driving market growth?
The Pharmaceutical Segment is Expected to Grow Over the Forecast Period.
7. Are there any restraints impacting market growth?
Data Security Issues; High Cost Associated With Clinical Trial Management Systems.
8. Can you provide examples of recent developments in the market?
March 2023: Assentia launched tech platforms to support payments in the clinical trial space. The company released two SaaS-based applications, GrantPay and GrantPact, to provide clinical trial contract negotiation and payment services.
9. What pricing options are available for accessing the report?
Pricing options include single-user, multi-user, and enterprise licenses priced at USD 4750, USD 5250, and USD 8750 respectively.
10. Is the market size provided in terms of value or volume?
The market size is provided in terms of value, measured in billion and volume, measured in K Unit.
11. Are there any specific market keywords associated with the report?
Yes, the market keyword associated with the report is "Clinical Trial Management Industry," which aids in identifying and referencing the specific market segment covered.
12. How do I determine which pricing option suits my needs best?
The pricing options vary based on user requirements and access needs. Individual users may opt for single-user licenses, while businesses requiring broader access may choose multi-user or enterprise licenses for cost-effective access to the report.
13. Are there any additional resources or data provided in the Clinical Trial Management Industry report?
While the report offers comprehensive insights, it's advisable to review the specific contents or supplementary materials provided to ascertain if additional resources or data are available.
14. How can I stay updated on further developments or reports in the Clinical Trial Management Industry?
To stay informed about further developments, trends, and reports in the Clinical Trial Management Industry, consider subscribing to industry newsletters, following relevant companies and organizations, or regularly checking reputable industry news sources and publications.
Methodology
Step 1 - Identification of Relevant Samples Size from Population Database


Step 2 - Approaches for Defining Global Market Size (Value, Volume* & Price*)

Note*: In applicable scenarios
Step 3 - Data Sources
Primary Research
- Web Analytics
- Survey Reports
- Research Institute
- Latest Research Reports
- Opinion Leaders
Secondary Research
- Annual Reports
- White Paper
- Latest Press Release
- Industry Association
- Paid Database
- Investor Presentations

Step 4 - Data Triangulation
Involves using different sources of information in order to increase the validity of a study
These sources are likely to be stakeholders in a program - participants, other researchers, program staff, other community members, and so on.
Then we put all data in single framework & apply various statistical tools to find out the dynamic on the market.
During the analysis stage, feedback from the stakeholder groups would be compared to determine areas of agreement as well as areas of divergence