
Key Insights
The Clinical Trial Imaging Services market is experiencing robust growth, projected to reach a value of $1.25 billion in 2025 and maintain a Compound Annual Growth Rate (CAGR) of 5.38% from 2025 to 2033. This expansion is fueled by several key factors. The increasing prevalence of chronic diseases globally necessitates more extensive clinical trials, driving demand for sophisticated imaging services. Advancements in imaging technologies, such as higher-resolution MRI and improved PET scans, provide more precise diagnostic data, accelerating drug development and enhancing trial outcomes. Furthermore, the growing adoption of decentralized clinical trials (DCTs) is creating new opportunities for remote imaging services, expanding market accessibility. The pharmaceutical and biotechnology sectors are significant drivers, investing heavily in research and development, which directly correlates with the increased demand for imaging services. This market is segmented across various modalities (MRI, CT, Ultrasound, PET, X-Ray, Echocardiography), services (Trial Design Consulting, Read Analysis, Operational Imaging), and end-users (Pharmaceutical & Biotech companies, Medical Device Manufacturers, Academic & Government Institutes). The North American region currently holds a dominant market share due to high R&D spending and a well-established healthcare infrastructure. However, the Asia-Pacific region is predicted to demonstrate significant growth potential in the coming years, driven by rising healthcare expenditure and an expanding pharmaceutical industry.
The competitive landscape is marked by a mix of established players and emerging specialized companies. Key players like Philips and Parexel leverage their established presence in medical technology and clinical research to maintain strong market positions. However, smaller, specialized firms focusing on niche imaging modalities or specific trial support services are also gaining traction. The market's future growth will hinge on continued technological advancements in imaging, increasing regulatory approvals for new drugs and devices, and the overall expansion of clinical trial activities across diverse therapeutic areas. Strategic partnerships and collaborations between imaging service providers and pharmaceutical companies are expected to play a significant role in shaping the market’s trajectory. Addressing regulatory hurdles and ensuring data privacy and security will be crucial aspects for continued, sustainable growth.

Clinical Trial Imaging Services Market: A Comprehensive Report (2019-2033)
This comprehensive report provides a detailed analysis of the Clinical Trial Imaging Services market, encompassing market dynamics, growth trends, regional dominance, product landscape, key players, and future outlook. The study period spans from 2019 to 2033, with 2025 serving as the base and estimated year. The report is designed to provide actionable insights for industry professionals, investors, and stakeholders seeking to navigate this rapidly evolving market. The market is segmented by Product and Service (Trial Design Consulting Services, Read Analysis Services, Operational Imaging Services, Imaging Software), Modality (Magnetic Resonance Imaging, Computed Tomography, Ultrasound, Positron Emission Tomography, X-Ray, Echocardiography, Other Modalities), and End-User (Pharmaceutical & Biotechnology Companies, Medical Device Manufacturers, Academic and Government Research Institutes). The total market size in 2025 is estimated at xx Million.
Clinical Trial Imaging Services Market Dynamics & Structure
The Clinical Trial Imaging Services market is characterized by moderate concentration, with a few large players holding significant market share. Technological innovation, particularly in AI-powered image analysis and advanced imaging modalities, is a key driver. Stringent regulatory frameworks governing clinical trials influence market growth and adoption of new technologies. The market faces competition from alternative diagnostic methods, but the increasing demand for precise and objective clinical trial data supports market expansion. End-user demographics, particularly the growth of pharmaceutical and biotechnology companies, contribute to market growth. M&A activity in the sector has been moderate, with xx deals recorded in the last five years, representing a xx% market share consolidation.
- Market Concentration: Moderately concentrated, with top 5 players holding approximately xx% market share in 2025.
- Technological Innovation: AI-powered image analysis, advanced imaging modalities (e.g., 7 Tesla MRI) driving growth.
- Regulatory Framework: Stringent regulations (e.g., FDA approvals) impact market entry and technology adoption.
- Competitive Substitutes: Alternative diagnostic methods pose some competition.
- End-User Demographics: Growth in pharmaceutical and biotechnology sectors fuels demand.
- M&A Trends: xx M&A deals over the past five years, resulting in xx% market share consolidation.
- Innovation Barriers: High R&D costs, stringent regulatory approvals, and integration challenges.
Clinical Trial Imaging Services Market Growth Trends & Insights
The Clinical Trial Imaging Services market demonstrated robust growth between 2019 and 2024, achieving a CAGR of [Insert CAGR Percentage]%. This expansion is primarily attributed to the increasing integration of advanced imaging technologies within clinical trials. The demand for objective, precise data, coupled with technological advancements such as AI-powered image analysis and refined imaging modalities, is significantly accelerating market growth. The market's upward trajectory is expected to continue throughout the forecast period (2025-2033), with a projected CAGR of [Insert CAGR Percentage]%, reaching a market value of [Insert Market Value in Millions] by 2033. This sustained growth is fueled by a global surge in clinical trial activity, an expanding base of pharmaceutical and biotechnology companies, and a growing preference for advanced imaging techniques that enhance diagnostic accuracy and efficiency.
Dominant Regions, Countries, or Segments in Clinical Trial Imaging Services Market
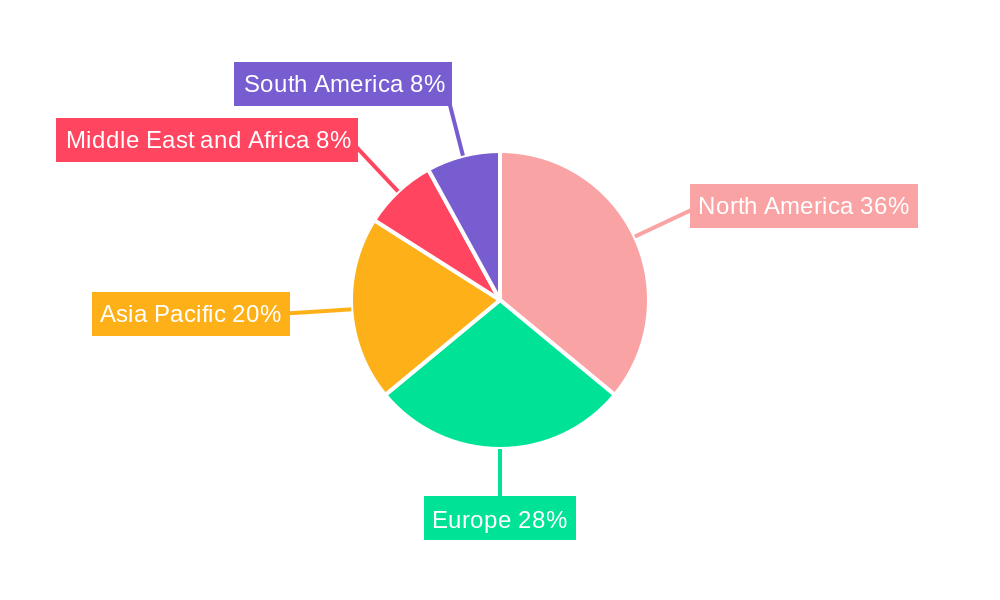
North America currently dominates the Clinical Trial Imaging Services market, holding the largest market share. This leadership position is driven by substantial healthcare expenditure, a sophisticated technological infrastructure, and a high concentration of pharmaceutical and biotechnology companies. Within North America, the United States represents the most significant market, followed by Europe as the second-largest regional market. The Asia-Pacific region is poised for remarkable growth, fueled by escalating healthcare investments and a rapidly increasing number of clinical trials being conducted within the region. This growth is expected to be driven by factors such as [Insert Specific Factors Driving Growth in Asia-Pacific, e.g., government initiatives, rising disposable income].
- Leading Region: North America (United States being the largest market)
- Key Drivers in North America: High healthcare spending, advanced technological infrastructure, substantial pharmaceutical and biotechnology industry presence, robust regulatory frameworks.
- High-Growth Region: Asia-Pacific (driven by increasing healthcare investments, expanding clinical trial activity, and a growing middle class with increased access to healthcare).
- Dominant Segment (Product & Service): [Insert Dominant Segment with Percentage Market Share in 2025] (xx% market share in 2025).
- Dominant Segment (Modality): Magnetic Resonance Imaging (MRI) ([Insert Percentage Market Share in 2025]% market share in 2025), followed by Computed Tomography (CT) ([Insert Percentage Market Share in 2025]% market share in 2025).
- Dominant Segment (End-User): Pharmaceutical & Biotechnology Companies ([Insert Percentage Market Share in 2025]% market share in 2025), followed by [Insert Second Largest End-User Segment].
Clinical Trial Imaging Services Market Product Landscape
The market offers a diverse range of products and services, including trial design consulting, read analysis services, operational imaging services, and imaging software. Recent innovations focus on AI-powered image analysis, enhancing diagnostic accuracy and efficiency. Advanced imaging modalities, such as high-field MRI and advanced CT scanners, offer superior image quality and improved diagnostic capabilities. Unique selling propositions include faster turnaround times, cost-effectiveness, and integration with existing clinical trial workflows.
Key Drivers, Barriers & Challenges in Clinical Trial Imaging Services Market
Key Drivers: Increasing demand for objective and precise data in clinical trials, technological advancements in imaging modalities and AI-powered analysis, and rising healthcare expenditure.
Challenges: High costs associated with advanced imaging technologies, stringent regulatory approvals, and competition from alternative diagnostic methods. Supply chain disruptions resulting in xx% increase in imaging equipment costs in 2022.
Emerging Opportunities in Clinical Trial Imaging Services Market
Significant emerging opportunities exist within the Clinical Trial Imaging Services market. These include expansion into untapped markets, particularly in developing economies; the development of specialized imaging solutions tailored to specific disease areas (e.g., oncology, neurology); and the integration of wearable sensor data with imaging data to facilitate remote patient monitoring and improve trial efficiency. The increasing adoption of telemedicine and decentralized clinical trials presents a substantial opportunity for growth and innovation, allowing for broader patient access and reduced geographical limitations.
Growth Accelerators in the Clinical Trial Imaging Services Market Industry
Strategic partnerships between imaging service providers and pharmaceutical companies, along with investments in R&D for developing innovative imaging technologies, are key growth accelerators. Expanding into new geographical markets and developing specialized imaging solutions for niche therapeutic areas are also crucial for long-term market growth.
Key Players Shaping the Clinical Trial Imaging Services Market Market
- Navitas Clinical Research Inc
- Koninklijke Philips N V
- Worldcare Clinical LLC
- ProScan Imaging
- Parexel International Corporation
- Radiant Sage LLC
- WIRB-Copernicus Group
- Ixico PLC
- Clario
- Resonance Health
- Medpace
- Icon PLC
Notable Milestones in Clinical Trial Imaging Services Market Sector
- May 2022: Bruker launched innovative 7 Tesla and 9.4 Tesla conduction-cooled Maxwell magnets for preclinical MRI systems. This significantly enhanced MRI capabilities for preclinical research.
- March 2022: Fujifilm India unveiled a new range of CT, MRI, and ultrasound machines, expanding access to advanced imaging technologies in India and impacting market competition.
In-Depth Clinical Trial Imaging Services Market Market Outlook
The Clinical Trial Imaging Services market is poised for continued growth, driven by technological advancements, increasing clinical trial activity, and the rising adoption of advanced imaging techniques. Strategic investments in R&D, strategic partnerships, and expansion into new geographical markets will be key for players to capitalize on the significant growth potential in this sector. The market is projected to reach xx Million by 2033, presenting lucrative opportunities for innovative companies and established players alike.
Clinical Trial Imaging Services Market Segmentation
-
1. Product and Service
- 1.1. Trial Design Consulting Services
- 1.2. Read Analysis Services
- 1.3. Operational Imaging Services
- 1.4. Imaging Software
-
2. Modality
- 2.1. Magnetic Resonance Imaging
- 2.2. Computed Tomography
- 2.3. Ultrasound
- 2.4. Positron Emission Tomography
- 2.5. X-Ray
- 2.6. Echocardiography
- 2.7. Other Modalities
-
3. End-User
- 3.1. Pharmaceutical & Biotechnology Companies
- 3.2. Medical Device Manufacturers
- 3.3. Academic and Government Research Institutes
Clinical Trial Imaging Services Market Segmentation By Geography
-
1. North America
- 1.1. United States
- 1.2. Canada
- 1.3. Mexico
-
2. Europe
- 2.1. Germany
- 2.2. United Kingdom
- 2.3. France
- 2.4. Italy
- 2.5. Spain
- 2.6. Rest of Europe
-
3. Asia Pacific
- 3.1. China
- 3.2. Japan
- 3.3. India
- 3.4. Australia
- 3.5. South Korea
- 3.6. Rest of Asia Pacific
-
4. Middle East and Africa
- 4.1. GCC
- 4.2. South Africa
- 4.3. Rest of Middle East and Africa
-
5. South America
- 5.1. Brazil
- 5.2. Argentina
- 5.3. Rest of South America
Clinical Trial Imaging Services Market REPORT HIGHLIGHTS
| Aspects | Details |
|---|---|
| Study Period | 2019-2033 |
| Base Year | 2024 |
| Estimated Year | 2025 |
| Forecast Period | 2025-2033 |
| Historical Period | 2019-2024 |
| Growth Rate | CAGR of 5.38% from 2019-2033 |
| Segmentation |
|
Table of Contents
- 1. Introduction
- 1.1. Research Scope
- 1.2. Market Segmentation
- 1.3. Research Methodology
- 1.4. Definitions and Assumptions
- 2. Executive Summary
- 2.1. Introduction
- 3. Market Dynamics
- 3.1. Introduction
- 3.2. Market Drivers
- 3.2.1. Increase in R&D Spending by the Pharmaceutical and Biotechnological Companies; Increasing Number of Contract Research Organization & Investment by Them
- 3.3. Market Restrains
- 3.3.1. High Implementation Barriers and Costs of Imaging Systems
- 3.4. Market Trends
- 3.4.1. Computed Tomography is Expected to Witness Rapid Growth Over the Forecast Period
- 4. Market Factor Analysis
- 4.1. Porters Five Forces
- 4.2. Supply/Value Chain
- 4.3. PESTEL analysis
- 4.4. Market Entropy
- 4.5. Patent/Trademark Analysis
- 5. Global Clinical Trial Imaging Services Market Analysis, Insights and Forecast, 2019-2031
- 5.1. Market Analysis, Insights and Forecast - by Product and Service
- 5.1.1. Trial Design Consulting Services
- 5.1.2. Read Analysis Services
- 5.1.3. Operational Imaging Services
- 5.1.4. Imaging Software
- 5.2. Market Analysis, Insights and Forecast - by Modality
- 5.2.1. Magnetic Resonance Imaging
- 5.2.2. Computed Tomography
- 5.2.3. Ultrasound
- 5.2.4. Positron Emission Tomography
- 5.2.5. X-Ray
- 5.2.6. Echocardiography
- 5.2.7. Other Modalities
- 5.3. Market Analysis, Insights and Forecast - by End-User
- 5.3.1. Pharmaceutical & Biotechnology Companies
- 5.3.2. Medical Device Manufacturers
- 5.3.3. Academic and Government Research Institutes
- 5.4. Market Analysis, Insights and Forecast - by Region
- 5.4.1. North America
- 5.4.2. Europe
- 5.4.3. Asia Pacific
- 5.4.4. Middle East and Africa
- 5.4.5. South America
- 5.1. Market Analysis, Insights and Forecast - by Product and Service
- 6. North America Clinical Trial Imaging Services Market Analysis, Insights and Forecast, 2019-2031
- 6.1. Market Analysis, Insights and Forecast - by Product and Service
- 6.1.1. Trial Design Consulting Services
- 6.1.2. Read Analysis Services
- 6.1.3. Operational Imaging Services
- 6.1.4. Imaging Software
- 6.2. Market Analysis, Insights and Forecast - by Modality
- 6.2.1. Magnetic Resonance Imaging
- 6.2.2. Computed Tomography
- 6.2.3. Ultrasound
- 6.2.4. Positron Emission Tomography
- 6.2.5. X-Ray
- 6.2.6. Echocardiography
- 6.2.7. Other Modalities
- 6.3. Market Analysis, Insights and Forecast - by End-User
- 6.3.1. Pharmaceutical & Biotechnology Companies
- 6.3.2. Medical Device Manufacturers
- 6.3.3. Academic and Government Research Institutes
- 6.1. Market Analysis, Insights and Forecast - by Product and Service
- 7. Europe Clinical Trial Imaging Services Market Analysis, Insights and Forecast, 2019-2031
- 7.1. Market Analysis, Insights and Forecast - by Product and Service
- 7.1.1. Trial Design Consulting Services
- 7.1.2. Read Analysis Services
- 7.1.3. Operational Imaging Services
- 7.1.4. Imaging Software
- 7.2. Market Analysis, Insights and Forecast - by Modality
- 7.2.1. Magnetic Resonance Imaging
- 7.2.2. Computed Tomography
- 7.2.3. Ultrasound
- 7.2.4. Positron Emission Tomography
- 7.2.5. X-Ray
- 7.2.6. Echocardiography
- 7.2.7. Other Modalities
- 7.3. Market Analysis, Insights and Forecast - by End-User
- 7.3.1. Pharmaceutical & Biotechnology Companies
- 7.3.2. Medical Device Manufacturers
- 7.3.3. Academic and Government Research Institutes
- 7.1. Market Analysis, Insights and Forecast - by Product and Service
- 8. Asia Pacific Clinical Trial Imaging Services Market Analysis, Insights and Forecast, 2019-2031
- 8.1. Market Analysis, Insights and Forecast - by Product and Service
- 8.1.1. Trial Design Consulting Services
- 8.1.2. Read Analysis Services
- 8.1.3. Operational Imaging Services
- 8.1.4. Imaging Software
- 8.2. Market Analysis, Insights and Forecast - by Modality
- 8.2.1. Magnetic Resonance Imaging
- 8.2.2. Computed Tomography
- 8.2.3. Ultrasound
- 8.2.4. Positron Emission Tomography
- 8.2.5. X-Ray
- 8.2.6. Echocardiography
- 8.2.7. Other Modalities
- 8.3. Market Analysis, Insights and Forecast - by End-User
- 8.3.1. Pharmaceutical & Biotechnology Companies
- 8.3.2. Medical Device Manufacturers
- 8.3.3. Academic and Government Research Institutes
- 8.1. Market Analysis, Insights and Forecast - by Product and Service
- 9. Middle East and Africa Clinical Trial Imaging Services Market Analysis, Insights and Forecast, 2019-2031
- 9.1. Market Analysis, Insights and Forecast - by Product and Service
- 9.1.1. Trial Design Consulting Services
- 9.1.2. Read Analysis Services
- 9.1.3. Operational Imaging Services
- 9.1.4. Imaging Software
- 9.2. Market Analysis, Insights and Forecast - by Modality
- 9.2.1. Magnetic Resonance Imaging
- 9.2.2. Computed Tomography
- 9.2.3. Ultrasound
- 9.2.4. Positron Emission Tomography
- 9.2.5. X-Ray
- 9.2.6. Echocardiography
- 9.2.7. Other Modalities
- 9.3. Market Analysis, Insights and Forecast - by End-User
- 9.3.1. Pharmaceutical & Biotechnology Companies
- 9.3.2. Medical Device Manufacturers
- 9.3.3. Academic and Government Research Institutes
- 9.1. Market Analysis, Insights and Forecast - by Product and Service
- 10. South America Clinical Trial Imaging Services Market Analysis, Insights and Forecast, 2019-2031
- 10.1. Market Analysis, Insights and Forecast - by Product and Service
- 10.1.1. Trial Design Consulting Services
- 10.1.2. Read Analysis Services
- 10.1.3. Operational Imaging Services
- 10.1.4. Imaging Software
- 10.2. Market Analysis, Insights and Forecast - by Modality
- 10.2.1. Magnetic Resonance Imaging
- 10.2.2. Computed Tomography
- 10.2.3. Ultrasound
- 10.2.4. Positron Emission Tomography
- 10.2.5. X-Ray
- 10.2.6. Echocardiography
- 10.2.7. Other Modalities
- 10.3. Market Analysis, Insights and Forecast - by End-User
- 10.3.1. Pharmaceutical & Biotechnology Companies
- 10.3.2. Medical Device Manufacturers
- 10.3.3. Academic and Government Research Institutes
- 10.1. Market Analysis, Insights and Forecast - by Product and Service
- 11. North America Clinical Trial Imaging Services Market Analysis, Insights and Forecast, 2019-2031
- 11.1. Market Analysis, Insights and Forecast - By Country/Sub-region
- 11.1.1 United States
- 11.1.2 Canada
- 11.1.3 Mexico
- 12. Europe Clinical Trial Imaging Services Market Analysis, Insights and Forecast, 2019-2031
- 12.1. Market Analysis, Insights and Forecast - By Country/Sub-region
- 12.1.1 Germany
- 12.1.2 United Kingdom
- 12.1.3 France
- 12.1.4 Italy
- 12.1.5 Spain
- 12.1.6 Rest of Europe
- 13. Asia Pacific Clinical Trial Imaging Services Market Analysis, Insights and Forecast, 2019-2031
- 13.1. Market Analysis, Insights and Forecast - By Country/Sub-region
- 13.1.1 China
- 13.1.2 Japan
- 13.1.3 India
- 13.1.4 Australia
- 13.1.5 South Korea
- 13.1.6 Rest of Asia Pacific
- 14. Middle East and Africa Clinical Trial Imaging Services Market Analysis, Insights and Forecast, 2019-2031
- 14.1. Market Analysis, Insights and Forecast - By Country/Sub-region
- 14.1.1 GCC
- 14.1.2 South Africa
- 14.1.3 Rest of Middle East and Africa
- 15. South America Clinical Trial Imaging Services Market Analysis, Insights and Forecast, 2019-2031
- 15.1. Market Analysis, Insights and Forecast - By Country/Sub-region
- 15.1.1 Brazil
- 15.1.2 Argentina
- 15.1.3 Rest of South America
- 16. Competitive Analysis
- 16.1. Global Market Share Analysis 2024
- 16.2. Company Profiles
- 16.2.1 Navitas Clinical Research Inc
- 16.2.1.1. Overview
- 16.2.1.2. Products
- 16.2.1.3. SWOT Analysis
- 16.2.1.4. Recent Developments
- 16.2.1.5. Financials (Based on Availability)
- 16.2.2 Koninklijke Philips N V
- 16.2.2.1. Overview
- 16.2.2.2. Products
- 16.2.2.3. SWOT Analysis
- 16.2.2.4. Recent Developments
- 16.2.2.5. Financials (Based on Availability)
- 16.2.3 Worldcare Clinical LLC
- 16.2.3.1. Overview
- 16.2.3.2. Products
- 16.2.3.3. SWOT Analysis
- 16.2.3.4. Recent Developments
- 16.2.3.5. Financials (Based on Availability)
- 16.2.4 ProScan Imaging
- 16.2.4.1. Overview
- 16.2.4.2. Products
- 16.2.4.3. SWOT Analysis
- 16.2.4.4. Recent Developments
- 16.2.4.5. Financials (Based on Availability)
- 16.2.5 Parexel International Corporation
- 16.2.5.1. Overview
- 16.2.5.2. Products
- 16.2.5.3. SWOT Analysis
- 16.2.5.4. Recent Developments
- 16.2.5.5. Financials (Based on Availability)
- 16.2.6 Radiant Sage LLC
- 16.2.6.1. Overview
- 16.2.6.2. Products
- 16.2.6.3. SWOT Analysis
- 16.2.6.4. Recent Developments
- 16.2.6.5. Financials (Based on Availability)
- 16.2.7 WIRB-Copernicus Group
- 16.2.7.1. Overview
- 16.2.7.2. Products
- 16.2.7.3. SWOT Analysis
- 16.2.7.4. Recent Developments
- 16.2.7.5. Financials (Based on Availability)
- 16.2.8 Ixico PLC
- 16.2.8.1. Overview
- 16.2.8.2. Products
- 16.2.8.3. SWOT Analysis
- 16.2.8.4. Recent Developments
- 16.2.8.5. Financials (Based on Availability)
- 16.2.9 Clario
- 16.2.9.1. Overview
- 16.2.9.2. Products
- 16.2.9.3. SWOT Analysis
- 16.2.9.4. Recent Developments
- 16.2.9.5. Financials (Based on Availability)
- 16.2.10 Resonance Health
- 16.2.10.1. Overview
- 16.2.10.2. Products
- 16.2.10.3. SWOT Analysis
- 16.2.10.4. Recent Developments
- 16.2.10.5. Financials (Based on Availability)
- 16.2.11 Medpace
- 16.2.11.1. Overview
- 16.2.11.2. Products
- 16.2.11.3. SWOT Analysis
- 16.2.11.4. Recent Developments
- 16.2.11.5. Financials (Based on Availability)
- 16.2.12 Icon PLC
- 16.2.12.1. Overview
- 16.2.12.2. Products
- 16.2.12.3. SWOT Analysis
- 16.2.12.4. Recent Developments
- 16.2.12.5. Financials (Based on Availability)
- 16.2.1 Navitas Clinical Research Inc
List of Figures
- Figure 1: Global Clinical Trial Imaging Services Market Revenue Breakdown (Million, %) by Region 2024 & 2032
- Figure 2: North America Clinical Trial Imaging Services Market Revenue (Million), by Country 2024 & 2032
- Figure 3: North America Clinical Trial Imaging Services Market Revenue Share (%), by Country 2024 & 2032
- Figure 4: Europe Clinical Trial Imaging Services Market Revenue (Million), by Country 2024 & 2032
- Figure 5: Europe Clinical Trial Imaging Services Market Revenue Share (%), by Country 2024 & 2032
- Figure 6: Asia Pacific Clinical Trial Imaging Services Market Revenue (Million), by Country 2024 & 2032
- Figure 7: Asia Pacific Clinical Trial Imaging Services Market Revenue Share (%), by Country 2024 & 2032
- Figure 8: Middle East and Africa Clinical Trial Imaging Services Market Revenue (Million), by Country 2024 & 2032
- Figure 9: Middle East and Africa Clinical Trial Imaging Services Market Revenue Share (%), by Country 2024 & 2032
- Figure 10: South America Clinical Trial Imaging Services Market Revenue (Million), by Country 2024 & 2032
- Figure 11: South America Clinical Trial Imaging Services Market Revenue Share (%), by Country 2024 & 2032
- Figure 12: North America Clinical Trial Imaging Services Market Revenue (Million), by Product and Service 2024 & 2032
- Figure 13: North America Clinical Trial Imaging Services Market Revenue Share (%), by Product and Service 2024 & 2032
- Figure 14: North America Clinical Trial Imaging Services Market Revenue (Million), by Modality 2024 & 2032
- Figure 15: North America Clinical Trial Imaging Services Market Revenue Share (%), by Modality 2024 & 2032
- Figure 16: North America Clinical Trial Imaging Services Market Revenue (Million), by End-User 2024 & 2032
- Figure 17: North America Clinical Trial Imaging Services Market Revenue Share (%), by End-User 2024 & 2032
- Figure 18: North America Clinical Trial Imaging Services Market Revenue (Million), by Country 2024 & 2032
- Figure 19: North America Clinical Trial Imaging Services Market Revenue Share (%), by Country 2024 & 2032
- Figure 20: Europe Clinical Trial Imaging Services Market Revenue (Million), by Product and Service 2024 & 2032
- Figure 21: Europe Clinical Trial Imaging Services Market Revenue Share (%), by Product and Service 2024 & 2032
- Figure 22: Europe Clinical Trial Imaging Services Market Revenue (Million), by Modality 2024 & 2032
- Figure 23: Europe Clinical Trial Imaging Services Market Revenue Share (%), by Modality 2024 & 2032
- Figure 24: Europe Clinical Trial Imaging Services Market Revenue (Million), by End-User 2024 & 2032
- Figure 25: Europe Clinical Trial Imaging Services Market Revenue Share (%), by End-User 2024 & 2032
- Figure 26: Europe Clinical Trial Imaging Services Market Revenue (Million), by Country 2024 & 2032
- Figure 27: Europe Clinical Trial Imaging Services Market Revenue Share (%), by Country 2024 & 2032
- Figure 28: Asia Pacific Clinical Trial Imaging Services Market Revenue (Million), by Product and Service 2024 & 2032
- Figure 29: Asia Pacific Clinical Trial Imaging Services Market Revenue Share (%), by Product and Service 2024 & 2032
- Figure 30: Asia Pacific Clinical Trial Imaging Services Market Revenue (Million), by Modality 2024 & 2032
- Figure 31: Asia Pacific Clinical Trial Imaging Services Market Revenue Share (%), by Modality 2024 & 2032
- Figure 32: Asia Pacific Clinical Trial Imaging Services Market Revenue (Million), by End-User 2024 & 2032
- Figure 33: Asia Pacific Clinical Trial Imaging Services Market Revenue Share (%), by End-User 2024 & 2032
- Figure 34: Asia Pacific Clinical Trial Imaging Services Market Revenue (Million), by Country 2024 & 2032
- Figure 35: Asia Pacific Clinical Trial Imaging Services Market Revenue Share (%), by Country 2024 & 2032
- Figure 36: Middle East and Africa Clinical Trial Imaging Services Market Revenue (Million), by Product and Service 2024 & 2032
- Figure 37: Middle East and Africa Clinical Trial Imaging Services Market Revenue Share (%), by Product and Service 2024 & 2032
- Figure 38: Middle East and Africa Clinical Trial Imaging Services Market Revenue (Million), by Modality 2024 & 2032
- Figure 39: Middle East and Africa Clinical Trial Imaging Services Market Revenue Share (%), by Modality 2024 & 2032
- Figure 40: Middle East and Africa Clinical Trial Imaging Services Market Revenue (Million), by End-User 2024 & 2032
- Figure 41: Middle East and Africa Clinical Trial Imaging Services Market Revenue Share (%), by End-User 2024 & 2032
- Figure 42: Middle East and Africa Clinical Trial Imaging Services Market Revenue (Million), by Country 2024 & 2032
- Figure 43: Middle East and Africa Clinical Trial Imaging Services Market Revenue Share (%), by Country 2024 & 2032
- Figure 44: South America Clinical Trial Imaging Services Market Revenue (Million), by Product and Service 2024 & 2032
- Figure 45: South America Clinical Trial Imaging Services Market Revenue Share (%), by Product and Service 2024 & 2032
- Figure 46: South America Clinical Trial Imaging Services Market Revenue (Million), by Modality 2024 & 2032
- Figure 47: South America Clinical Trial Imaging Services Market Revenue Share (%), by Modality 2024 & 2032
- Figure 48: South America Clinical Trial Imaging Services Market Revenue (Million), by End-User 2024 & 2032
- Figure 49: South America Clinical Trial Imaging Services Market Revenue Share (%), by End-User 2024 & 2032
- Figure 50: South America Clinical Trial Imaging Services Market Revenue (Million), by Country 2024 & 2032
- Figure 51: South America Clinical Trial Imaging Services Market Revenue Share (%), by Country 2024 & 2032
List of Tables
- Table 1: Global Clinical Trial Imaging Services Market Revenue Million Forecast, by Region 2019 & 2032
- Table 2: Global Clinical Trial Imaging Services Market Revenue Million Forecast, by Product and Service 2019 & 2032
- Table 3: Global Clinical Trial Imaging Services Market Revenue Million Forecast, by Modality 2019 & 2032
- Table 4: Global Clinical Trial Imaging Services Market Revenue Million Forecast, by End-User 2019 & 2032
- Table 5: Global Clinical Trial Imaging Services Market Revenue Million Forecast, by Region 2019 & 2032
- Table 6: Global Clinical Trial Imaging Services Market Revenue Million Forecast, by Country 2019 & 2032
- Table 7: United States Clinical Trial Imaging Services Market Revenue (Million) Forecast, by Application 2019 & 2032
- Table 8: Canada Clinical Trial Imaging Services Market Revenue (Million) Forecast, by Application 2019 & 2032
- Table 9: Mexico Clinical Trial Imaging Services Market Revenue (Million) Forecast, by Application 2019 & 2032
- Table 10: Global Clinical Trial Imaging Services Market Revenue Million Forecast, by Country 2019 & 2032
- Table 11: Germany Clinical Trial Imaging Services Market Revenue (Million) Forecast, by Application 2019 & 2032
- Table 12: United Kingdom Clinical Trial Imaging Services Market Revenue (Million) Forecast, by Application 2019 & 2032
- Table 13: France Clinical Trial Imaging Services Market Revenue (Million) Forecast, by Application 2019 & 2032
- Table 14: Italy Clinical Trial Imaging Services Market Revenue (Million) Forecast, by Application 2019 & 2032
- Table 15: Spain Clinical Trial Imaging Services Market Revenue (Million) Forecast, by Application 2019 & 2032
- Table 16: Rest of Europe Clinical Trial Imaging Services Market Revenue (Million) Forecast, by Application 2019 & 2032
- Table 17: Global Clinical Trial Imaging Services Market Revenue Million Forecast, by Country 2019 & 2032
- Table 18: China Clinical Trial Imaging Services Market Revenue (Million) Forecast, by Application 2019 & 2032
- Table 19: Japan Clinical Trial Imaging Services Market Revenue (Million) Forecast, by Application 2019 & 2032
- Table 20: India Clinical Trial Imaging Services Market Revenue (Million) Forecast, by Application 2019 & 2032
- Table 21: Australia Clinical Trial Imaging Services Market Revenue (Million) Forecast, by Application 2019 & 2032
- Table 22: South Korea Clinical Trial Imaging Services Market Revenue (Million) Forecast, by Application 2019 & 2032
- Table 23: Rest of Asia Pacific Clinical Trial Imaging Services Market Revenue (Million) Forecast, by Application 2019 & 2032
- Table 24: Global Clinical Trial Imaging Services Market Revenue Million Forecast, by Country 2019 & 2032
- Table 25: GCC Clinical Trial Imaging Services Market Revenue (Million) Forecast, by Application 2019 & 2032
- Table 26: South Africa Clinical Trial Imaging Services Market Revenue (Million) Forecast, by Application 2019 & 2032
- Table 27: Rest of Middle East and Africa Clinical Trial Imaging Services Market Revenue (Million) Forecast, by Application 2019 & 2032
- Table 28: Global Clinical Trial Imaging Services Market Revenue Million Forecast, by Country 2019 & 2032
- Table 29: Brazil Clinical Trial Imaging Services Market Revenue (Million) Forecast, by Application 2019 & 2032
- Table 30: Argentina Clinical Trial Imaging Services Market Revenue (Million) Forecast, by Application 2019 & 2032
- Table 31: Rest of South America Clinical Trial Imaging Services Market Revenue (Million) Forecast, by Application 2019 & 2032
- Table 32: Global Clinical Trial Imaging Services Market Revenue Million Forecast, by Product and Service 2019 & 2032
- Table 33: Global Clinical Trial Imaging Services Market Revenue Million Forecast, by Modality 2019 & 2032
- Table 34: Global Clinical Trial Imaging Services Market Revenue Million Forecast, by End-User 2019 & 2032
- Table 35: Global Clinical Trial Imaging Services Market Revenue Million Forecast, by Country 2019 & 2032
- Table 36: United States Clinical Trial Imaging Services Market Revenue (Million) Forecast, by Application 2019 & 2032
- Table 37: Canada Clinical Trial Imaging Services Market Revenue (Million) Forecast, by Application 2019 & 2032
- Table 38: Mexico Clinical Trial Imaging Services Market Revenue (Million) Forecast, by Application 2019 & 2032
- Table 39: Global Clinical Trial Imaging Services Market Revenue Million Forecast, by Product and Service 2019 & 2032
- Table 40: Global Clinical Trial Imaging Services Market Revenue Million Forecast, by Modality 2019 & 2032
- Table 41: Global Clinical Trial Imaging Services Market Revenue Million Forecast, by End-User 2019 & 2032
- Table 42: Global Clinical Trial Imaging Services Market Revenue Million Forecast, by Country 2019 & 2032
- Table 43: Germany Clinical Trial Imaging Services Market Revenue (Million) Forecast, by Application 2019 & 2032
- Table 44: United Kingdom Clinical Trial Imaging Services Market Revenue (Million) Forecast, by Application 2019 & 2032
- Table 45: France Clinical Trial Imaging Services Market Revenue (Million) Forecast, by Application 2019 & 2032
- Table 46: Italy Clinical Trial Imaging Services Market Revenue (Million) Forecast, by Application 2019 & 2032
- Table 47: Spain Clinical Trial Imaging Services Market Revenue (Million) Forecast, by Application 2019 & 2032
- Table 48: Rest of Europe Clinical Trial Imaging Services Market Revenue (Million) Forecast, by Application 2019 & 2032
- Table 49: Global Clinical Trial Imaging Services Market Revenue Million Forecast, by Product and Service 2019 & 2032
- Table 50: Global Clinical Trial Imaging Services Market Revenue Million Forecast, by Modality 2019 & 2032
- Table 51: Global Clinical Trial Imaging Services Market Revenue Million Forecast, by End-User 2019 & 2032
- Table 52: Global Clinical Trial Imaging Services Market Revenue Million Forecast, by Country 2019 & 2032
- Table 53: China Clinical Trial Imaging Services Market Revenue (Million) Forecast, by Application 2019 & 2032
- Table 54: Japan Clinical Trial Imaging Services Market Revenue (Million) Forecast, by Application 2019 & 2032
- Table 55: India Clinical Trial Imaging Services Market Revenue (Million) Forecast, by Application 2019 & 2032
- Table 56: Australia Clinical Trial Imaging Services Market Revenue (Million) Forecast, by Application 2019 & 2032
- Table 57: South Korea Clinical Trial Imaging Services Market Revenue (Million) Forecast, by Application 2019 & 2032
- Table 58: Rest of Asia Pacific Clinical Trial Imaging Services Market Revenue (Million) Forecast, by Application 2019 & 2032
- Table 59: Global Clinical Trial Imaging Services Market Revenue Million Forecast, by Product and Service 2019 & 2032
- Table 60: Global Clinical Trial Imaging Services Market Revenue Million Forecast, by Modality 2019 & 2032
- Table 61: Global Clinical Trial Imaging Services Market Revenue Million Forecast, by End-User 2019 & 2032
- Table 62: Global Clinical Trial Imaging Services Market Revenue Million Forecast, by Country 2019 & 2032
- Table 63: GCC Clinical Trial Imaging Services Market Revenue (Million) Forecast, by Application 2019 & 2032
- Table 64: South Africa Clinical Trial Imaging Services Market Revenue (Million) Forecast, by Application 2019 & 2032
- Table 65: Rest of Middle East and Africa Clinical Trial Imaging Services Market Revenue (Million) Forecast, by Application 2019 & 2032
- Table 66: Global Clinical Trial Imaging Services Market Revenue Million Forecast, by Product and Service 2019 & 2032
- Table 67: Global Clinical Trial Imaging Services Market Revenue Million Forecast, by Modality 2019 & 2032
- Table 68: Global Clinical Trial Imaging Services Market Revenue Million Forecast, by End-User 2019 & 2032
- Table 69: Global Clinical Trial Imaging Services Market Revenue Million Forecast, by Country 2019 & 2032
- Table 70: Brazil Clinical Trial Imaging Services Market Revenue (Million) Forecast, by Application 2019 & 2032
- Table 71: Argentina Clinical Trial Imaging Services Market Revenue (Million) Forecast, by Application 2019 & 2032
- Table 72: Rest of South America Clinical Trial Imaging Services Market Revenue (Million) Forecast, by Application 2019 & 2032
Frequently Asked Questions
1. What is the projected Compound Annual Growth Rate (CAGR) of the Clinical Trial Imaging Services Market?
The projected CAGR is approximately 5.38%.
2. Which companies are prominent players in the Clinical Trial Imaging Services Market?
Key companies in the market include Navitas Clinical Research Inc, Koninklijke Philips N V, Worldcare Clinical LLC, ProScan Imaging, Parexel International Corporation, Radiant Sage LLC, WIRB-Copernicus Group, Ixico PLC, Clario, Resonance Health, Medpace, Icon PLC.
3. What are the main segments of the Clinical Trial Imaging Services Market?
The market segments include Product and Service, Modality, End-User.
4. Can you provide details about the market size?
The market size is estimated to be USD 1.25 Million as of 2022.
5. What are some drivers contributing to market growth?
Increase in R&D Spending by the Pharmaceutical and Biotechnological Companies; Increasing Number of Contract Research Organization & Investment by Them.
6. What are the notable trends driving market growth?
Computed Tomography is Expected to Witness Rapid Growth Over the Forecast Period.
7. Are there any restraints impacting market growth?
High Implementation Barriers and Costs of Imaging Systems.
8. Can you provide examples of recent developments in the market?
In May 2022, at the International Society for Magnetic Resonance in Medicine (ISMRM) 2022 conference, Bruker launched innovative 7 Tesla and 9.4 Tesla conduction-cooled Maxwell magnets for its market-leading preclinical magnetic resonance imaging (MRI) systems portfolio.
9. What pricing options are available for accessing the report?
Pricing options include single-user, multi-user, and enterprise licenses priced at USD 4750, USD 5250, and USD 8750 respectively.
10. Is the market size provided in terms of value or volume?
The market size is provided in terms of value, measured in Million.
11. Are there any specific market keywords associated with the report?
Yes, the market keyword associated with the report is "Clinical Trial Imaging Services Market," which aids in identifying and referencing the specific market segment covered.
12. How do I determine which pricing option suits my needs best?
The pricing options vary based on user requirements and access needs. Individual users may opt for single-user licenses, while businesses requiring broader access may choose multi-user or enterprise licenses for cost-effective access to the report.
13. Are there any additional resources or data provided in the Clinical Trial Imaging Services Market report?
While the report offers comprehensive insights, it's advisable to review the specific contents or supplementary materials provided to ascertain if additional resources or data are available.
14. How can I stay updated on further developments or reports in the Clinical Trial Imaging Services Market?
To stay informed about further developments, trends, and reports in the Clinical Trial Imaging Services Market, consider subscribing to industry newsletters, following relevant companies and organizations, or regularly checking reputable industry news sources and publications.
Methodology
Step 1 - Identification of Relevant Samples Size from Population Database


Step 2 - Approaches for Defining Global Market Size (Value, Volume* & Price*)

Note*: In applicable scenarios
Step 3 - Data Sources
Primary Research
- Web Analytics
- Survey Reports
- Research Institute
- Latest Research Reports
- Opinion Leaders
Secondary Research
- Annual Reports
- White Paper
- Latest Press Release
- Industry Association
- Paid Database
- Investor Presentations

Step 4 - Data Triangulation
Involves using different sources of information in order to increase the validity of a study
These sources are likely to be stakeholders in a program - participants, other researchers, program staff, other community members, and so on.
Then we put all data in single framework & apply various statistical tools to find out the dynamic on the market.
During the analysis stage, feedback from the stakeholder groups would be compared to determine areas of agreement as well as areas of divergence


