

Key Insights
The Circulating Tumor Cells (CTC) market is poised for significant expansion, driven by advancements in diagnostic technologies and the growing demand for minimally invasive oncology tools. The global CTC market was valued at $14.04 billion in 2025, and is projected to grow at a Compound Annual Growth Rate (CAGR) of 13.92%. This growth is attributed to the increasing global cancer incidence, the rise of personalized medicine, and the critical need for early detection and treatment monitoring.
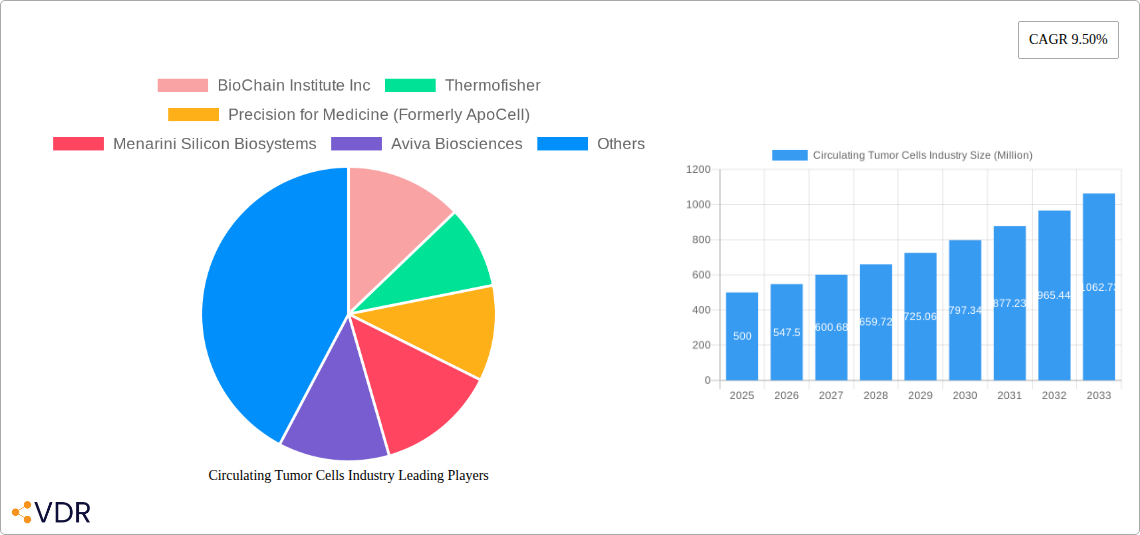
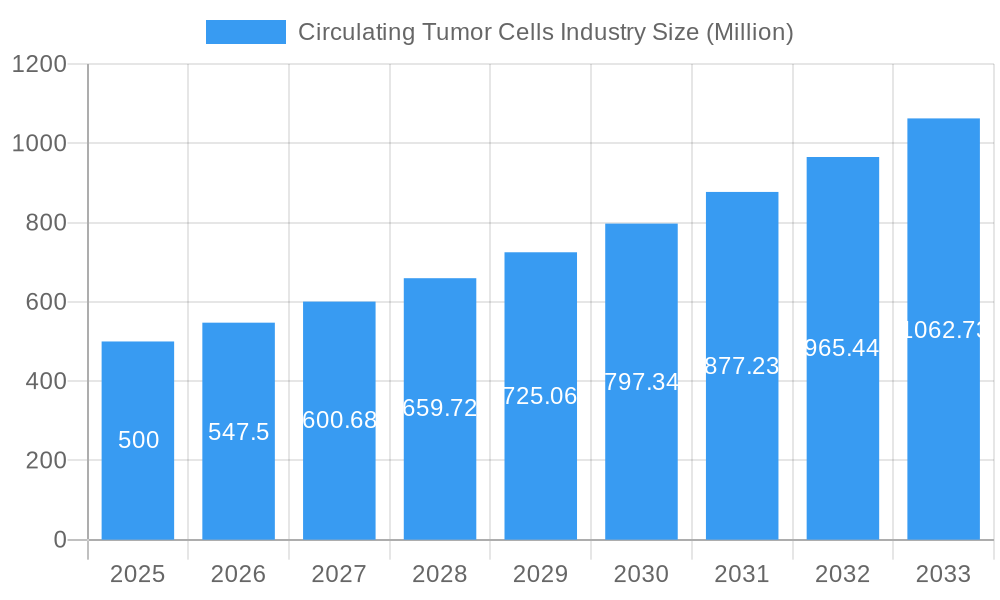
Circulating Tumor Cells Industry Market Size (In Billion)
Key innovations, including microfluidic devices, immunomagnetic separation for CTC enrichment, and sophisticated detection methods like next-generation sequencing and digital PCR, are pivotal drivers. The development of multi-parametric assays for RNA profiling, protein expression, and cellular communication further enhances CTC analysis capabilities across various cancer types.
Circulating Tumor Cells Industry Company Market Share
Despite challenges such as the high cost of advanced technologies, assay variability, and the need for standardized protocols, ongoing R&D efforts are focused on enhancing assay sensitivity, specificity, and affordability. North America currently leads the market, but the Asia Pacific region is expected to witness substantial growth due to increasing healthcare investments and awareness. Key industry players, including Thermo Fisher and Qiagen, are actively innovating their product portfolios to capture market share.
Circulating Tumor Cells (CTC) Industry Market Report: 2019-2033
This comprehensive report provides an in-depth analysis of the Circulating Tumor Cells (CTC) industry, encompassing market dynamics, growth trends, regional analysis, product landscape, key players, and future outlook. The report covers the parent market of liquid biopsy and the child market of CTC analysis, offering granular insights for investors, researchers, and industry professionals. The study period spans 2019-2033, with 2025 as the base and estimated year. The market size is presented in million units.
Circulating Tumor Cells Industry Market Dynamics & Structure
The CTC industry is characterized by a moderately concentrated market structure, with key players like Thermo Fisher Scientific, Qiagen NV, and Sysmex Corporation holding significant market share (estimated at xx% combined in 2025). Technological innovation is a crucial driver, with ongoing advancements in CTC enrichment and detection methods. Stringent regulatory frameworks, particularly concerning diagnostic applications, significantly impact market growth. Competitive substitutes, such as traditional tissue biopsies, pose a challenge, though CTC analysis offers advantages in minimally invasive procedures and real-time monitoring. The end-user demographic primarily comprises oncology clinics, research institutions, and pharmaceutical companies. M&A activity is moderate, with approximately xx deals recorded between 2019-2024, primarily focused on enhancing technological capabilities and expanding market reach.
- Market Concentration: Moderately concentrated, with top players holding xx% market share in 2025.
- Technological Innovation: Driven by advancements in microfluidics, imaging, and molecular analysis.
- Regulatory Landscape: Stringent regulatory approvals impact market entry and growth.
- Competitive Substitutes: Traditional biopsy methods present competition but CTC offers less invasive alternatives.
- End-User Demographics: Oncology clinics, research institutions, pharmaceutical companies.
- M&A Activity: Approx. xx deals between 2019-2024, focusing on technology and market expansion.
- Innovation Barriers: High R&D costs, stringent regulatory approvals, and complex analytical procedures.
Circulating Tumor Cells Industry Growth Trends & Insights
The global CTC market experienced robust growth during the historical period (2019-2024), expanding from xx million units in 2019 to xx million units in 2024, representing a CAGR of xx%. This growth is attributed to increasing cancer prevalence, rising demand for personalized medicine, and technological advancements driving improved sensitivity and specificity of CTC detection. Adoption rates are projected to increase significantly in the forecast period (2025-2033), driven by the expanding understanding of CTC's role in cancer progression and treatment response. Technological disruptions, particularly in AI-powered image analysis and liquid biopsy platforms, further accelerate market penetration. Consumer behavior shifts towards minimally invasive diagnostic methods fuel market expansion. The market is expected to reach xx million units by 2033, exhibiting a CAGR of xx% during the forecast period. Key factors influencing growth include increasing demand for early cancer detection and personalized treatment strategies.
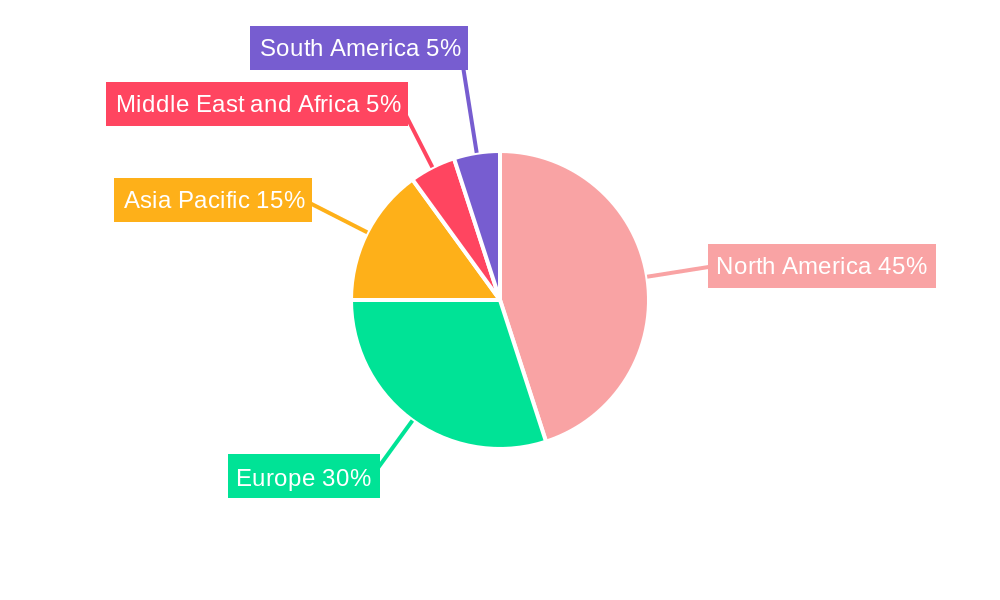
Dominant Regions, Countries, or Segments in Circulating Tumor Cells Industry
North America currently dominates the CTC market, owing to advanced healthcare infrastructure, high cancer prevalence, and significant investments in R&D. Europe follows as a key market, exhibiting substantial growth potential due to increasing adoption of advanced diagnostic techniques. Within the segment analysis, CTC enrichment methods (e.g., microfluidic devices, antibody-based separation) comprise the largest market share, followed by CTC detection methods (e.g., microscopy, PCR, next-generation sequencing). The application segment focused on Multiple Chromosome Abnormalities is currently the largest segment, driven by the high demand for early-stage cancer diagnostics. However, RNA profiling, protein expression, and cellular communication applications are rapidly expanding, fueled by research revealing the value of comprehensive CTC characterization.
- North America: Dominates market share due to robust healthcare infrastructure and R&D investments.
- Europe: Strong growth potential driven by increasing adoption of advanced diagnostic techniques.
- CTC Enrichment Methods: Largest segment by market share.
- CTC Detection Methods: Significant growth projected due to technological advancements.
- Multiple Chromosome Abnormalities: Leading application segment driven by early cancer diagnosis needs.
- RNA Profiling, Protein Expression, Cellular Communication: Rapidly expanding application segments.
- Key Drivers: Increased cancer prevalence, technological advancements, investment in healthcare infrastructure, supportive government policies.
Circulating Tumor Cells Industry Product Landscape
The CTC product landscape is dynamic, with manufacturers offering a range of solutions encompassing enrichment technologies (e.g., microfluidic chips, magnetic beads), detection platforms (e.g., automated imaging systems, molecular profiling tools), and comprehensive analysis software. Recent innovations focus on improving the sensitivity and specificity of CTC isolation and characterization, integrating AI and machine learning for enhanced data analysis, and developing user-friendly platforms for wider accessibility. Unique selling propositions include improved throughput, reduced assay times, and enhanced analytical capabilities.
Key Drivers, Barriers & Challenges in Circulating Tumor Cells Industry
Key Drivers: Increasing cancer incidence, demand for personalized medicine, technological advancements in CTC isolation and analysis, and supportive regulatory frameworks are driving market growth.
Challenges: High cost of tests, complexity of procedures, limited standardization across platforms, and the need for skilled personnel pose significant challenges. Supply chain issues and competition from traditional biopsy methods further impact growth.
Emerging Opportunities in Circulating Tumor Cells Industry
Untapped markets in emerging economies, development of point-of-care CTC detection systems, integration with other liquid biopsy technologies (e.g., circulating DNA), and expansion into new applications (e.g., monitoring treatment response, detecting drug resistance) represent key opportunities.
Growth Accelerators in the Circulating Tumor Cells Industry
Technological advancements, strategic partnerships between diagnostic companies and pharmaceutical firms, and expansion into new geographical markets will fuel long-term growth. Furthermore, investments in R&D and supportive government policies will significantly impact the market trajectory.
Key Players Shaping the Circulating Tumor Cells Industry Market
- BioChain Institute Inc
- Thermofisher
- Precision for Medicine (Formerly ApoCell)
- Menarini Silicon Biosystems
- Aviva Biosciences
- Creatv Micro Tech Inc
- Miltenyi Biotec
- LungLife AI Inc
- Sysmex Corporation
- Qiagen NV
- Advanced Cell Diagnostics Inc
- Biocept Inc
Notable Milestones in Circulating Tumor Cells Industry Sector
- July 2021: Datar Cancer Genetics' CE-marked 'Trueblood-Prostate' test receives NICE approval in the UK.
- February 2021: Menarini Silicon Biosystems launches CellMag product line for CTC enrichment and staining.
In-Depth Circulating Tumor Cells Industry Market Outlook
The CTC industry holds substantial promise, with projected strong growth driven by continuous technological advancements, increasing adoption of personalized medicine, and expanding applications in cancer diagnosis and treatment. Strategic partnerships, investments in R&D, and focused market expansion will shape the future landscape, creating lucrative opportunities for established players and emerging innovators alike.
Circulating Tumor Cells Industry Segmentation
-
1. Technology
-
1.1. CTC Enrichment Methods
- 1.1.1. Positive Enrichment
- 1.1.2. Negative Enrichment
- 1.1.3. Other Technologies
-
1.2. CTC Detection Methods
- 1.2.1. Immunocytochemical Technology
- 1.2.2. Molecular (RNA)-based Technology
- 1.2.3. Other CTC Detection Methods
-
1.1. CTC Enrichment Methods
-
2. Application
- 2.1. Multiple Chromosome Abnormalities
- 2.2. RNA Profiling
- 2.3. Protein Expression
- 2.4. Cellular Communication
- 2.5. Other Applications
Circulating Tumor Cells Industry Segmentation By Geography
-
1. North America
- 1.1. United States
- 1.2. Canada
- 1.3. Mexico
-
2. Europe
- 2.1. Germany
- 2.2. United Kingdom
- 2.3. France
- 2.4. Italy
- 2.5. Spain
- 2.6. Rest of Europe
-
3. Asia Pacific
- 3.1. China
- 3.2. Japan
- 3.3. India
- 3.4. Australia
- 3.5. South Korea
- 3.6. Rest of Asia Pacific
-
4. Middle East and Africa
- 4.1. GCC
- 4.2. South Africa
- 4.3. Rest of Middle East and Africa
-
5. South America
- 5.1. Brazil
- 5.2. Argentina
- 5.3. Rest of South America
Circulating Tumor Cells Industry Regional Market Share
Geographic Coverage of Circulating Tumor Cells Industry
Circulating Tumor Cells Industry REPORT HIGHLIGHTS
| Aspects | Details |
|---|---|
| Study Period | 2020-2034 |
| Base Year | 2025 |
| Estimated Year | 2026 |
| Forecast Period | 2026-2034 |
| Historical Period | 2020-2025 |
| Growth Rate | CAGR of 13.92% from 2020-2034 |
| Segmentation |
|
Table of Contents
- 1. Introduction
- 1.1. Research Scope
- 1.2. Market Segmentation
- 1.3. Research Objective
- 1.4. Definitions and Assumptions
- 2. Executive Summary
- 2.1. Market Snapshot
- 3. Market Dynamics
- 3.1. Market Drivers
- 3.2. Market Restrains
- 3.3. Market Trends
- 3.4. Market Opportunities
- 4. Market Factor Analysis
- 4.1. Porters Five Forces
- 4.1.1. Bargaining Power of Suppliers
- 4.1.2. Bargaining Power of Buyers
- 4.1.3. Threat of New Entrants
- 4.1.4. Threat of Substitutes
- 4.1.5. Competitive Rivalry
- 4.2. PESTEL analysis
- 4.3. BCG Analysis
- 4.3.1. Stars (High Growth, High Market Share)
- 4.3.2. Cash Cows (Low Growth, High Market Share)
- 4.3.3. Question Mark (High Growth, Low Market Share)
- 4.3.4. Dogs (Low Growth, Low Market Share)
- 4.4. Ansoff Matrix Analysis
- 4.5. Supply Chain Analysis
- 4.6. Regulatory Landscape
- 4.7. Current Market Potential and Opportunity Assessment (TAM–SAM–SOM Framework)
- 4.8. VDR Analyst Note
- 4.1. Porters Five Forces
- 5. Market Analysis, Insights and Forecast 2021-2033
- 5.1. Market Analysis, Insights and Forecast - by Technology
- 5.1.1. CTC Enrichment Methods
- 5.1.1.1. Positive Enrichment
- 5.1.1.2. Negative Enrichment
- 5.1.1.3. Other Technologies
- 5.1.2. CTC Detection Methods
- 5.1.2.1. Immunocytochemical Technology
- 5.1.2.2. Molecular (RNA)-based Technology
- 5.1.2.3. Other CTC Detection Methods
- 5.1.1. CTC Enrichment Methods
- 5.2. Market Analysis, Insights and Forecast - by Application
- 5.2.1. Multiple Chromosome Abnormalities
- 5.2.2. RNA Profiling
- 5.2.3. Protein Expression
- 5.2.4. Cellular Communication
- 5.2.5. Other Applications
- 5.3. Market Analysis, Insights and Forecast - by Region
- 5.3.1. North America
- 5.3.2. Europe
- 5.3.3. Asia Pacific
- 5.3.4. Middle East and Africa
- 5.3.5. South America
- 5.1. Market Analysis, Insights and Forecast - by Technology
- 6. Global Circulating Tumor Cells Industry Analysis, Insights and Forecast, 2021-2033
- 6.1. Market Analysis, Insights and Forecast - by Technology
- 6.1.1. CTC Enrichment Methods
- 6.1.1.1. Positive Enrichment
- 6.1.1.2. Negative Enrichment
- 6.1.1.3. Other Technologies
- 6.1.2. CTC Detection Methods
- 6.1.2.1. Immunocytochemical Technology
- 6.1.2.2. Molecular (RNA)-based Technology
- 6.1.2.3. Other CTC Detection Methods
- 6.1.1. CTC Enrichment Methods
- 6.2. Market Analysis, Insights and Forecast - by Application
- 6.2.1. Multiple Chromosome Abnormalities
- 6.2.2. RNA Profiling
- 6.2.3. Protein Expression
- 6.2.4. Cellular Communication
- 6.2.5. Other Applications
- 6.1. Market Analysis, Insights and Forecast - by Technology
- 7. North America Circulating Tumor Cells Industry Analysis, Insights and Forecast, 2021-2033
- 7.1. Market Analysis, Insights and Forecast - by Technology
- 7.1.1. CTC Enrichment Methods
- 7.1.1.1. Positive Enrichment
- 7.1.1.2. Negative Enrichment
- 7.1.1.3. Other Technologies
- 7.1.2. CTC Detection Methods
- 7.1.2.1. Immunocytochemical Technology
- 7.1.2.2. Molecular (RNA)-based Technology
- 7.1.2.3. Other CTC Detection Methods
- 7.1.1. CTC Enrichment Methods
- 7.2. Market Analysis, Insights and Forecast - by Application
- 7.2.1. Multiple Chromosome Abnormalities
- 7.2.2. RNA Profiling
- 7.2.3. Protein Expression
- 7.2.4. Cellular Communication
- 7.2.5. Other Applications
- 7.1. Market Analysis, Insights and Forecast - by Technology
- 8. Europe Circulating Tumor Cells Industry Analysis, Insights and Forecast, 2021-2033
- 8.1. Market Analysis, Insights and Forecast - by Technology
- 8.1.1. CTC Enrichment Methods
- 8.1.1.1. Positive Enrichment
- 8.1.1.2. Negative Enrichment
- 8.1.1.3. Other Technologies
- 8.1.2. CTC Detection Methods
- 8.1.2.1. Immunocytochemical Technology
- 8.1.2.2. Molecular (RNA)-based Technology
- 8.1.2.3. Other CTC Detection Methods
- 8.1.1. CTC Enrichment Methods
- 8.2. Market Analysis, Insights and Forecast - by Application
- 8.2.1. Multiple Chromosome Abnormalities
- 8.2.2. RNA Profiling
- 8.2.3. Protein Expression
- 8.2.4. Cellular Communication
- 8.2.5. Other Applications
- 8.1. Market Analysis, Insights and Forecast - by Technology
- 9. Asia Pacific Circulating Tumor Cells Industry Analysis, Insights and Forecast, 2021-2033
- 9.1. Market Analysis, Insights and Forecast - by Technology
- 9.1.1. CTC Enrichment Methods
- 9.1.1.1. Positive Enrichment
- 9.1.1.2. Negative Enrichment
- 9.1.1.3. Other Technologies
- 9.1.2. CTC Detection Methods
- 9.1.2.1. Immunocytochemical Technology
- 9.1.2.2. Molecular (RNA)-based Technology
- 9.1.2.3. Other CTC Detection Methods
- 9.1.1. CTC Enrichment Methods
- 9.2. Market Analysis, Insights and Forecast - by Application
- 9.2.1. Multiple Chromosome Abnormalities
- 9.2.2. RNA Profiling
- 9.2.3. Protein Expression
- 9.2.4. Cellular Communication
- 9.2.5. Other Applications
- 9.1. Market Analysis, Insights and Forecast - by Technology
- 10. Middle East and Africa Circulating Tumor Cells Industry Analysis, Insights and Forecast, 2021-2033
- 10.1. Market Analysis, Insights and Forecast - by Technology
- 10.1.1. CTC Enrichment Methods
- 10.1.1.1. Positive Enrichment
- 10.1.1.2. Negative Enrichment
- 10.1.1.3. Other Technologies
- 10.1.2. CTC Detection Methods
- 10.1.2.1. Immunocytochemical Technology
- 10.1.2.2. Molecular (RNA)-based Technology
- 10.1.2.3. Other CTC Detection Methods
- 10.1.1. CTC Enrichment Methods
- 10.2. Market Analysis, Insights and Forecast - by Application
- 10.2.1. Multiple Chromosome Abnormalities
- 10.2.2. RNA Profiling
- 10.2.3. Protein Expression
- 10.2.4. Cellular Communication
- 10.2.5. Other Applications
- 10.1. Market Analysis, Insights and Forecast - by Technology
- 11. South America Circulating Tumor Cells Industry Analysis, Insights and Forecast, 2021-2033
- 11.1. Market Analysis, Insights and Forecast - by Technology
- 11.1.1. CTC Enrichment Methods
- 11.1.1.1. Positive Enrichment
- 11.1.1.2. Negative Enrichment
- 11.1.1.3. Other Technologies
- 11.1.2. CTC Detection Methods
- 11.1.2.1. Immunocytochemical Technology
- 11.1.2.2. Molecular (RNA)-based Technology
- 11.1.2.3. Other CTC Detection Methods
- 11.1.1. CTC Enrichment Methods
- 11.2. Market Analysis, Insights and Forecast - by Application
- 11.2.1. Multiple Chromosome Abnormalities
- 11.2.2. RNA Profiling
- 11.2.3. Protein Expression
- 11.2.4. Cellular Communication
- 11.2.5. Other Applications
- 11.1. Market Analysis, Insights and Forecast - by Technology
- 12. Competitive Analysis
- 12.1. Company Profiles
- 12.1.1 BioChain Institute Inc
- 12.1.1.1. Company Overview
- 12.1.1.2. Products
- 12.1.1.3. Company Financials
- 12.1.1.4. SWOT Analysis
- 12.1.2 Thermofisher
- 12.1.2.1. Company Overview
- 12.1.2.2. Products
- 12.1.2.3. Company Financials
- 12.1.2.4. SWOT Analysis
- 12.1.3 Precision for Medicine (Formerly ApoCell)
- 12.1.3.1. Company Overview
- 12.1.3.2. Products
- 12.1.3.3. Company Financials
- 12.1.3.4. SWOT Analysis
- 12.1.4 Menarini Silicon Biosystems
- 12.1.4.1. Company Overview
- 12.1.4.2. Products
- 12.1.4.3. Company Financials
- 12.1.4.4. SWOT Analysis
- 12.1.5 Aviva Biosciences
- 12.1.5.1. Company Overview
- 12.1.5.2. Products
- 12.1.5.3. Company Financials
- 12.1.5.4. SWOT Analysis
- 12.1.6 Creatv Micro Tech Inc
- 12.1.6.1. Company Overview
- 12.1.6.2. Products
- 12.1.6.3. Company Financials
- 12.1.6.4. SWOT Analysis
- 12.1.7 Miltenyi Biotec
- 12.1.7.1. Company Overview
- 12.1.7.2. Products
- 12.1.7.3. Company Financials
- 12.1.7.4. SWOT Analysis
- 12.1.8 LungLife AI Inc
- 12.1.8.1. Company Overview
- 12.1.8.2. Products
- 12.1.8.3. Company Financials
- 12.1.8.4. SWOT Analysis
- 12.1.9 Sysmex Corporation
- 12.1.9.1. Company Overview
- 12.1.9.2. Products
- 12.1.9.3. Company Financials
- 12.1.9.4. SWOT Analysis
- 12.1.10 Qiagen NV
- 12.1.10.1. Company Overview
- 12.1.10.2. Products
- 12.1.10.3. Company Financials
- 12.1.10.4. SWOT Analysis
- 12.1.11 Advanced Cell Diagnostics Inc
- 12.1.11.1. Company Overview
- 12.1.11.2. Products
- 12.1.11.3. Company Financials
- 12.1.11.4. SWOT Analysis
- 12.1.12 Biocept Inc
- 12.1.12.1. Company Overview
- 12.1.12.2. Products
- 12.1.12.3. Company Financials
- 12.1.12.4. SWOT Analysis
- 12.1.1 BioChain Institute Inc
- 12.2. Market Entropy
- 12.2.1 Company's Key Areas Served
- 12.2.2 Recent Developments
- 12.3. Company Market Share Analysis 2025
- 12.3.1 Top 5 Companies Market Share Analysis
- 12.3.2 Top 3 Companies Market Share Analysis
- 12.4. List of Potential Customers
- 13. Research Methodology
List of Figures
- Figure 1: Global Circulating Tumor Cells Industry Revenue Breakdown (billion, %) by Region 2025 & 2033
- Figure 2: Global Circulating Tumor Cells Industry Volume Breakdown (K Unit, %) by Region 2025 & 2033
- Figure 3: North America Circulating Tumor Cells Industry Revenue (billion), by Technology 2025 & 2033
- Figure 4: North America Circulating Tumor Cells Industry Volume (K Unit), by Technology 2025 & 2033
- Figure 5: North America Circulating Tumor Cells Industry Revenue Share (%), by Technology 2025 & 2033
- Figure 6: North America Circulating Tumor Cells Industry Volume Share (%), by Technology 2025 & 2033
- Figure 7: North America Circulating Tumor Cells Industry Revenue (billion), by Application 2025 & 2033
- Figure 8: North America Circulating Tumor Cells Industry Volume (K Unit), by Application 2025 & 2033
- Figure 9: North America Circulating Tumor Cells Industry Revenue Share (%), by Application 2025 & 2033
- Figure 10: North America Circulating Tumor Cells Industry Volume Share (%), by Application 2025 & 2033
- Figure 11: North America Circulating Tumor Cells Industry Revenue (billion), by Country 2025 & 2033
- Figure 12: North America Circulating Tumor Cells Industry Volume (K Unit), by Country 2025 & 2033
- Figure 13: North America Circulating Tumor Cells Industry Revenue Share (%), by Country 2025 & 2033
- Figure 14: North America Circulating Tumor Cells Industry Volume Share (%), by Country 2025 & 2033
- Figure 15: Europe Circulating Tumor Cells Industry Revenue (billion), by Technology 2025 & 2033
- Figure 16: Europe Circulating Tumor Cells Industry Volume (K Unit), by Technology 2025 & 2033
- Figure 17: Europe Circulating Tumor Cells Industry Revenue Share (%), by Technology 2025 & 2033
- Figure 18: Europe Circulating Tumor Cells Industry Volume Share (%), by Technology 2025 & 2033
- Figure 19: Europe Circulating Tumor Cells Industry Revenue (billion), by Application 2025 & 2033
- Figure 20: Europe Circulating Tumor Cells Industry Volume (K Unit), by Application 2025 & 2033
- Figure 21: Europe Circulating Tumor Cells Industry Revenue Share (%), by Application 2025 & 2033
- Figure 22: Europe Circulating Tumor Cells Industry Volume Share (%), by Application 2025 & 2033
- Figure 23: Europe Circulating Tumor Cells Industry Revenue (billion), by Country 2025 & 2033
- Figure 24: Europe Circulating Tumor Cells Industry Volume (K Unit), by Country 2025 & 2033
- Figure 25: Europe Circulating Tumor Cells Industry Revenue Share (%), by Country 2025 & 2033
- Figure 26: Europe Circulating Tumor Cells Industry Volume Share (%), by Country 2025 & 2033
- Figure 27: Asia Pacific Circulating Tumor Cells Industry Revenue (billion), by Technology 2025 & 2033
- Figure 28: Asia Pacific Circulating Tumor Cells Industry Volume (K Unit), by Technology 2025 & 2033
- Figure 29: Asia Pacific Circulating Tumor Cells Industry Revenue Share (%), by Technology 2025 & 2033
- Figure 30: Asia Pacific Circulating Tumor Cells Industry Volume Share (%), by Technology 2025 & 2033
- Figure 31: Asia Pacific Circulating Tumor Cells Industry Revenue (billion), by Application 2025 & 2033
- Figure 32: Asia Pacific Circulating Tumor Cells Industry Volume (K Unit), by Application 2025 & 2033
- Figure 33: Asia Pacific Circulating Tumor Cells Industry Revenue Share (%), by Application 2025 & 2033
- Figure 34: Asia Pacific Circulating Tumor Cells Industry Volume Share (%), by Application 2025 & 2033
- Figure 35: Asia Pacific Circulating Tumor Cells Industry Revenue (billion), by Country 2025 & 2033
- Figure 36: Asia Pacific Circulating Tumor Cells Industry Volume (K Unit), by Country 2025 & 2033
- Figure 37: Asia Pacific Circulating Tumor Cells Industry Revenue Share (%), by Country 2025 & 2033
- Figure 38: Asia Pacific Circulating Tumor Cells Industry Volume Share (%), by Country 2025 & 2033
- Figure 39: Middle East and Africa Circulating Tumor Cells Industry Revenue (billion), by Technology 2025 & 2033
- Figure 40: Middle East and Africa Circulating Tumor Cells Industry Volume (K Unit), by Technology 2025 & 2033
- Figure 41: Middle East and Africa Circulating Tumor Cells Industry Revenue Share (%), by Technology 2025 & 2033
- Figure 42: Middle East and Africa Circulating Tumor Cells Industry Volume Share (%), by Technology 2025 & 2033
- Figure 43: Middle East and Africa Circulating Tumor Cells Industry Revenue (billion), by Application 2025 & 2033
- Figure 44: Middle East and Africa Circulating Tumor Cells Industry Volume (K Unit), by Application 2025 & 2033
- Figure 45: Middle East and Africa Circulating Tumor Cells Industry Revenue Share (%), by Application 2025 & 2033
- Figure 46: Middle East and Africa Circulating Tumor Cells Industry Volume Share (%), by Application 2025 & 2033
- Figure 47: Middle East and Africa Circulating Tumor Cells Industry Revenue (billion), by Country 2025 & 2033
- Figure 48: Middle East and Africa Circulating Tumor Cells Industry Volume (K Unit), by Country 2025 & 2033
- Figure 49: Middle East and Africa Circulating Tumor Cells Industry Revenue Share (%), by Country 2025 & 2033
- Figure 50: Middle East and Africa Circulating Tumor Cells Industry Volume Share (%), by Country 2025 & 2033
- Figure 51: South America Circulating Tumor Cells Industry Revenue (billion), by Technology 2025 & 2033
- Figure 52: South America Circulating Tumor Cells Industry Volume (K Unit), by Technology 2025 & 2033
- Figure 53: South America Circulating Tumor Cells Industry Revenue Share (%), by Technology 2025 & 2033
- Figure 54: South America Circulating Tumor Cells Industry Volume Share (%), by Technology 2025 & 2033
- Figure 55: South America Circulating Tumor Cells Industry Revenue (billion), by Application 2025 & 2033
- Figure 56: South America Circulating Tumor Cells Industry Volume (K Unit), by Application 2025 & 2033
- Figure 57: South America Circulating Tumor Cells Industry Revenue Share (%), by Application 2025 & 2033
- Figure 58: South America Circulating Tumor Cells Industry Volume Share (%), by Application 2025 & 2033
- Figure 59: South America Circulating Tumor Cells Industry Revenue (billion), by Country 2025 & 2033
- Figure 60: South America Circulating Tumor Cells Industry Volume (K Unit), by Country 2025 & 2033
- Figure 61: South America Circulating Tumor Cells Industry Revenue Share (%), by Country 2025 & 2033
- Figure 62: South America Circulating Tumor Cells Industry Volume Share (%), by Country 2025 & 2033
List of Tables
- Table 1: Global Circulating Tumor Cells Industry Revenue billion Forecast, by Technology 2020 & 2033
- Table 2: Global Circulating Tumor Cells Industry Volume K Unit Forecast, by Technology 2020 & 2033
- Table 3: Global Circulating Tumor Cells Industry Revenue billion Forecast, by Application 2020 & 2033
- Table 4: Global Circulating Tumor Cells Industry Volume K Unit Forecast, by Application 2020 & 2033
- Table 5: Global Circulating Tumor Cells Industry Revenue billion Forecast, by Region 2020 & 2033
- Table 6: Global Circulating Tumor Cells Industry Volume K Unit Forecast, by Region 2020 & 2033
- Table 7: Global Circulating Tumor Cells Industry Revenue billion Forecast, by Technology 2020 & 2033
- Table 8: Global Circulating Tumor Cells Industry Volume K Unit Forecast, by Technology 2020 & 2033
- Table 9: Global Circulating Tumor Cells Industry Revenue billion Forecast, by Application 2020 & 2033
- Table 10: Global Circulating Tumor Cells Industry Volume K Unit Forecast, by Application 2020 & 2033
- Table 11: Global Circulating Tumor Cells Industry Revenue billion Forecast, by Country 2020 & 2033
- Table 12: Global Circulating Tumor Cells Industry Volume K Unit Forecast, by Country 2020 & 2033
- Table 13: United States Circulating Tumor Cells Industry Revenue (billion) Forecast, by Application 2020 & 2033
- Table 14: United States Circulating Tumor Cells Industry Volume (K Unit) Forecast, by Application 2020 & 2033
- Table 15: Canada Circulating Tumor Cells Industry Revenue (billion) Forecast, by Application 2020 & 2033
- Table 16: Canada Circulating Tumor Cells Industry Volume (K Unit) Forecast, by Application 2020 & 2033
- Table 17: Mexico Circulating Tumor Cells Industry Revenue (billion) Forecast, by Application 2020 & 2033
- Table 18: Mexico Circulating Tumor Cells Industry Volume (K Unit) Forecast, by Application 2020 & 2033
- Table 19: Global Circulating Tumor Cells Industry Revenue billion Forecast, by Technology 2020 & 2033
- Table 20: Global Circulating Tumor Cells Industry Volume K Unit Forecast, by Technology 2020 & 2033
- Table 21: Global Circulating Tumor Cells Industry Revenue billion Forecast, by Application 2020 & 2033
- Table 22: Global Circulating Tumor Cells Industry Volume K Unit Forecast, by Application 2020 & 2033
- Table 23: Global Circulating Tumor Cells Industry Revenue billion Forecast, by Country 2020 & 2033
- Table 24: Global Circulating Tumor Cells Industry Volume K Unit Forecast, by Country 2020 & 2033
- Table 25: Germany Circulating Tumor Cells Industry Revenue (billion) Forecast, by Application 2020 & 2033
- Table 26: Germany Circulating Tumor Cells Industry Volume (K Unit) Forecast, by Application 2020 & 2033
- Table 27: United Kingdom Circulating Tumor Cells Industry Revenue (billion) Forecast, by Application 2020 & 2033
- Table 28: United Kingdom Circulating Tumor Cells Industry Volume (K Unit) Forecast, by Application 2020 & 2033
- Table 29: France Circulating Tumor Cells Industry Revenue (billion) Forecast, by Application 2020 & 2033
- Table 30: France Circulating Tumor Cells Industry Volume (K Unit) Forecast, by Application 2020 & 2033
- Table 31: Italy Circulating Tumor Cells Industry Revenue (billion) Forecast, by Application 2020 & 2033
- Table 32: Italy Circulating Tumor Cells Industry Volume (K Unit) Forecast, by Application 2020 & 2033
- Table 33: Spain Circulating Tumor Cells Industry Revenue (billion) Forecast, by Application 2020 & 2033
- Table 34: Spain Circulating Tumor Cells Industry Volume (K Unit) Forecast, by Application 2020 & 2033
- Table 35: Rest of Europe Circulating Tumor Cells Industry Revenue (billion) Forecast, by Application 2020 & 2033
- Table 36: Rest of Europe Circulating Tumor Cells Industry Volume (K Unit) Forecast, by Application 2020 & 2033
- Table 37: Global Circulating Tumor Cells Industry Revenue billion Forecast, by Technology 2020 & 2033
- Table 38: Global Circulating Tumor Cells Industry Volume K Unit Forecast, by Technology 2020 & 2033
- Table 39: Global Circulating Tumor Cells Industry Revenue billion Forecast, by Application 2020 & 2033
- Table 40: Global Circulating Tumor Cells Industry Volume K Unit Forecast, by Application 2020 & 2033
- Table 41: Global Circulating Tumor Cells Industry Revenue billion Forecast, by Country 2020 & 2033
- Table 42: Global Circulating Tumor Cells Industry Volume K Unit Forecast, by Country 2020 & 2033
- Table 43: China Circulating Tumor Cells Industry Revenue (billion) Forecast, by Application 2020 & 2033
- Table 44: China Circulating Tumor Cells Industry Volume (K Unit) Forecast, by Application 2020 & 2033
- Table 45: Japan Circulating Tumor Cells Industry Revenue (billion) Forecast, by Application 2020 & 2033
- Table 46: Japan Circulating Tumor Cells Industry Volume (K Unit) Forecast, by Application 2020 & 2033
- Table 47: India Circulating Tumor Cells Industry Revenue (billion) Forecast, by Application 2020 & 2033
- Table 48: India Circulating Tumor Cells Industry Volume (K Unit) Forecast, by Application 2020 & 2033
- Table 49: Australia Circulating Tumor Cells Industry Revenue (billion) Forecast, by Application 2020 & 2033
- Table 50: Australia Circulating Tumor Cells Industry Volume (K Unit) Forecast, by Application 2020 & 2033
- Table 51: South Korea Circulating Tumor Cells Industry Revenue (billion) Forecast, by Application 2020 & 2033
- Table 52: South Korea Circulating Tumor Cells Industry Volume (K Unit) Forecast, by Application 2020 & 2033
- Table 53: Rest of Asia Pacific Circulating Tumor Cells Industry Revenue (billion) Forecast, by Application 2020 & 2033
- Table 54: Rest of Asia Pacific Circulating Tumor Cells Industry Volume (K Unit) Forecast, by Application 2020 & 2033
- Table 55: Global Circulating Tumor Cells Industry Revenue billion Forecast, by Technology 2020 & 2033
- Table 56: Global Circulating Tumor Cells Industry Volume K Unit Forecast, by Technology 2020 & 2033
- Table 57: Global Circulating Tumor Cells Industry Revenue billion Forecast, by Application 2020 & 2033
- Table 58: Global Circulating Tumor Cells Industry Volume K Unit Forecast, by Application 2020 & 2033
- Table 59: Global Circulating Tumor Cells Industry Revenue billion Forecast, by Country 2020 & 2033
- Table 60: Global Circulating Tumor Cells Industry Volume K Unit Forecast, by Country 2020 & 2033
- Table 61: GCC Circulating Tumor Cells Industry Revenue (billion) Forecast, by Application 2020 & 2033
- Table 62: GCC Circulating Tumor Cells Industry Volume (K Unit) Forecast, by Application 2020 & 2033
- Table 63: South Africa Circulating Tumor Cells Industry Revenue (billion) Forecast, by Application 2020 & 2033
- Table 64: South Africa Circulating Tumor Cells Industry Volume (K Unit) Forecast, by Application 2020 & 2033
- Table 65: Rest of Middle East and Africa Circulating Tumor Cells Industry Revenue (billion) Forecast, by Application 2020 & 2033
- Table 66: Rest of Middle East and Africa Circulating Tumor Cells Industry Volume (K Unit) Forecast, by Application 2020 & 2033
- Table 67: Global Circulating Tumor Cells Industry Revenue billion Forecast, by Technology 2020 & 2033
- Table 68: Global Circulating Tumor Cells Industry Volume K Unit Forecast, by Technology 2020 & 2033
- Table 69: Global Circulating Tumor Cells Industry Revenue billion Forecast, by Application 2020 & 2033
- Table 70: Global Circulating Tumor Cells Industry Volume K Unit Forecast, by Application 2020 & 2033
- Table 71: Global Circulating Tumor Cells Industry Revenue billion Forecast, by Country 2020 & 2033
- Table 72: Global Circulating Tumor Cells Industry Volume K Unit Forecast, by Country 2020 & 2033
- Table 73: Brazil Circulating Tumor Cells Industry Revenue (billion) Forecast, by Application 2020 & 2033
- Table 74: Brazil Circulating Tumor Cells Industry Volume (K Unit) Forecast, by Application 2020 & 2033
- Table 75: Argentina Circulating Tumor Cells Industry Revenue (billion) Forecast, by Application 2020 & 2033
- Table 76: Argentina Circulating Tumor Cells Industry Volume (K Unit) Forecast, by Application 2020 & 2033
- Table 77: Rest of South America Circulating Tumor Cells Industry Revenue (billion) Forecast, by Application 2020 & 2033
- Table 78: Rest of South America Circulating Tumor Cells Industry Volume (K Unit) Forecast, by Application 2020 & 2033
Frequently Asked Questions
1. What is the projected Compound Annual Growth Rate (CAGR) of the Circulating Tumor Cells Industry?
The projected CAGR is approximately 13.92%.
2. Which companies are prominent players in the Circulating Tumor Cells Industry?
Key companies in the market include BioChain Institute Inc, Thermofisher, Precision for Medicine (Formerly ApoCell), Menarini Silicon Biosystems, Aviva Biosciences, Creatv Micro Tech Inc, Miltenyi Biotec, LungLife AI Inc, Sysmex Corporation, Qiagen NV, Advanced Cell Diagnostics Inc, Biocept Inc.
3. What are the main segments of the Circulating Tumor Cells Industry?
The market segments include Technology, Application.
4. Can you provide details about the market size?
The market size is estimated to be USD 14.04 billion as of 2022.
5. What are some drivers contributing to market growth?
Advancements in Biomedical Imaging and Bioengineering Technology; Rising Demand for Preventive Medicine and Companion Diagnostics; Increasing Prevalence of Cancer.
6. What are the notable trends driving market growth?
The Negative Enrichment Segment is Expected to Hold a Major Market Share in the Circulating Tumor Cells (CTC) Market.
7. Are there any restraints impacting market growth?
Technical Difficulties in Detection and Characterization of CTCs Associated with High Cost of Diagnosis; Lack of Awarness and Unwillingness for the Adoption of Advanced CTC Technologies.
8. Can you provide examples of recent developments in the market?
In July 2021, Datar Cancer Genetics reported the publication of a MedTech Innovation Briefing (MIB) from the United Kingdom's National Institute for Health and Care Excellence (NICE) on its CE-marked 'Trueblood-Prostate' test to be used for precision triaging of patients to avoid unnecessary invasive biopsies.
9. What pricing options are available for accessing the report?
Pricing options include single-user, multi-user, and enterprise licenses priced at USD 4750, USD 5250, and USD 8750 respectively.
10. Is the market size provided in terms of value or volume?
The market size is provided in terms of value, measured in billion and volume, measured in K Unit.
11. Are there any specific market keywords associated with the report?
Yes, the market keyword associated with the report is "Circulating Tumor Cells Industry," which aids in identifying and referencing the specific market segment covered.
12. How do I determine which pricing option suits my needs best?
The pricing options vary based on user requirements and access needs. Individual users may opt for single-user licenses, while businesses requiring broader access may choose multi-user or enterprise licenses for cost-effective access to the report.
13. Are there any additional resources or data provided in the Circulating Tumor Cells Industry report?
While the report offers comprehensive insights, it's advisable to review the specific contents or supplementary materials provided to ascertain if additional resources or data are available.
14. How can I stay updated on further developments or reports in the Circulating Tumor Cells Industry?
To stay informed about further developments, trends, and reports in the Circulating Tumor Cells Industry, consider subscribing to industry newsletters, following relevant companies and organizations, or regularly checking reputable industry news sources and publications.
Methodology
Step 1 - Identification of Relevant Samples Size from Population Database


Step 2 - Approaches for Defining Global Market Size (Value, Volume* & Price*)

Note*: In applicable scenarios
Step 3 - Data Sources
Primary Research
- Web Analytics
- Survey Reports
- Research Institute
- Latest Research Reports
- Opinion Leaders
Secondary Research
- Annual Reports
- White Paper
- Latest Press Release
- Industry Association
- Paid Database
- Investor Presentations

Step 4 - Data Triangulation
Involves using different sources of information in order to increase the validity of a study
These sources are likely to be stakeholders in a program - participants, other researchers, program staff, other community members, and so on.
Then we put all data in single framework & apply various statistical tools to find out the dynamic on the market.
During the analysis stage, feedback from the stakeholder groups would be compared to determine areas of agreement as well as areas of divergence