
Key Insights
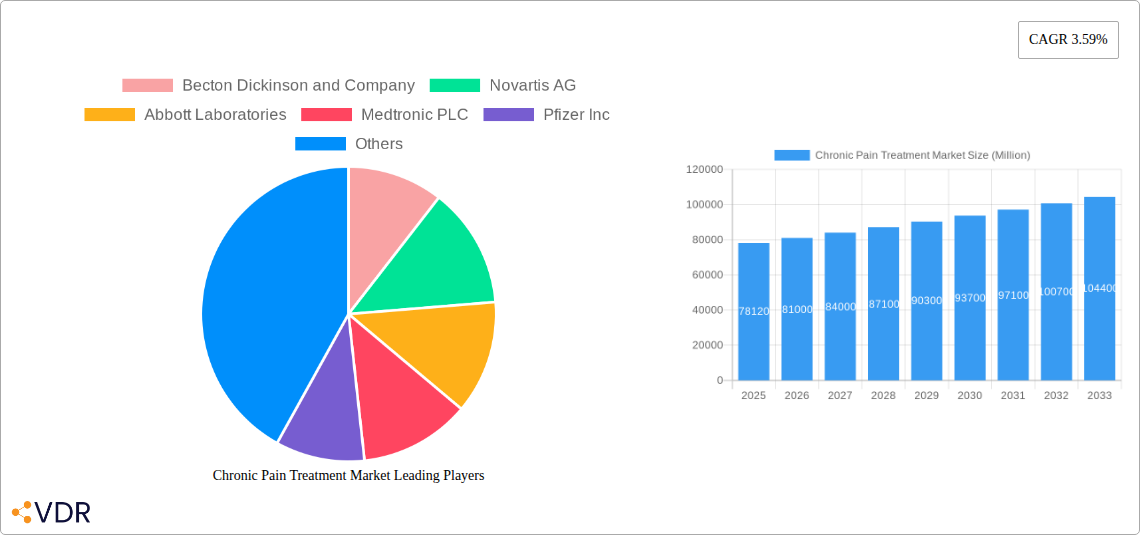
The global chronic pain treatment market, valued at $78.12 billion in 2025, is projected to experience steady growth, driven by a rising aging population, increasing prevalence of chronic conditions like arthritis, diabetes, and cancer, and growing awareness of effective pain management strategies. The market's 3.59% CAGR from 2025 to 2033 indicates a substantial expansion over the forecast period. Key drivers include technological advancements in neurostimulation devices, improved analgesic drug formulations offering better efficacy and fewer side effects, and a shift towards personalized medicine approaches for pain management. The market is segmented by drug type (Non-narcotic analgesics, including NSAIDs, anesthetics, anticonvulsants, and antidepressants; and Narcotics, although not explicitly mentioned, their presence is implied given the context), devices (neurostimulation, infusion pumps), application (neuropathic, cancer, musculoskeletal pain), and mode of pain management (drugs and devices). Growth is further fueled by increased healthcare spending and the expansion of pain clinics offering specialized treatment options. However, the market faces certain restraints such as the potential for opioid abuse and addiction, stringent regulatory approvals for new drugs and devices, and high treatment costs impacting affordability, particularly in low- and middle-income countries.
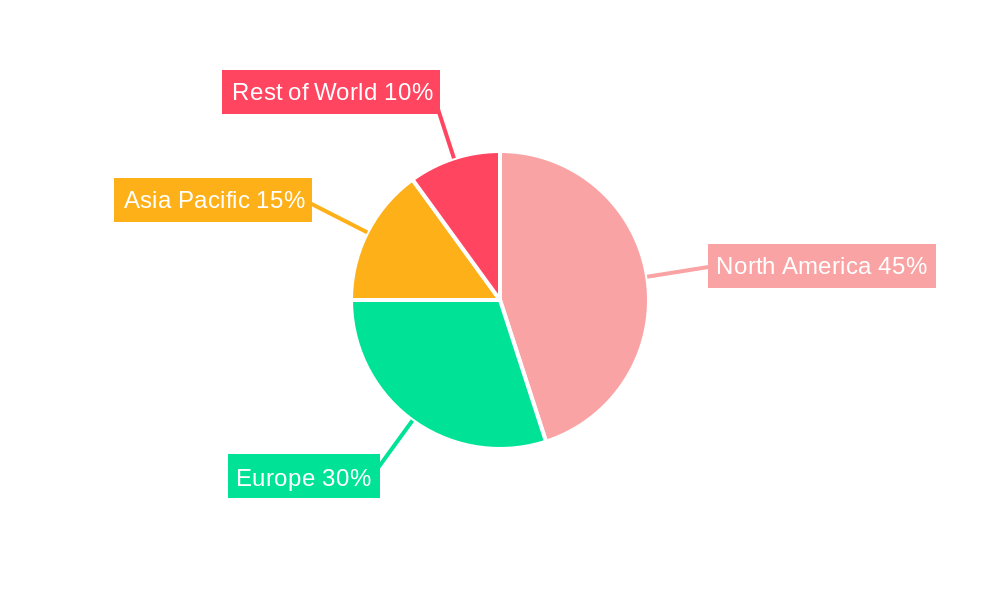
North America currently holds a significant market share, owing to advanced healthcare infrastructure and high adoption rates of new technologies. However, the Asia-Pacific region is expected to witness substantial growth due to rising healthcare expenditure, increasing awareness of chronic pain management, and a large, aging population base. Europe also presents a significant market opportunity, driven by a robust healthcare system and the presence of established pharmaceutical companies. Competitive dynamics are shaped by the presence of major players like Johnson & Johnson, Abbott Laboratories, and Medtronic, who are actively involved in research and development, focusing on innovative therapies and pain management solutions. The market will see increased competition and potentially consolidation through mergers and acquisitions as companies seek to expand their product portfolios and market reach.
Chronic Pain Treatment Market: A Comprehensive Report (2019-2033)
This in-depth report provides a comprehensive analysis of the Chronic Pain Treatment Market, encompassing market dynamics, growth trends, regional segmentation, product landscape, and key players. The study period covers 2019-2033, with 2025 as the base and estimated year. The report offers invaluable insights for industry professionals, investors, and stakeholders seeking to understand and capitalize on opportunities within this rapidly evolving market. Market values are presented in million units.
Chronic Pain Treatment Market Market Dynamics & Structure
The chronic pain treatment market is characterized by a moderately fragmented structure, with several large multinational corporations and numerous smaller specialized companies competing. Market concentration is influenced by the diverse range of therapeutic approaches, including pharmaceutical drugs and medical devices. Technological innovation is a major driver, with advancements in neurostimulation, drug delivery systems, and personalized medicine shaping market growth. Stringent regulatory frameworks governing drug approvals and medical device safety pose significant challenges, impacting market entry and product development timelines. Furthermore, the market is witnessing increased competition from alternative therapies, including complementary and integrative medicine. M&A activity is prevalent, driven by companies seeking to expand their product portfolios and market reach. Deal volumes show a significant increase in the past 5 years, reflecting growing consolidation in the sector.
- Market Concentration: Moderately fragmented.
- Technological Innovation: Significant driver, particularly in neurostimulation and drug delivery.
- Regulatory Frameworks: Stringent regulations impact market entry and timelines.
- Competitive Substitutes: Rise of alternative and complementary therapies.
- M&A Trends: Increasing consolidation with xx deals in the last 5 years, resulting in a xx% increase in market share for top 5 players.
- End-User Demographics: Aging population and rising prevalence of chronic conditions are key drivers.
- Innovation Barriers: High R&D costs, lengthy regulatory approvals, and challenges in personalized treatment.
Chronic Pain Treatment Market Growth Trends & Insights
The chronic pain treatment market is experiencing substantial growth, driven by factors such as the increasing prevalence of chronic diseases, an aging global population, and rising healthcare expenditure. The market size is estimated to reach xx million units by 2025, registering a CAGR of xx% during the forecast period (2025-2033). Adoption rates for advanced therapies, such as neurostimulation devices, are gradually increasing, although the market penetration remains relatively low. Technological disruptions are significantly influencing treatment approaches, with the focus shifting towards personalized medicine, targeted drug delivery, and non-opioid pain management strategies. Consumer behavior is changing, with increased demand for minimally invasive procedures, non-pharmacological options, and improved patient outcomes.
(Note: The text above utilizes a placeholder XXX for the source of data driving the analysis. Specific data points and references need to be added for a completed report.)

Dominant Regions, Countries, or Segments in Chronic Pain Treatment Market
North America currently holds the largest market share in the chronic pain treatment market, driven by high healthcare expenditure, increased prevalence of chronic pain conditions, and the early adoption of advanced therapies. Within this region, the United States represents the largest national market. The European market is also substantial, with significant growth potential in emerging economies within the region.
Within segments, Non-Steroidal Anti-Inflammatory Drugs (NSAIDs) currently dominate the Non-narcotic Analgesics segment due to their widespread availability and relatively low cost. However, the Neurostimulation Devices segment shows the highest growth potential driven by technological advancements and an increasing awareness of its effectiveness in treating chronic pain. Musculoskeletal pain constitutes the largest application segment, reflecting the high prevalence of conditions such as arthritis and back pain.
- Key Drivers (North America): High healthcare expenditure, prevalence of chronic pain, early adoption of advanced therapies.
- Key Drivers (Europe): Growing awareness of chronic pain, increasing healthcare investment in emerging markets.
- Segment Dominance: NSAIDs (Non-narcotic Analgesics), Neurostimulation Devices (Devices), and Musculoskeletal Pain (Application) are currently leading.
Chronic Pain Treatment Market Product Landscape
The market showcases continuous innovation in drug formulations, delivery systems, and medical devices. Recent advancements include the development of targeted drug delivery systems for improved efficacy and reduced side effects, along with next-generation neurostimulation devices that offer personalized therapy options. The unique selling propositions for many products center around minimally invasive procedures, improved patient comfort, and enhanced therapeutic outcomes. Many companies are also focusing on non-opioid analgesics to address the growing concerns over opioid addiction.
Key Drivers, Barriers & Challenges in Chronic Pain Treatment Market
Key Drivers: Increasing prevalence of chronic pain conditions, aging population, rising healthcare expenditure, technological advancements in pain management therapies, and growing demand for non-opioid analgesics.
Key Barriers & Challenges: High cost of advanced therapies, stringent regulatory hurdles for drug and device approvals, potential side effects associated with some treatments, and the risk of opioid addiction which limits the use of opioid-based pain relievers. Supply chain disruptions can also impact the availability of essential products. The complexity of chronic pain conditions and the variability in patient responses pose significant challenges in developing effective and personalized treatments. Competitive pressures from both established and emerging players also drive challenges in the market.
Emerging Opportunities in Chronic Pain Treatment Market
Emerging opportunities include personalized medicine approaches tailored to individual patient needs, innovative non-pharmacological interventions (like mindfulness and virtual reality), advancements in diagnostic imaging, the increasing adoption of telemedicine and remote monitoring for chronic pain management, and the development of more effective and safe non-opioid pain management solutions.
Growth Accelerators in the Chronic Pain Treatment Market Industry
Long-term growth will be fueled by technological breakthroughs, specifically in personalized medicine, artificial intelligence (AI)-driven diagnostics, and advanced drug delivery systems. Strategic partnerships between pharmaceutical companies and medical device manufacturers will drive the development and commercialization of innovative therapies. Expansion into untapped markets in developing countries and increased investment in R&D will also contribute significantly to market expansion.
Key Players Shaping the Chronic Pain Treatment Market Market
- Becton Dickinson and Company
- Novartis AG
- Abbott Laboratories
- Medtronic PLC
- Pfizer Inc
- Baxter International Inc (Avante Health Solutions)
- Fresenius SE & Co KGaA
- Johnson & Johnson
- Endo International PLC
- Boston Scientific Corporation
Notable Milestones in Chronic Pain Treatment Market Sector
- January 2021: Boston Scientific Corporation launched the WaveWriter Alpha SCS system.
- July 2021: Venus Remedies Limited launched a consumer healthcare division for pain management.
- September 2022: Compass Group Equity Partners partnered with Mays & Schnapp Neurospine and Pain.
- October 2022: Parker Laboratories Inc. expanded its analgesics line with new CBD creams.
In-Depth Chronic Pain Treatment Market Market Outlook
The chronic pain treatment market is poised for continued robust growth over the next decade. Technological advancements, strategic collaborations, and the growing awareness of chronic pain conditions will fuel market expansion. Companies focusing on personalized medicine, non-opioid pain management, and innovative drug delivery systems will be particularly well-positioned to capitalize on emerging opportunities. Further consolidation through mergers and acquisitions is anticipated, leading to a more concentrated market structure.
Chronic Pain Treatment Market Segmentation
-
1. BY Mode of Pain Management
-
1.1. Drugs
- 1.1.1. Opioids
-
1.1.2. Non-narcotic Analgesics
- 1.1.2.1. Non-Steroidal Anti-Inflammatory Drugs (NSAIDs)
- 1.1.2.2. Anesthetics
- 1.1.2.3. Anticonvulsants
- 1.1.2.4. Anti-depressants
- 1.1.2.5. Other Non-narcotic Analgesics
-
1.2. Devices
-
1.2.1. Neurostimulation Devices
- 1.2.1.1. Transcut
- 1.2.1.2. Brain and Spinal Cord Stimulation (SCS) Devices
-
1.2.2. Analgesic Infusion Pumps
- 1.2.2.1. Intrathecal Infusion Pumps
- 1.2.2.2. External Infusion Pumps
-
1.2.1. Neurostimulation Devices
-
1.1. Drugs
-
2. Application
- 2.1. Neuropathic Pain
- 2.2. Cancer Pain
- 2.3. Facial Pain and Migraine
- 2.4. Musculoskeletal Pain
- 2.5. Other Applications
Chronic Pain Treatment Market Segmentation By Geography
-
1. North America
- 1.1. United States
- 1.2. Canada
- 1.3. Mexico
-
2. Europe
- 2.1. Germany
- 2.2. United Kingdom
- 2.3. France
- 2.4. Italy
- 2.5. Spain
- 2.6. Rest of Europe
-
3. Asia Pacific
- 3.1. China
- 3.2. Japan
- 3.3. India
- 3.4. Australia
- 3.5. South Korea
- 3.6. Rest of Asia Pacific
-
4. Middle East and Africa
- 4.1. GCC
- 4.2. South Africa
- 4.3. Rest of Middle East and Africa
-
5. South America
- 5.1. Brazil
- 5.2. Argentina
- 5.3. Rest of South America
Chronic Pain Treatment Market REPORT HIGHLIGHTS
| Aspects | Details |
|---|---|
| Study Period | 2019-2033 |
| Base Year | 2024 |
| Estimated Year | 2025 |
| Forecast Period | 2025-2033 |
| Historical Period | 2019-2024 |
| Growth Rate | CAGR of 3.59% from 2019-2033 |
| Segmentation |
|
Table of Contents
- 1. Introduction
- 1.1. Research Scope
- 1.2. Market Segmentation
- 1.3. Research Methodology
- 1.4. Definitions and Assumptions
- 2. Executive Summary
- 2.1. Introduction
- 3. Market Dynamics
- 3.1. Introduction
- 3.2. Market Drivers
- 3.2.1. Increasing Demand for Long-term Pain Management from the Geriatric Population; Proven Efficacy of Pain Management Devices for the Treatment of Chronic Pain; Development of Novel Pain Management Devices and Techniques
- 3.3. Market Restrains
- 3.3.1. Lack of Awareness About the Availability and Use of Pain Management Devices; High Procedural and Purchase Cost of Pain Management Devices
- 3.4. Market Trends
- 3.4.1. Facial Pain and Migraine Segment is Expected to Exhibit a Significant Growth Rate During the Forecast Period
- 4. Market Factor Analysis
- 4.1. Porters Five Forces
- 4.2. Supply/Value Chain
- 4.3. PESTEL analysis
- 4.4. Market Entropy
- 4.5. Patent/Trademark Analysis
- 5. Global Chronic Pain Treatment Market Analysis, Insights and Forecast, 2019-2031
- 5.1. Market Analysis, Insights and Forecast - by BY Mode of Pain Management
- 5.1.1. Drugs
- 5.1.1.1. Opioids
- 5.1.1.2. Non-narcotic Analgesics
- 5.1.1.2.1. Non-Steroidal Anti-Inflammatory Drugs (NSAIDs)
- 5.1.1.2.2. Anesthetics
- 5.1.1.2.3. Anticonvulsants
- 5.1.1.2.4. Anti-depressants
- 5.1.1.2.5. Other Non-narcotic Analgesics
- 5.1.2. Devices
- 5.1.2.1. Neurostimulation Devices
- 5.1.2.1.1. Transcut
- 5.1.2.1.2. Brain and Spinal Cord Stimulation (SCS) Devices
- 5.1.2.2. Analgesic Infusion Pumps
- 5.1.2.2.1. Intrathecal Infusion Pumps
- 5.1.2.2.2. External Infusion Pumps
- 5.1.2.1. Neurostimulation Devices
- 5.1.1. Drugs
- 5.2. Market Analysis, Insights and Forecast - by Application
- 5.2.1. Neuropathic Pain
- 5.2.2. Cancer Pain
- 5.2.3. Facial Pain and Migraine
- 5.2.4. Musculoskeletal Pain
- 5.2.5. Other Applications
- 5.3. Market Analysis, Insights and Forecast - by Region
- 5.3.1. North America
- 5.3.2. Europe
- 5.3.3. Asia Pacific
- 5.3.4. Middle East and Africa
- 5.3.5. South America
- 5.1. Market Analysis, Insights and Forecast - by BY Mode of Pain Management
- 6. North America Chronic Pain Treatment Market Analysis, Insights and Forecast, 2019-2031
- 6.1. Market Analysis, Insights and Forecast - by BY Mode of Pain Management
- 6.1.1. Drugs
- 6.1.1.1. Opioids
- 6.1.1.2. Non-narcotic Analgesics
- 6.1.1.2.1. Non-Steroidal Anti-Inflammatory Drugs (NSAIDs)
- 6.1.1.2.2. Anesthetics
- 6.1.1.2.3. Anticonvulsants
- 6.1.1.2.4. Anti-depressants
- 6.1.1.2.5. Other Non-narcotic Analgesics
- 6.1.2. Devices
- 6.1.2.1. Neurostimulation Devices
- 6.1.2.1.1. Transcut
- 6.1.2.1.2. Brain and Spinal Cord Stimulation (SCS) Devices
- 6.1.2.2. Analgesic Infusion Pumps
- 6.1.2.2.1. Intrathecal Infusion Pumps
- 6.1.2.2.2. External Infusion Pumps
- 6.1.2.1. Neurostimulation Devices
- 6.1.1. Drugs
- 6.2. Market Analysis, Insights and Forecast - by Application
- 6.2.1. Neuropathic Pain
- 6.2.2. Cancer Pain
- 6.2.3. Facial Pain and Migraine
- 6.2.4. Musculoskeletal Pain
- 6.2.5. Other Applications
- 6.1. Market Analysis, Insights and Forecast - by BY Mode of Pain Management
- 7. Europe Chronic Pain Treatment Market Analysis, Insights and Forecast, 2019-2031
- 7.1. Market Analysis, Insights and Forecast - by BY Mode of Pain Management
- 7.1.1. Drugs
- 7.1.1.1. Opioids
- 7.1.1.2. Non-narcotic Analgesics
- 7.1.1.2.1. Non-Steroidal Anti-Inflammatory Drugs (NSAIDs)
- 7.1.1.2.2. Anesthetics
- 7.1.1.2.3. Anticonvulsants
- 7.1.1.2.4. Anti-depressants
- 7.1.1.2.5. Other Non-narcotic Analgesics
- 7.1.2. Devices
- 7.1.2.1. Neurostimulation Devices
- 7.1.2.1.1. Transcut
- 7.1.2.1.2. Brain and Spinal Cord Stimulation (SCS) Devices
- 7.1.2.2. Analgesic Infusion Pumps
- 7.1.2.2.1. Intrathecal Infusion Pumps
- 7.1.2.2.2. External Infusion Pumps
- 7.1.2.1. Neurostimulation Devices
- 7.1.1. Drugs
- 7.2. Market Analysis, Insights and Forecast - by Application
- 7.2.1. Neuropathic Pain
- 7.2.2. Cancer Pain
- 7.2.3. Facial Pain and Migraine
- 7.2.4. Musculoskeletal Pain
- 7.2.5. Other Applications
- 7.1. Market Analysis, Insights and Forecast - by BY Mode of Pain Management
- 8. Asia Pacific Chronic Pain Treatment Market Analysis, Insights and Forecast, 2019-2031
- 8.1. Market Analysis, Insights and Forecast - by BY Mode of Pain Management
- 8.1.1. Drugs
- 8.1.1.1. Opioids
- 8.1.1.2. Non-narcotic Analgesics
- 8.1.1.2.1. Non-Steroidal Anti-Inflammatory Drugs (NSAIDs)
- 8.1.1.2.2. Anesthetics
- 8.1.1.2.3. Anticonvulsants
- 8.1.1.2.4. Anti-depressants
- 8.1.1.2.5. Other Non-narcotic Analgesics
- 8.1.2. Devices
- 8.1.2.1. Neurostimulation Devices
- 8.1.2.1.1. Transcut
- 8.1.2.1.2. Brain and Spinal Cord Stimulation (SCS) Devices
- 8.1.2.2. Analgesic Infusion Pumps
- 8.1.2.2.1. Intrathecal Infusion Pumps
- 8.1.2.2.2. External Infusion Pumps
- 8.1.2.1. Neurostimulation Devices
- 8.1.1. Drugs
- 8.2. Market Analysis, Insights and Forecast - by Application
- 8.2.1. Neuropathic Pain
- 8.2.2. Cancer Pain
- 8.2.3. Facial Pain and Migraine
- 8.2.4. Musculoskeletal Pain
- 8.2.5. Other Applications
- 8.1. Market Analysis, Insights and Forecast - by BY Mode of Pain Management
- 9. Middle East and Africa Chronic Pain Treatment Market Analysis, Insights and Forecast, 2019-2031
- 9.1. Market Analysis, Insights and Forecast - by BY Mode of Pain Management
- 9.1.1. Drugs
- 9.1.1.1. Opioids
- 9.1.1.2. Non-narcotic Analgesics
- 9.1.1.2.1. Non-Steroidal Anti-Inflammatory Drugs (NSAIDs)
- 9.1.1.2.2. Anesthetics
- 9.1.1.2.3. Anticonvulsants
- 9.1.1.2.4. Anti-depressants
- 9.1.1.2.5. Other Non-narcotic Analgesics
- 9.1.2. Devices
- 9.1.2.1. Neurostimulation Devices
- 9.1.2.1.1. Transcut
- 9.1.2.1.2. Brain and Spinal Cord Stimulation (SCS) Devices
- 9.1.2.2. Analgesic Infusion Pumps
- 9.1.2.2.1. Intrathecal Infusion Pumps
- 9.1.2.2.2. External Infusion Pumps
- 9.1.2.1. Neurostimulation Devices
- 9.1.1. Drugs
- 9.2. Market Analysis, Insights and Forecast - by Application
- 9.2.1. Neuropathic Pain
- 9.2.2. Cancer Pain
- 9.2.3. Facial Pain and Migraine
- 9.2.4. Musculoskeletal Pain
- 9.2.5. Other Applications
- 9.1. Market Analysis, Insights and Forecast - by BY Mode of Pain Management
- 10. South America Chronic Pain Treatment Market Analysis, Insights and Forecast, 2019-2031
- 10.1. Market Analysis, Insights and Forecast - by BY Mode of Pain Management
- 10.1.1. Drugs
- 10.1.1.1. Opioids
- 10.1.1.2. Non-narcotic Analgesics
- 10.1.1.2.1. Non-Steroidal Anti-Inflammatory Drugs (NSAIDs)
- 10.1.1.2.2. Anesthetics
- 10.1.1.2.3. Anticonvulsants
- 10.1.1.2.4. Anti-depressants
- 10.1.1.2.5. Other Non-narcotic Analgesics
- 10.1.2. Devices
- 10.1.2.1. Neurostimulation Devices
- 10.1.2.1.1. Transcut
- 10.1.2.1.2. Brain and Spinal Cord Stimulation (SCS) Devices
- 10.1.2.2. Analgesic Infusion Pumps
- 10.1.2.2.1. Intrathecal Infusion Pumps
- 10.1.2.2.2. External Infusion Pumps
- 10.1.2.1. Neurostimulation Devices
- 10.1.1. Drugs
- 10.2. Market Analysis, Insights and Forecast - by Application
- 10.2.1. Neuropathic Pain
- 10.2.2. Cancer Pain
- 10.2.3. Facial Pain and Migraine
- 10.2.4. Musculoskeletal Pain
- 10.2.5. Other Applications
- 10.1. Market Analysis, Insights and Forecast - by BY Mode of Pain Management
- 11. North Americ Chronic Pain Treatment Market Analysis, Insights and Forecast, 2019-2031
- 11.1. Market Analysis, Insights and Forecast - By Country/Sub-region
- 11.1.1 United States
- 11.1.2 Canada
- 11.1.3 Mexico
- 12. South America Chronic Pain Treatment Market Analysis, Insights and Forecast, 2019-2031
- 12.1. Market Analysis, Insights and Forecast - By Country/Sub-region
- 12.1.1 Brazil
- 12.1.2 Mexico
- 12.1.3 Rest of South America
- 13. Europe Chronic Pain Treatment Market Analysis, Insights and Forecast, 2019-2031
- 13.1. Market Analysis, Insights and Forecast - By Country/Sub-region
- 13.1.1 Germany
- 13.1.2 United Kingdom
- 13.1.3 France
- 13.1.4 Italy
- 13.1.5 Spain
- 13.1.6 Rest of Europe
- 14. Asia Pacific Chronic Pain Treatment Market Analysis, Insights and Forecast, 2019-2031
- 14.1. Market Analysis, Insights and Forecast - By Country/Sub-region
- 14.1.1 China
- 14.1.2 Japan
- 14.1.3 India
- 14.1.4 South Korea
- 14.1.5 Taiwan
- 14.1.6 Australia
- 14.1.7 Rest of Asia-Pacific
- 15. MEA Chronic Pain Treatment Market Analysis, Insights and Forecast, 2019-2031
- 15.1. Market Analysis, Insights and Forecast - By Country/Sub-region
- 15.1.1 Middle East
- 15.1.2 Africa
- 16. Competitive Analysis
- 16.1. Global Market Share Analysis 2024
- 16.2. Company Profiles
- 16.2.1 Becton Dickinson and Company
- 16.2.1.1. Overview
- 16.2.1.2. Products
- 16.2.1.3. SWOT Analysis
- 16.2.1.4. Recent Developments
- 16.2.1.5. Financials (Based on Availability)
- 16.2.2 Novartis AG
- 16.2.2.1. Overview
- 16.2.2.2. Products
- 16.2.2.3. SWOT Analysis
- 16.2.2.4. Recent Developments
- 16.2.2.5. Financials (Based on Availability)
- 16.2.3 Abbott Laboratories
- 16.2.3.1. Overview
- 16.2.3.2. Products
- 16.2.3.3. SWOT Analysis
- 16.2.3.4. Recent Developments
- 16.2.3.5. Financials (Based on Availability)
- 16.2.4 Medtronic PLC
- 16.2.4.1. Overview
- 16.2.4.2. Products
- 16.2.4.3. SWOT Analysis
- 16.2.4.4. Recent Developments
- 16.2.4.5. Financials (Based on Availability)
- 16.2.5 Pfizer Inc
- 16.2.5.1. Overview
- 16.2.5.2. Products
- 16.2.5.3. SWOT Analysis
- 16.2.5.4. Recent Developments
- 16.2.5.5. Financials (Based on Availability)
- 16.2.6 Baxter International Inc (Avante Health Solutions)
- 16.2.6.1. Overview
- 16.2.6.2. Products
- 16.2.6.3. SWOT Analysis
- 16.2.6.4. Recent Developments
- 16.2.6.5. Financials (Based on Availability)
- 16.2.7 Fresenius SE & Co KGaA
- 16.2.7.1. Overview
- 16.2.7.2. Products
- 16.2.7.3. SWOT Analysis
- 16.2.7.4. Recent Developments
- 16.2.7.5. Financials (Based on Availability)
- 16.2.8 Johnson & Johnson
- 16.2.8.1. Overview
- 16.2.8.2. Products
- 16.2.8.3. SWOT Analysis
- 16.2.8.4. Recent Developments
- 16.2.8.5. Financials (Based on Availability)
- 16.2.9 Endo International PLC
- 16.2.9.1. Overview
- 16.2.9.2. Products
- 16.2.9.3. SWOT Analysis
- 16.2.9.4. Recent Developments
- 16.2.9.5. Financials (Based on Availability)
- 16.2.10 Boston Scientific Corporation
- 16.2.10.1. Overview
- 16.2.10.2. Products
- 16.2.10.3. SWOT Analysis
- 16.2.10.4. Recent Developments
- 16.2.10.5. Financials (Based on Availability)
- 16.2.1 Becton Dickinson and Company
List of Figures
- Figure 1: Global Chronic Pain Treatment Market Revenue Breakdown (Million, %) by Region 2024 & 2032
- Figure 2: Global Chronic Pain Treatment Market Volume Breakdown (K Unit, %) by Region 2024 & 2032
- Figure 3: North Americ Chronic Pain Treatment Market Revenue (Million), by Country 2024 & 2032
- Figure 4: North Americ Chronic Pain Treatment Market Volume (K Unit), by Country 2024 & 2032
- Figure 5: North Americ Chronic Pain Treatment Market Revenue Share (%), by Country 2024 & 2032
- Figure 6: North Americ Chronic Pain Treatment Market Volume Share (%), by Country 2024 & 2032
- Figure 7: South America Chronic Pain Treatment Market Revenue (Million), by Country 2024 & 2032
- Figure 8: South America Chronic Pain Treatment Market Volume (K Unit), by Country 2024 & 2032
- Figure 9: South America Chronic Pain Treatment Market Revenue Share (%), by Country 2024 & 2032
- Figure 10: South America Chronic Pain Treatment Market Volume Share (%), by Country 2024 & 2032
- Figure 11: Europe Chronic Pain Treatment Market Revenue (Million), by Country 2024 & 2032
- Figure 12: Europe Chronic Pain Treatment Market Volume (K Unit), by Country 2024 & 2032
- Figure 13: Europe Chronic Pain Treatment Market Revenue Share (%), by Country 2024 & 2032
- Figure 14: Europe Chronic Pain Treatment Market Volume Share (%), by Country 2024 & 2032
- Figure 15: Asia Pacific Chronic Pain Treatment Market Revenue (Million), by Country 2024 & 2032
- Figure 16: Asia Pacific Chronic Pain Treatment Market Volume (K Unit), by Country 2024 & 2032
- Figure 17: Asia Pacific Chronic Pain Treatment Market Revenue Share (%), by Country 2024 & 2032
- Figure 18: Asia Pacific Chronic Pain Treatment Market Volume Share (%), by Country 2024 & 2032
- Figure 19: MEA Chronic Pain Treatment Market Revenue (Million), by Country 2024 & 2032
- Figure 20: MEA Chronic Pain Treatment Market Volume (K Unit), by Country 2024 & 2032
- Figure 21: MEA Chronic Pain Treatment Market Revenue Share (%), by Country 2024 & 2032
- Figure 22: MEA Chronic Pain Treatment Market Volume Share (%), by Country 2024 & 2032
- Figure 23: North America Chronic Pain Treatment Market Revenue (Million), by BY Mode of Pain Management 2024 & 2032
- Figure 24: North America Chronic Pain Treatment Market Volume (K Unit), by BY Mode of Pain Management 2024 & 2032
- Figure 25: North America Chronic Pain Treatment Market Revenue Share (%), by BY Mode of Pain Management 2024 & 2032
- Figure 26: North America Chronic Pain Treatment Market Volume Share (%), by BY Mode of Pain Management 2024 & 2032
- Figure 27: North America Chronic Pain Treatment Market Revenue (Million), by Application 2024 & 2032
- Figure 28: North America Chronic Pain Treatment Market Volume (K Unit), by Application 2024 & 2032
- Figure 29: North America Chronic Pain Treatment Market Revenue Share (%), by Application 2024 & 2032
- Figure 30: North America Chronic Pain Treatment Market Volume Share (%), by Application 2024 & 2032
- Figure 31: North America Chronic Pain Treatment Market Revenue (Million), by Country 2024 & 2032
- Figure 32: North America Chronic Pain Treatment Market Volume (K Unit), by Country 2024 & 2032
- Figure 33: North America Chronic Pain Treatment Market Revenue Share (%), by Country 2024 & 2032
- Figure 34: North America Chronic Pain Treatment Market Volume Share (%), by Country 2024 & 2032
- Figure 35: Europe Chronic Pain Treatment Market Revenue (Million), by BY Mode of Pain Management 2024 & 2032
- Figure 36: Europe Chronic Pain Treatment Market Volume (K Unit), by BY Mode of Pain Management 2024 & 2032
- Figure 37: Europe Chronic Pain Treatment Market Revenue Share (%), by BY Mode of Pain Management 2024 & 2032
- Figure 38: Europe Chronic Pain Treatment Market Volume Share (%), by BY Mode of Pain Management 2024 & 2032
- Figure 39: Europe Chronic Pain Treatment Market Revenue (Million), by Application 2024 & 2032
- Figure 40: Europe Chronic Pain Treatment Market Volume (K Unit), by Application 2024 & 2032
- Figure 41: Europe Chronic Pain Treatment Market Revenue Share (%), by Application 2024 & 2032
- Figure 42: Europe Chronic Pain Treatment Market Volume Share (%), by Application 2024 & 2032
- Figure 43: Europe Chronic Pain Treatment Market Revenue (Million), by Country 2024 & 2032
- Figure 44: Europe Chronic Pain Treatment Market Volume (K Unit), by Country 2024 & 2032
- Figure 45: Europe Chronic Pain Treatment Market Revenue Share (%), by Country 2024 & 2032
- Figure 46: Europe Chronic Pain Treatment Market Volume Share (%), by Country 2024 & 2032
- Figure 47: Asia Pacific Chronic Pain Treatment Market Revenue (Million), by BY Mode of Pain Management 2024 & 2032
- Figure 48: Asia Pacific Chronic Pain Treatment Market Volume (K Unit), by BY Mode of Pain Management 2024 & 2032
- Figure 49: Asia Pacific Chronic Pain Treatment Market Revenue Share (%), by BY Mode of Pain Management 2024 & 2032
- Figure 50: Asia Pacific Chronic Pain Treatment Market Volume Share (%), by BY Mode of Pain Management 2024 & 2032
- Figure 51: Asia Pacific Chronic Pain Treatment Market Revenue (Million), by Application 2024 & 2032
- Figure 52: Asia Pacific Chronic Pain Treatment Market Volume (K Unit), by Application 2024 & 2032
- Figure 53: Asia Pacific Chronic Pain Treatment Market Revenue Share (%), by Application 2024 & 2032
- Figure 54: Asia Pacific Chronic Pain Treatment Market Volume Share (%), by Application 2024 & 2032
- Figure 55: Asia Pacific Chronic Pain Treatment Market Revenue (Million), by Country 2024 & 2032
- Figure 56: Asia Pacific Chronic Pain Treatment Market Volume (K Unit), by Country 2024 & 2032
- Figure 57: Asia Pacific Chronic Pain Treatment Market Revenue Share (%), by Country 2024 & 2032
- Figure 58: Asia Pacific Chronic Pain Treatment Market Volume Share (%), by Country 2024 & 2032
- Figure 59: Middle East and Africa Chronic Pain Treatment Market Revenue (Million), by BY Mode of Pain Management 2024 & 2032
- Figure 60: Middle East and Africa Chronic Pain Treatment Market Volume (K Unit), by BY Mode of Pain Management 2024 & 2032
- Figure 61: Middle East and Africa Chronic Pain Treatment Market Revenue Share (%), by BY Mode of Pain Management 2024 & 2032
- Figure 62: Middle East and Africa Chronic Pain Treatment Market Volume Share (%), by BY Mode of Pain Management 2024 & 2032
- Figure 63: Middle East and Africa Chronic Pain Treatment Market Revenue (Million), by Application 2024 & 2032
- Figure 64: Middle East and Africa Chronic Pain Treatment Market Volume (K Unit), by Application 2024 & 2032
- Figure 65: Middle East and Africa Chronic Pain Treatment Market Revenue Share (%), by Application 2024 & 2032
- Figure 66: Middle East and Africa Chronic Pain Treatment Market Volume Share (%), by Application 2024 & 2032
- Figure 67: Middle East and Africa Chronic Pain Treatment Market Revenue (Million), by Country 2024 & 2032
- Figure 68: Middle East and Africa Chronic Pain Treatment Market Volume (K Unit), by Country 2024 & 2032
- Figure 69: Middle East and Africa Chronic Pain Treatment Market Revenue Share (%), by Country 2024 & 2032
- Figure 70: Middle East and Africa Chronic Pain Treatment Market Volume Share (%), by Country 2024 & 2032
- Figure 71: South America Chronic Pain Treatment Market Revenue (Million), by BY Mode of Pain Management 2024 & 2032
- Figure 72: South America Chronic Pain Treatment Market Volume (K Unit), by BY Mode of Pain Management 2024 & 2032
- Figure 73: South America Chronic Pain Treatment Market Revenue Share (%), by BY Mode of Pain Management 2024 & 2032
- Figure 74: South America Chronic Pain Treatment Market Volume Share (%), by BY Mode of Pain Management 2024 & 2032
- Figure 75: South America Chronic Pain Treatment Market Revenue (Million), by Application 2024 & 2032
- Figure 76: South America Chronic Pain Treatment Market Volume (K Unit), by Application 2024 & 2032
- Figure 77: South America Chronic Pain Treatment Market Revenue Share (%), by Application 2024 & 2032
- Figure 78: South America Chronic Pain Treatment Market Volume Share (%), by Application 2024 & 2032
- Figure 79: South America Chronic Pain Treatment Market Revenue (Million), by Country 2024 & 2032
- Figure 80: South America Chronic Pain Treatment Market Volume (K Unit), by Country 2024 & 2032
- Figure 81: South America Chronic Pain Treatment Market Revenue Share (%), by Country 2024 & 2032
- Figure 82: South America Chronic Pain Treatment Market Volume Share (%), by Country 2024 & 2032
List of Tables
- Table 1: Global Chronic Pain Treatment Market Revenue Million Forecast, by Region 2019 & 2032
- Table 2: Global Chronic Pain Treatment Market Volume K Unit Forecast, by Region 2019 & 2032
- Table 3: Global Chronic Pain Treatment Market Revenue Million Forecast, by BY Mode of Pain Management 2019 & 2032
- Table 4: Global Chronic Pain Treatment Market Volume K Unit Forecast, by BY Mode of Pain Management 2019 & 2032
- Table 5: Global Chronic Pain Treatment Market Revenue Million Forecast, by Application 2019 & 2032
- Table 6: Global Chronic Pain Treatment Market Volume K Unit Forecast, by Application 2019 & 2032
- Table 7: Global Chronic Pain Treatment Market Revenue Million Forecast, by Region 2019 & 2032
- Table 8: Global Chronic Pain Treatment Market Volume K Unit Forecast, by Region 2019 & 2032
- Table 9: Global Chronic Pain Treatment Market Revenue Million Forecast, by Country 2019 & 2032
- Table 10: Global Chronic Pain Treatment Market Volume K Unit Forecast, by Country 2019 & 2032
- Table 11: United States Chronic Pain Treatment Market Revenue (Million) Forecast, by Application 2019 & 2032
- Table 12: United States Chronic Pain Treatment Market Volume (K Unit) Forecast, by Application 2019 & 2032
- Table 13: Canada Chronic Pain Treatment Market Revenue (Million) Forecast, by Application 2019 & 2032
- Table 14: Canada Chronic Pain Treatment Market Volume (K Unit) Forecast, by Application 2019 & 2032
- Table 15: Mexico Chronic Pain Treatment Market Revenue (Million) Forecast, by Application 2019 & 2032
- Table 16: Mexico Chronic Pain Treatment Market Volume (K Unit) Forecast, by Application 2019 & 2032
- Table 17: Global Chronic Pain Treatment Market Revenue Million Forecast, by Country 2019 & 2032
- Table 18: Global Chronic Pain Treatment Market Volume K Unit Forecast, by Country 2019 & 2032
- Table 19: Brazil Chronic Pain Treatment Market Revenue (Million) Forecast, by Application 2019 & 2032
- Table 20: Brazil Chronic Pain Treatment Market Volume (K Unit) Forecast, by Application 2019 & 2032
- Table 21: Mexico Chronic Pain Treatment Market Revenue (Million) Forecast, by Application 2019 & 2032
- Table 22: Mexico Chronic Pain Treatment Market Volume (K Unit) Forecast, by Application 2019 & 2032
- Table 23: Rest of South America Chronic Pain Treatment Market Revenue (Million) Forecast, by Application 2019 & 2032
- Table 24: Rest of South America Chronic Pain Treatment Market Volume (K Unit) Forecast, by Application 2019 & 2032
- Table 25: Global Chronic Pain Treatment Market Revenue Million Forecast, by Country 2019 & 2032
- Table 26: Global Chronic Pain Treatment Market Volume K Unit Forecast, by Country 2019 & 2032
- Table 27: Germany Chronic Pain Treatment Market Revenue (Million) Forecast, by Application 2019 & 2032
- Table 28: Germany Chronic Pain Treatment Market Volume (K Unit) Forecast, by Application 2019 & 2032
- Table 29: United Kingdom Chronic Pain Treatment Market Revenue (Million) Forecast, by Application 2019 & 2032
- Table 30: United Kingdom Chronic Pain Treatment Market Volume (K Unit) Forecast, by Application 2019 & 2032
- Table 31: France Chronic Pain Treatment Market Revenue (Million) Forecast, by Application 2019 & 2032
- Table 32: France Chronic Pain Treatment Market Volume (K Unit) Forecast, by Application 2019 & 2032
- Table 33: Italy Chronic Pain Treatment Market Revenue (Million) Forecast, by Application 2019 & 2032
- Table 34: Italy Chronic Pain Treatment Market Volume (K Unit) Forecast, by Application 2019 & 2032
- Table 35: Spain Chronic Pain Treatment Market Revenue (Million) Forecast, by Application 2019 & 2032
- Table 36: Spain Chronic Pain Treatment Market Volume (K Unit) Forecast, by Application 2019 & 2032
- Table 37: Rest of Europe Chronic Pain Treatment Market Revenue (Million) Forecast, by Application 2019 & 2032
- Table 38: Rest of Europe Chronic Pain Treatment Market Volume (K Unit) Forecast, by Application 2019 & 2032
- Table 39: Global Chronic Pain Treatment Market Revenue Million Forecast, by Country 2019 & 2032
- Table 40: Global Chronic Pain Treatment Market Volume K Unit Forecast, by Country 2019 & 2032
- Table 41: China Chronic Pain Treatment Market Revenue (Million) Forecast, by Application 2019 & 2032
- Table 42: China Chronic Pain Treatment Market Volume (K Unit) Forecast, by Application 2019 & 2032
- Table 43: Japan Chronic Pain Treatment Market Revenue (Million) Forecast, by Application 2019 & 2032
- Table 44: Japan Chronic Pain Treatment Market Volume (K Unit) Forecast, by Application 2019 & 2032
- Table 45: India Chronic Pain Treatment Market Revenue (Million) Forecast, by Application 2019 & 2032
- Table 46: India Chronic Pain Treatment Market Volume (K Unit) Forecast, by Application 2019 & 2032
- Table 47: South Korea Chronic Pain Treatment Market Revenue (Million) Forecast, by Application 2019 & 2032
- Table 48: South Korea Chronic Pain Treatment Market Volume (K Unit) Forecast, by Application 2019 & 2032
- Table 49: Taiwan Chronic Pain Treatment Market Revenue (Million) Forecast, by Application 2019 & 2032
- Table 50: Taiwan Chronic Pain Treatment Market Volume (K Unit) Forecast, by Application 2019 & 2032
- Table 51: Australia Chronic Pain Treatment Market Revenue (Million) Forecast, by Application 2019 & 2032
- Table 52: Australia Chronic Pain Treatment Market Volume (K Unit) Forecast, by Application 2019 & 2032
- Table 53: Rest of Asia-Pacific Chronic Pain Treatment Market Revenue (Million) Forecast, by Application 2019 & 2032
- Table 54: Rest of Asia-Pacific Chronic Pain Treatment Market Volume (K Unit) Forecast, by Application 2019 & 2032
- Table 55: Global Chronic Pain Treatment Market Revenue Million Forecast, by Country 2019 & 2032
- Table 56: Global Chronic Pain Treatment Market Volume K Unit Forecast, by Country 2019 & 2032
- Table 57: Middle East Chronic Pain Treatment Market Revenue (Million) Forecast, by Application 2019 & 2032
- Table 58: Middle East Chronic Pain Treatment Market Volume (K Unit) Forecast, by Application 2019 & 2032
- Table 59: Africa Chronic Pain Treatment Market Revenue (Million) Forecast, by Application 2019 & 2032
- Table 60: Africa Chronic Pain Treatment Market Volume (K Unit) Forecast, by Application 2019 & 2032
- Table 61: Global Chronic Pain Treatment Market Revenue Million Forecast, by BY Mode of Pain Management 2019 & 2032
- Table 62: Global Chronic Pain Treatment Market Volume K Unit Forecast, by BY Mode of Pain Management 2019 & 2032
- Table 63: Global Chronic Pain Treatment Market Revenue Million Forecast, by Application 2019 & 2032
- Table 64: Global Chronic Pain Treatment Market Volume K Unit Forecast, by Application 2019 & 2032
- Table 65: Global Chronic Pain Treatment Market Revenue Million Forecast, by Country 2019 & 2032
- Table 66: Global Chronic Pain Treatment Market Volume K Unit Forecast, by Country 2019 & 2032
- Table 67: United States Chronic Pain Treatment Market Revenue (Million) Forecast, by Application 2019 & 2032
- Table 68: United States Chronic Pain Treatment Market Volume (K Unit) Forecast, by Application 2019 & 2032
- Table 69: Canada Chronic Pain Treatment Market Revenue (Million) Forecast, by Application 2019 & 2032
- Table 70: Canada Chronic Pain Treatment Market Volume (K Unit) Forecast, by Application 2019 & 2032
- Table 71: Mexico Chronic Pain Treatment Market Revenue (Million) Forecast, by Application 2019 & 2032
- Table 72: Mexico Chronic Pain Treatment Market Volume (K Unit) Forecast, by Application 2019 & 2032
- Table 73: Global Chronic Pain Treatment Market Revenue Million Forecast, by BY Mode of Pain Management 2019 & 2032
- Table 74: Global Chronic Pain Treatment Market Volume K Unit Forecast, by BY Mode of Pain Management 2019 & 2032
- Table 75: Global Chronic Pain Treatment Market Revenue Million Forecast, by Application 2019 & 2032
- Table 76: Global Chronic Pain Treatment Market Volume K Unit Forecast, by Application 2019 & 2032
- Table 77: Global Chronic Pain Treatment Market Revenue Million Forecast, by Country 2019 & 2032
- Table 78: Global Chronic Pain Treatment Market Volume K Unit Forecast, by Country 2019 & 2032
- Table 79: Germany Chronic Pain Treatment Market Revenue (Million) Forecast, by Application 2019 & 2032
- Table 80: Germany Chronic Pain Treatment Market Volume (K Unit) Forecast, by Application 2019 & 2032
- Table 81: United Kingdom Chronic Pain Treatment Market Revenue (Million) Forecast, by Application 2019 & 2032
- Table 82: United Kingdom Chronic Pain Treatment Market Volume (K Unit) Forecast, by Application 2019 & 2032
- Table 83: France Chronic Pain Treatment Market Revenue (Million) Forecast, by Application 2019 & 2032
- Table 84: France Chronic Pain Treatment Market Volume (K Unit) Forecast, by Application 2019 & 2032
- Table 85: Italy Chronic Pain Treatment Market Revenue (Million) Forecast, by Application 2019 & 2032
- Table 86: Italy Chronic Pain Treatment Market Volume (K Unit) Forecast, by Application 2019 & 2032
- Table 87: Spain Chronic Pain Treatment Market Revenue (Million) Forecast, by Application 2019 & 2032
- Table 88: Spain Chronic Pain Treatment Market Volume (K Unit) Forecast, by Application 2019 & 2032
- Table 89: Rest of Europe Chronic Pain Treatment Market Revenue (Million) Forecast, by Application 2019 & 2032
- Table 90: Rest of Europe Chronic Pain Treatment Market Volume (K Unit) Forecast, by Application 2019 & 2032
- Table 91: Global Chronic Pain Treatment Market Revenue Million Forecast, by BY Mode of Pain Management 2019 & 2032
- Table 92: Global Chronic Pain Treatment Market Volume K Unit Forecast, by BY Mode of Pain Management 2019 & 2032
- Table 93: Global Chronic Pain Treatment Market Revenue Million Forecast, by Application 2019 & 2032
- Table 94: Global Chronic Pain Treatment Market Volume K Unit Forecast, by Application 2019 & 2032
- Table 95: Global Chronic Pain Treatment Market Revenue Million Forecast, by Country 2019 & 2032
- Table 96: Global Chronic Pain Treatment Market Volume K Unit Forecast, by Country 2019 & 2032
- Table 97: China Chronic Pain Treatment Market Revenue (Million) Forecast, by Application 2019 & 2032
- Table 98: China Chronic Pain Treatment Market Volume (K Unit) Forecast, by Application 2019 & 2032
- Table 99: Japan Chronic Pain Treatment Market Revenue (Million) Forecast, by Application 2019 & 2032
- Table 100: Japan Chronic Pain Treatment Market Volume (K Unit) Forecast, by Application 2019 & 2032
- Table 101: India Chronic Pain Treatment Market Revenue (Million) Forecast, by Application 2019 & 2032
- Table 102: India Chronic Pain Treatment Market Volume (K Unit) Forecast, by Application 2019 & 2032
- Table 103: Australia Chronic Pain Treatment Market Revenue (Million) Forecast, by Application 2019 & 2032
- Table 104: Australia Chronic Pain Treatment Market Volume (K Unit) Forecast, by Application 2019 & 2032
- Table 105: South Korea Chronic Pain Treatment Market Revenue (Million) Forecast, by Application 2019 & 2032
- Table 106: South Korea Chronic Pain Treatment Market Volume (K Unit) Forecast, by Application 2019 & 2032
- Table 107: Rest of Asia Pacific Chronic Pain Treatment Market Revenue (Million) Forecast, by Application 2019 & 2032
- Table 108: Rest of Asia Pacific Chronic Pain Treatment Market Volume (K Unit) Forecast, by Application 2019 & 2032
- Table 109: Global Chronic Pain Treatment Market Revenue Million Forecast, by BY Mode of Pain Management 2019 & 2032
- Table 110: Global Chronic Pain Treatment Market Volume K Unit Forecast, by BY Mode of Pain Management 2019 & 2032
- Table 111: Global Chronic Pain Treatment Market Revenue Million Forecast, by Application 2019 & 2032
- Table 112: Global Chronic Pain Treatment Market Volume K Unit Forecast, by Application 2019 & 2032
- Table 113: Global Chronic Pain Treatment Market Revenue Million Forecast, by Country 2019 & 2032
- Table 114: Global Chronic Pain Treatment Market Volume K Unit Forecast, by Country 2019 & 2032
- Table 115: GCC Chronic Pain Treatment Market Revenue (Million) Forecast, by Application 2019 & 2032
- Table 116: GCC Chronic Pain Treatment Market Volume (K Unit) Forecast, by Application 2019 & 2032
- Table 117: South Africa Chronic Pain Treatment Market Revenue (Million) Forecast, by Application 2019 & 2032
- Table 118: South Africa Chronic Pain Treatment Market Volume (K Unit) Forecast, by Application 2019 & 2032
- Table 119: Rest of Middle East and Africa Chronic Pain Treatment Market Revenue (Million) Forecast, by Application 2019 & 2032
- Table 120: Rest of Middle East and Africa Chronic Pain Treatment Market Volume (K Unit) Forecast, by Application 2019 & 2032
- Table 121: Global Chronic Pain Treatment Market Revenue Million Forecast, by BY Mode of Pain Management 2019 & 2032
- Table 122: Global Chronic Pain Treatment Market Volume K Unit Forecast, by BY Mode of Pain Management 2019 & 2032
- Table 123: Global Chronic Pain Treatment Market Revenue Million Forecast, by Application 2019 & 2032
- Table 124: Global Chronic Pain Treatment Market Volume K Unit Forecast, by Application 2019 & 2032
- Table 125: Global Chronic Pain Treatment Market Revenue Million Forecast, by Country 2019 & 2032
- Table 126: Global Chronic Pain Treatment Market Volume K Unit Forecast, by Country 2019 & 2032
- Table 127: Brazil Chronic Pain Treatment Market Revenue (Million) Forecast, by Application 2019 & 2032
- Table 128: Brazil Chronic Pain Treatment Market Volume (K Unit) Forecast, by Application 2019 & 2032
- Table 129: Argentina Chronic Pain Treatment Market Revenue (Million) Forecast, by Application 2019 & 2032
- Table 130: Argentina Chronic Pain Treatment Market Volume (K Unit) Forecast, by Application 2019 & 2032
- Table 131: Rest of South America Chronic Pain Treatment Market Revenue (Million) Forecast, by Application 2019 & 2032
- Table 132: Rest of South America Chronic Pain Treatment Market Volume (K Unit) Forecast, by Application 2019 & 2032
Frequently Asked Questions
1. What is the projected Compound Annual Growth Rate (CAGR) of the Chronic Pain Treatment Market?
The projected CAGR is approximately 3.59%.
2. Which companies are prominent players in the Chronic Pain Treatment Market?
Key companies in the market include Becton Dickinson and Company, Novartis AG, Abbott Laboratories, Medtronic PLC, Pfizer Inc , Baxter International Inc (Avante Health Solutions), Fresenius SE & Co KGaA, Johnson & Johnson, Endo International PLC, Boston Scientific Corporation.
3. What are the main segments of the Chronic Pain Treatment Market?
The market segments include BY Mode of Pain Management, Application.
4. Can you provide details about the market size?
The market size is estimated to be USD 78.12 Million as of 2022.
5. What are some drivers contributing to market growth?
Increasing Demand for Long-term Pain Management from the Geriatric Population; Proven Efficacy of Pain Management Devices for the Treatment of Chronic Pain; Development of Novel Pain Management Devices and Techniques.
6. What are the notable trends driving market growth?
Facial Pain and Migraine Segment is Expected to Exhibit a Significant Growth Rate During the Forecast Period.
7. Are there any restraints impacting market growth?
Lack of Awareness About the Availability and Use of Pain Management Devices; High Procedural and Purchase Cost of Pain Management Devices.
8. Can you provide examples of recent developments in the market?
October 2022: Parker Laboratories Inc., which develops, manufactures, and sells pain relief creams, ultrasound and electromedical contact media, and institutional cleaners and disinfectants, is expanding its analgesics line. The company has added Helix CBD Therapy Cream, CBD Clinical Cream, and Tri-Active Therapy Cream to its HelixTM line.
9. What pricing options are available for accessing the report?
Pricing options include single-user, multi-user, and enterprise licenses priced at USD 4750, USD 5250, and USD 8750 respectively.
10. Is the market size provided in terms of value or volume?
The market size is provided in terms of value, measured in Million and volume, measured in K Unit.
11. Are there any specific market keywords associated with the report?
Yes, the market keyword associated with the report is "Chronic Pain Treatment Market," which aids in identifying and referencing the specific market segment covered.
12. How do I determine which pricing option suits my needs best?
The pricing options vary based on user requirements and access needs. Individual users may opt for single-user licenses, while businesses requiring broader access may choose multi-user or enterprise licenses for cost-effective access to the report.
13. Are there any additional resources or data provided in the Chronic Pain Treatment Market report?
While the report offers comprehensive insights, it's advisable to review the specific contents or supplementary materials provided to ascertain if additional resources or data are available.
14. How can I stay updated on further developments or reports in the Chronic Pain Treatment Market?
To stay informed about further developments, trends, and reports in the Chronic Pain Treatment Market, consider subscribing to industry newsletters, following relevant companies and organizations, or regularly checking reputable industry news sources and publications.
Methodology
Step 1 - Identification of Relevant Samples Size from Population Database


Step 2 - Approaches for Defining Global Market Size (Value, Volume* & Price*)

Note*: In applicable scenarios
Step 3 - Data Sources
Primary Research
- Web Analytics
- Survey Reports
- Research Institute
- Latest Research Reports
- Opinion Leaders
Secondary Research
- Annual Reports
- White Paper
- Latest Press Release
- Industry Association
- Paid Database
- Investor Presentations

Step 4 - Data Triangulation
Involves using different sources of information in order to increase the validity of a study
These sources are likely to be stakeholders in a program - participants, other researchers, program staff, other community members, and so on.
Then we put all data in single framework & apply various statistical tools to find out the dynamic on the market.
During the analysis stage, feedback from the stakeholder groups would be compared to determine areas of agreement as well as areas of divergence


