
Key Insights
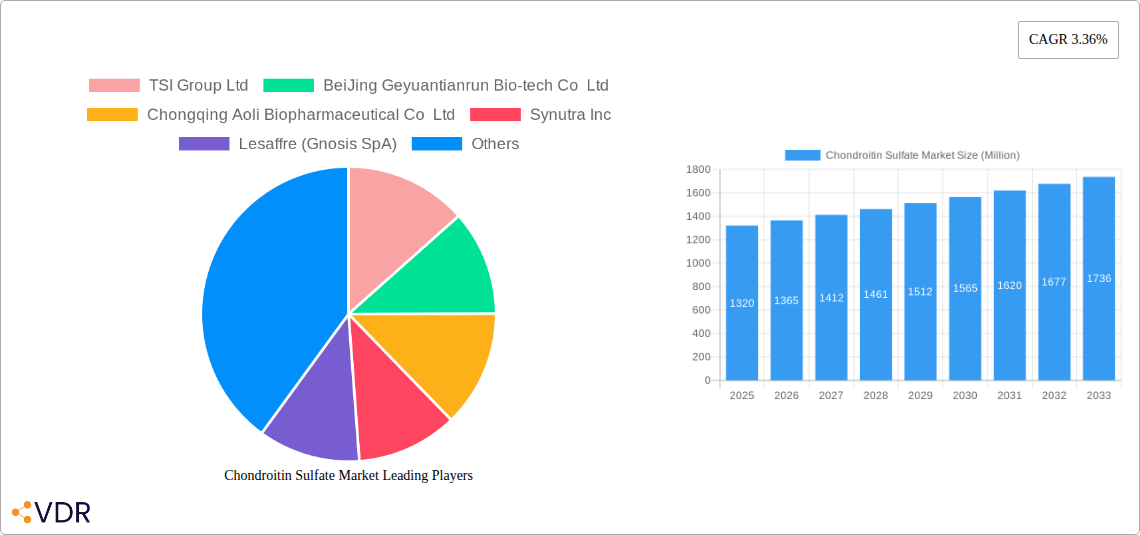
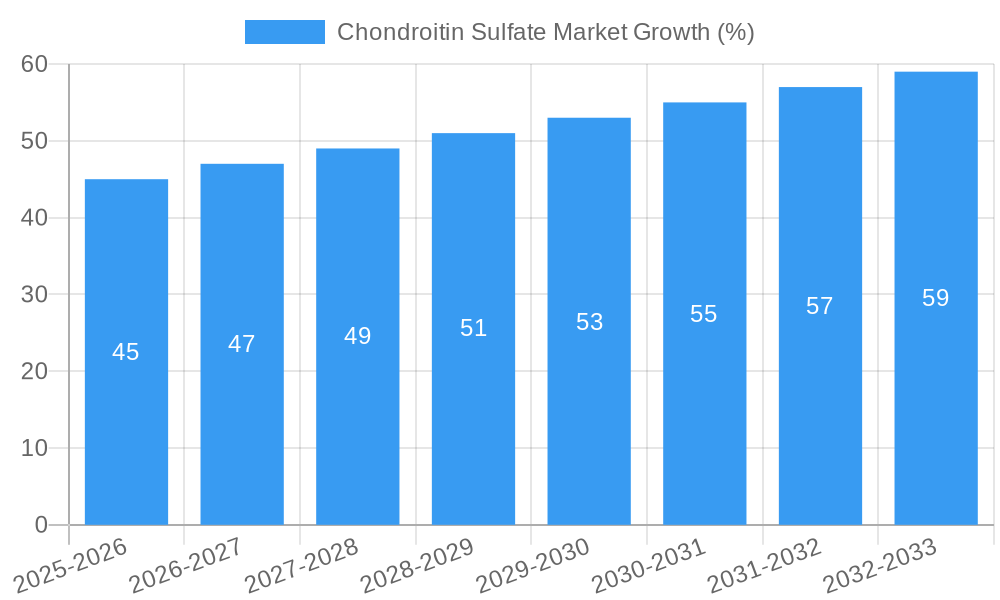
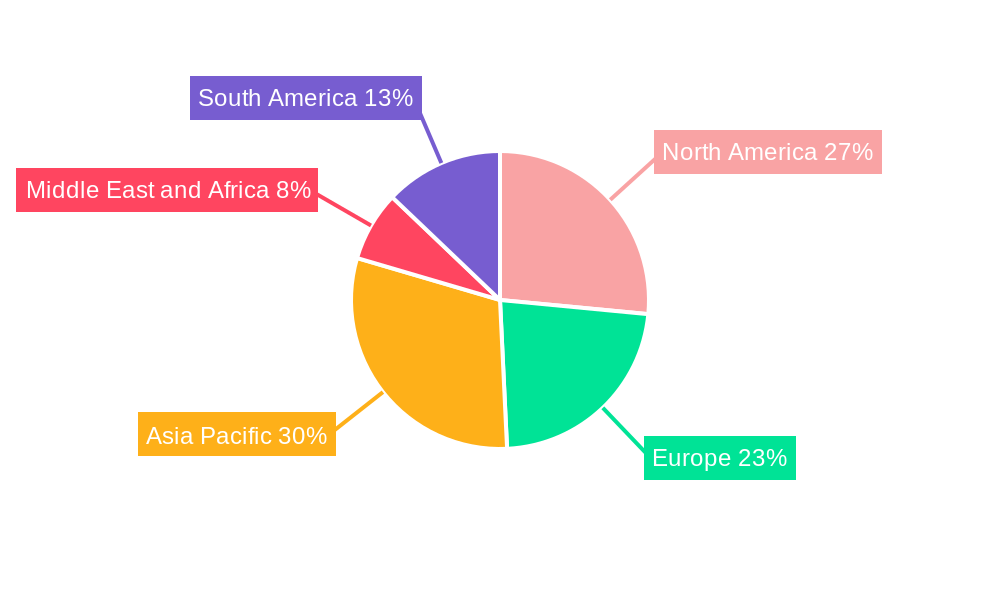
The global chondroitin sulfate market, valued at $1.32 billion in 2025, is projected to experience steady growth, driven by the increasing prevalence of osteoarthritis and the rising demand for effective joint health supplements. The market's Compound Annual Growth Rate (CAGR) of 3.36% from 2025 to 2033 indicates a consistent expansion, fueled by several key factors. The pharmaceutical application segment is expected to dominate, owing to the widespread use of chondroitin sulfate in osteoarthritis treatments. Significant growth is also anticipated from the cosmetics sector, leveraging its purported skin-rejuvenating properties. While bovine sources currently hold a major share, the synthetic segment is likely to gain momentum driven by concerns regarding animal-derived sourcing and increasing consumer demand for cruelty-free products. However, market growth may be tempered by factors like stringent regulatory approvals for pharmaceutical applications and the potential for side effects in some individuals, necessitating cautious monitoring and transparent product labeling. Geographical distribution shows strong market presence in North America and Europe, but rapid growth is expected in Asia-Pacific, especially in countries with aging populations and increasing healthcare spending. The competitive landscape is characterized by a mix of large multinational companies and smaller specialized players, indicating potential for both consolidation and innovation in the coming years.
The market segmentation reveals a diverse landscape. The pharmaceutical segment's dominant position underscores the critical role of chondroitin sulfate in treating osteoarthritis and other joint conditions. The growth in the cosmetics segment reflects the increasing consumer interest in natural and effective anti-aging solutions. Among sources, bovine chondroitin sulfate currently holds the largest share, but the synthetic segment is projected to grow significantly, driven by ethical and sustainability considerations. Regional differences reflect varying healthcare infrastructure, consumer awareness, and regulatory environments. North America and Europe are established markets with a high level of consumer awareness and acceptance, while Asia-Pacific presents significant growth opportunities due to a burgeoning middle class and rising disposable incomes. The competitive landscape is dynamic, with established players competing with emerging companies focused on innovation and niche market segments. This presents opportunities for both large-scale production and specialized, high-quality products catering to specific consumer needs.
Chondroitin Sulfate Market: A Comprehensive Analysis (2019-2033)
This comprehensive report provides an in-depth analysis of the Chondroitin Sulfate market, encompassing its dynamics, growth trends, regional segmentation, product landscape, and key players. The study covers the historical period (2019-2024), base year (2025), and forecast period (2025-2033), offering valuable insights for industry professionals, investors, and stakeholders. The total market size is projected to reach xx Million by 2033. This report segments the market by application (Pharmaceuticals, Cosmetics, Veterinary) and source (Swine, Shark, Bovine, Synthetic, Other Sources), providing a granular understanding of this dynamic sector.
Chondroitin Sulfate Market Market Dynamics & Structure
The Chondroitin Sulfate market exhibits a moderately fragmented structure, with several key players vying for market share. Technological innovation, particularly in extraction methods and product formulation, is a key driver. Regulatory frameworks concerning food and drug safety significantly influence market dynamics. Competitive substitutes, such as glucosamine and hyaluronic acid, pose challenges. The end-user demographics are largely focused on the aging population seeking joint health solutions. M&A activity within the market has been moderate, with xx deals recorded between 2019 and 2024, indicating a strategic focus on consolidation and expansion.
- Market Concentration: Moderately fragmented, with the top 5 players holding an estimated xx% market share in 2024.
- Technological Innovation: Focus on sustainable sourcing, improved purity, and bioavailability.
- Regulatory Framework: Stringent regulations concerning food safety and labeling in key markets.
- Competitive Substitutes: Glucosamine and hyaluronic acid are major competitors.
- End-User Demographics: Predominantly aging population with osteoarthritis and joint pain.
- M&A Trends: Moderate activity, driven by strategic expansion and consolidation.
Chondroitin Sulfate Market Growth Trends & Insights
The Chondroitin Sulfate market experienced a CAGR of xx% during the historical period (2019-2024), driven by increasing prevalence of osteoarthritis and growing consumer awareness of joint health supplements. Adoption rates are higher in developed regions with aging populations and readily available healthcare access. Technological disruptions, such as the development of novel delivery systems and enhanced extraction techniques, are accelerating market growth. Consumer behavior is shifting towards natural and scientifically-backed supplements. The market is expected to maintain a steady growth trajectory during the forecast period, with a projected CAGR of xx% from 2025 to 2033. Market penetration is expected to increase significantly in emerging markets with rising disposable incomes.
Dominant Regions, Countries, or Segments in Chondroitin Sulfate Market
North America dominates the Chondroitin Sulfate market, holding the largest market share due to high consumer awareness, established healthcare infrastructure, and high per capita expenditure on healthcare products. Europe also holds a significant market share, closely following North America. Within the application segments, Pharmaceuticals accounts for the largest portion of the market. In terms of source, the market is diversified with bovine and synthetic sources holding significant market shares.
- North America: High consumer awareness of joint health supplements and well-established healthcare infrastructure.
- Europe: Significant market size driven by aging population and high adoption rates.
- Pharmaceuticals Segment: Largest application segment due to high demand from pharmaceutical companies.
- Bovine & Synthetic Sources: Leading sources due to cost-effectiveness and availability.
- Asia-Pacific: High growth potential driven by rising disposable incomes and increasing prevalence of osteoarthritis.
Chondroitin Sulfate Market Product Landscape
Chondroitin sulfate products are available in various forms, including capsules, tablets, powders, and injectables. Innovations focus on enhanced bioavailability, improved purity, and the development of novel formulations that address specific consumer needs. Technological advancements include the use of advanced extraction methods to enhance product quality and reduce impurities. The unique selling propositions (USPs) of many products lie in their source (e.g., sustainable sourcing, organic certification), purity, and bioavailability claims.
Key Drivers, Barriers & Challenges in Chondroitin Sulfate Market
Key Drivers: Rising prevalence of osteoarthritis, increasing consumer awareness, technological advancements in extraction and formulation, and growing demand for natural health supplements.
Key Challenges & Restraints: Fluctuations in raw material prices, stringent regulatory compliance requirements, competition from substitute products (glucosamine, hyaluronic acid), and concerns regarding potential side effects. The supply chain's vulnerability to disruptions is estimated to cause a xx% impact on market growth in the next 5 years.
Emerging Opportunities in Chondroitin Sulfate Market
Emerging opportunities exist in developing innovative delivery systems (e.g., targeted delivery), personalized formulations based on individual needs, and expanding into new markets with high growth potential (e.g., Latin America and Africa). Growing interest in personalized medicine offers a major growth driver and increasing awareness of joint health in young adults creates an important niche market.
Growth Accelerators in the Chondroitin Sulfate Market Industry
Strategic partnerships between raw material suppliers and supplement manufacturers, along with technological breakthroughs enhancing extraction and purification processes, are key growth catalysts. The expansion into untapped markets, driven by rising disposable incomes and aging populations in emerging economies, is also a significant growth driver.
Key Players Shaping the Chondroitin Sulfate Market Market
- TSI Group Ltd
- BeiJing Geyuantianrun Bio-tech Co Ltd
- Chongqing Aoli Biopharmaceutical Co Ltd
- Synutra Inc
- Lesaffre (Gnosis SpA)
- Merck KGaA (Sigma-Aldrich Inc)
- Beloor Bayir
- Rochem International Inc
- Summit Nutritionals International
- BASIC NUTRITION
- SARIA International GmbH (Bioiberica S A U)
Notable Milestones in Chondroitin Sulfate Market Sector
- July 2022: Infinitus launched a new series of Li Mai Jian supplements focusing on joint health, expanding the market reach within China.
- March 2022: Bioiberica partnered with ByHealth to launch Highflex, a type II collagen tablet, targeting unmet consumer needs for joint health solutions in China. This collaboration signals a move toward innovative low-dose solutions and expands Bioiberica’s market presence.
In-Depth Chondroitin Sulfate Market Market Outlook
The Chondroitin Sulfate market is poised for robust growth driven by increasing demand for joint health solutions across various applications. Strategic partnerships, technological advancements, and expansion into emerging markets present significant opportunities for future growth and profitability. The market will continue its upward trajectory, spurred by technological innovation, growing healthcare awareness, and evolving consumer preferences.
Chondroitin Sulfate Market Segmentation
-
1. Source
- 1.1. Swine
- 1.2. Shark
- 1.3. Bovine
- 1.4. Synthetic
- 1.5. Other Sources
-
2. Application
- 2.1. Pharmaceuticals
- 2.2. Cosmetics
- 2.3. Veterinary
Chondroitin Sulfate Market Segmentation By Geography
-
1. North America
- 1.1. United States
- 1.2. Canada
- 1.3. Mexico
-
2. Europe
- 2.1. Germany
- 2.2. United Kingdom
- 2.3. France
- 2.4. Italy
- 2.5. Spain
- 2.6. Rest of Europe
-
3. Asia Pacific
- 3.1. China
- 3.2. Japan
- 3.3. India
- 3.4. Australia
- 3.5. South Korea
- 3.6. Rest of Asia Pacific
-
4. Middle East and Africa
- 4.1. GCC
- 4.2. South Africa
- 4.3. Rest of Middle East and Africa
-
5. South America
- 5.1. Brazil
- 5.2. Argentina
- 5.3. Rest of South America
Chondroitin Sulfate Market REPORT HIGHLIGHTS
| Aspects | Details |
|---|---|
| Study Period | 2019-2033 |
| Base Year | 2024 |
| Estimated Year | 2025 |
| Forecast Period | 2025-2033 |
| Historical Period | 2019-2024 |
| Growth Rate | CAGR of 3.36% from 2019-2033 |
| Segmentation |
|
Table of Contents
- 1. Introduction
- 1.1. Research Scope
- 1.2. Market Segmentation
- 1.3. Research Methodology
- 1.4. Definitions and Assumptions
- 2. Executive Summary
- 2.1. Introduction
- 3. Market Dynamics
- 3.1. Introduction
- 3.2. Market Drivers
- 3.2.1. Increasing Prevalence of Osteoarthritis; Growing Applications of Chondroitin Sulfate
- 3.3. Market Restrains
- 3.3.1. Adverse Effects of Chondroitin Sulfate
- 3.4. Market Trends
- 3.4.1. The Pharmaceutical Segment is Expected to Witness Significant Growth During the Forecast Period
- 4. Market Factor Analysis
- 4.1. Porters Five Forces
- 4.2. Supply/Value Chain
- 4.3. PESTEL analysis
- 4.4. Market Entropy
- 4.5. Patent/Trademark Analysis
- 5. Global Chondroitin Sulfate Market Analysis, Insights and Forecast, 2019-2031
- 5.1. Market Analysis, Insights and Forecast - by Source
- 5.1.1. Swine
- 5.1.2. Shark
- 5.1.3. Bovine
- 5.1.4. Synthetic
- 5.1.5. Other Sources
- 5.2. Market Analysis, Insights and Forecast - by Application
- 5.2.1. Pharmaceuticals
- 5.2.2. Cosmetics
- 5.2.3. Veterinary
- 5.3. Market Analysis, Insights and Forecast - by Region
- 5.3.1. North America
- 5.3.2. Europe
- 5.3.3. Asia Pacific
- 5.3.4. Middle East and Africa
- 5.3.5. South America
- 5.1. Market Analysis, Insights and Forecast - by Source
- 6. North America Chondroitin Sulfate Market Analysis, Insights and Forecast, 2019-2031
- 6.1. Market Analysis, Insights and Forecast - by Source
- 6.1.1. Swine
- 6.1.2. Shark
- 6.1.3. Bovine
- 6.1.4. Synthetic
- 6.1.5. Other Sources
- 6.2. Market Analysis, Insights and Forecast - by Application
- 6.2.1. Pharmaceuticals
- 6.2.2. Cosmetics
- 6.2.3. Veterinary
- 6.1. Market Analysis, Insights and Forecast - by Source
- 7. Europe Chondroitin Sulfate Market Analysis, Insights and Forecast, 2019-2031
- 7.1. Market Analysis, Insights and Forecast - by Source
- 7.1.1. Swine
- 7.1.2. Shark
- 7.1.3. Bovine
- 7.1.4. Synthetic
- 7.1.5. Other Sources
- 7.2. Market Analysis, Insights and Forecast - by Application
- 7.2.1. Pharmaceuticals
- 7.2.2. Cosmetics
- 7.2.3. Veterinary
- 7.1. Market Analysis, Insights and Forecast - by Source
- 8. Asia Pacific Chondroitin Sulfate Market Analysis, Insights and Forecast, 2019-2031
- 8.1. Market Analysis, Insights and Forecast - by Source
- 8.1.1. Swine
- 8.1.2. Shark
- 8.1.3. Bovine
- 8.1.4. Synthetic
- 8.1.5. Other Sources
- 8.2. Market Analysis, Insights and Forecast - by Application
- 8.2.1. Pharmaceuticals
- 8.2.2. Cosmetics
- 8.2.3. Veterinary
- 8.1. Market Analysis, Insights and Forecast - by Source
- 9. Middle East and Africa Chondroitin Sulfate Market Analysis, Insights and Forecast, 2019-2031
- 9.1. Market Analysis, Insights and Forecast - by Source
- 9.1.1. Swine
- 9.1.2. Shark
- 9.1.3. Bovine
- 9.1.4. Synthetic
- 9.1.5. Other Sources
- 9.2. Market Analysis, Insights and Forecast - by Application
- 9.2.1. Pharmaceuticals
- 9.2.2. Cosmetics
- 9.2.3. Veterinary
- 9.1. Market Analysis, Insights and Forecast - by Source
- 10. South America Chondroitin Sulfate Market Analysis, Insights and Forecast, 2019-2031
- 10.1. Market Analysis, Insights and Forecast - by Source
- 10.1.1. Swine
- 10.1.2. Shark
- 10.1.3. Bovine
- 10.1.4. Synthetic
- 10.1.5. Other Sources
- 10.2. Market Analysis, Insights and Forecast - by Application
- 10.2.1. Pharmaceuticals
- 10.2.2. Cosmetics
- 10.2.3. Veterinary
- 10.1. Market Analysis, Insights and Forecast - by Source
- 11. North America Chondroitin Sulfate Market Analysis, Insights and Forecast, 2019-2031
- 11.1. Market Analysis, Insights and Forecast - By Country/Sub-region
- 11.1.1 United States
- 11.1.2 Canada
- 11.1.3 Mexico
- 12. Europe Chondroitin Sulfate Market Analysis, Insights and Forecast, 2019-2031
- 12.1. Market Analysis, Insights and Forecast - By Country/Sub-region
- 12.1.1 Germany
- 12.1.2 United Kingdom
- 12.1.3 France
- 12.1.4 Italy
- 12.1.5 Spain
- 12.1.6 Rest of Europe
- 13. Asia Pacific Chondroitin Sulfate Market Analysis, Insights and Forecast, 2019-2031
- 13.1. Market Analysis, Insights and Forecast - By Country/Sub-region
- 13.1.1 China
- 13.1.2 Japan
- 13.1.3 India
- 13.1.4 Australia
- 13.1.5 South Korea
- 13.1.6 Rest of Asia Pacific
- 14. Middle East and Africa Chondroitin Sulfate Market Analysis, Insights and Forecast, 2019-2031
- 14.1. Market Analysis, Insights and Forecast - By Country/Sub-region
- 14.1.1 GCC
- 14.1.2 South Africa
- 14.1.3 Rest of Middle East and Africa
- 15. South America Chondroitin Sulfate Market Analysis, Insights and Forecast, 2019-2031
- 15.1. Market Analysis, Insights and Forecast - By Country/Sub-region
- 15.1.1 Brazil
- 15.1.2 Argentina
- 15.1.3 Rest of South America
- 16. Competitive Analysis
- 16.1. Global Market Share Analysis 2024
- 16.2. Company Profiles
- 16.2.1 TSI Group Ltd
- 16.2.1.1. Overview
- 16.2.1.2. Products
- 16.2.1.3. SWOT Analysis
- 16.2.1.4. Recent Developments
- 16.2.1.5. Financials (Based on Availability)
- 16.2.2 BeiJing Geyuantianrun Bio-tech Co Ltd
- 16.2.2.1. Overview
- 16.2.2.2. Products
- 16.2.2.3. SWOT Analysis
- 16.2.2.4. Recent Developments
- 16.2.2.5. Financials (Based on Availability)
- 16.2.3 Chongqing Aoli Biopharmaceutical Co Ltd
- 16.2.3.1. Overview
- 16.2.3.2. Products
- 16.2.3.3. SWOT Analysis
- 16.2.3.4. Recent Developments
- 16.2.3.5. Financials (Based on Availability)
- 16.2.4 Synutra Inc
- 16.2.4.1. Overview
- 16.2.4.2. Products
- 16.2.4.3. SWOT Analysis
- 16.2.4.4. Recent Developments
- 16.2.4.5. Financials (Based on Availability)
- 16.2.5 Lesaffre (Gnosis SpA)
- 16.2.5.1. Overview
- 16.2.5.2. Products
- 16.2.5.3. SWOT Analysis
- 16.2.5.4. Recent Developments
- 16.2.5.5. Financials (Based on Availability)
- 16.2.6 Merck KGaA (Sigma-Aldrich Inc )
- 16.2.6.1. Overview
- 16.2.6.2. Products
- 16.2.6.3. SWOT Analysis
- 16.2.6.4. Recent Developments
- 16.2.6.5. Financials (Based on Availability)
- 16.2.7 Beloor Bayir
- 16.2.7.1. Overview
- 16.2.7.2. Products
- 16.2.7.3. SWOT Analysis
- 16.2.7.4. Recent Developments
- 16.2.7.5. Financials (Based on Availability)
- 16.2.8 Rochem International Inc
- 16.2.8.1. Overview
- 16.2.8.2. Products
- 16.2.8.3. SWOT Analysis
- 16.2.8.4. Recent Developments
- 16.2.8.5. Financials (Based on Availability)
- 16.2.9 Summit Nutritionals International
- 16.2.9.1. Overview
- 16.2.9.2. Products
- 16.2.9.3. SWOT Analysis
- 16.2.9.4. Recent Developments
- 16.2.9.5. Financials (Based on Availability)
- 16.2.10 BASIC NUTRITION
- 16.2.10.1. Overview
- 16.2.10.2. Products
- 16.2.10.3. SWOT Analysis
- 16.2.10.4. Recent Developments
- 16.2.10.5. Financials (Based on Availability)
- 16.2.11 SARIA International GmbH (Bioiberica S A U)
- 16.2.11.1. Overview
- 16.2.11.2. Products
- 16.2.11.3. SWOT Analysis
- 16.2.11.4. Recent Developments
- 16.2.11.5. Financials (Based on Availability)
- 16.2.1 TSI Group Ltd
List of Figures
- Figure 1: Global Chondroitin Sulfate Market Revenue Breakdown (Million, %) by Region 2024 & 2032
- Figure 2: Global Chondroitin Sulfate Market Volume Breakdown (K Unit, %) by Region 2024 & 2032
- Figure 3: North America Chondroitin Sulfate Market Revenue (Million), by Country 2024 & 2032
- Figure 4: North America Chondroitin Sulfate Market Volume (K Unit), by Country 2024 & 2032
- Figure 5: North America Chondroitin Sulfate Market Revenue Share (%), by Country 2024 & 2032
- Figure 6: North America Chondroitin Sulfate Market Volume Share (%), by Country 2024 & 2032
- Figure 7: Europe Chondroitin Sulfate Market Revenue (Million), by Country 2024 & 2032
- Figure 8: Europe Chondroitin Sulfate Market Volume (K Unit), by Country 2024 & 2032
- Figure 9: Europe Chondroitin Sulfate Market Revenue Share (%), by Country 2024 & 2032
- Figure 10: Europe Chondroitin Sulfate Market Volume Share (%), by Country 2024 & 2032
- Figure 11: Asia Pacific Chondroitin Sulfate Market Revenue (Million), by Country 2024 & 2032
- Figure 12: Asia Pacific Chondroitin Sulfate Market Volume (K Unit), by Country 2024 & 2032
- Figure 13: Asia Pacific Chondroitin Sulfate Market Revenue Share (%), by Country 2024 & 2032
- Figure 14: Asia Pacific Chondroitin Sulfate Market Volume Share (%), by Country 2024 & 2032
- Figure 15: Middle East and Africa Chondroitin Sulfate Market Revenue (Million), by Country 2024 & 2032
- Figure 16: Middle East and Africa Chondroitin Sulfate Market Volume (K Unit), by Country 2024 & 2032
- Figure 17: Middle East and Africa Chondroitin Sulfate Market Revenue Share (%), by Country 2024 & 2032
- Figure 18: Middle East and Africa Chondroitin Sulfate Market Volume Share (%), by Country 2024 & 2032
- Figure 19: South America Chondroitin Sulfate Market Revenue (Million), by Country 2024 & 2032
- Figure 20: South America Chondroitin Sulfate Market Volume (K Unit), by Country 2024 & 2032
- Figure 21: South America Chondroitin Sulfate Market Revenue Share (%), by Country 2024 & 2032
- Figure 22: South America Chondroitin Sulfate Market Volume Share (%), by Country 2024 & 2032
- Figure 23: North America Chondroitin Sulfate Market Revenue (Million), by Source 2024 & 2032
- Figure 24: North America Chondroitin Sulfate Market Volume (K Unit), by Source 2024 & 2032
- Figure 25: North America Chondroitin Sulfate Market Revenue Share (%), by Source 2024 & 2032
- Figure 26: North America Chondroitin Sulfate Market Volume Share (%), by Source 2024 & 2032
- Figure 27: North America Chondroitin Sulfate Market Revenue (Million), by Application 2024 & 2032
- Figure 28: North America Chondroitin Sulfate Market Volume (K Unit), by Application 2024 & 2032
- Figure 29: North America Chondroitin Sulfate Market Revenue Share (%), by Application 2024 & 2032
- Figure 30: North America Chondroitin Sulfate Market Volume Share (%), by Application 2024 & 2032
- Figure 31: North America Chondroitin Sulfate Market Revenue (Million), by Country 2024 & 2032
- Figure 32: North America Chondroitin Sulfate Market Volume (K Unit), by Country 2024 & 2032
- Figure 33: North America Chondroitin Sulfate Market Revenue Share (%), by Country 2024 & 2032
- Figure 34: North America Chondroitin Sulfate Market Volume Share (%), by Country 2024 & 2032
- Figure 35: Europe Chondroitin Sulfate Market Revenue (Million), by Source 2024 & 2032
- Figure 36: Europe Chondroitin Sulfate Market Volume (K Unit), by Source 2024 & 2032
- Figure 37: Europe Chondroitin Sulfate Market Revenue Share (%), by Source 2024 & 2032
- Figure 38: Europe Chondroitin Sulfate Market Volume Share (%), by Source 2024 & 2032
- Figure 39: Europe Chondroitin Sulfate Market Revenue (Million), by Application 2024 & 2032
- Figure 40: Europe Chondroitin Sulfate Market Volume (K Unit), by Application 2024 & 2032
- Figure 41: Europe Chondroitin Sulfate Market Revenue Share (%), by Application 2024 & 2032
- Figure 42: Europe Chondroitin Sulfate Market Volume Share (%), by Application 2024 & 2032
- Figure 43: Europe Chondroitin Sulfate Market Revenue (Million), by Country 2024 & 2032
- Figure 44: Europe Chondroitin Sulfate Market Volume (K Unit), by Country 2024 & 2032
- Figure 45: Europe Chondroitin Sulfate Market Revenue Share (%), by Country 2024 & 2032
- Figure 46: Europe Chondroitin Sulfate Market Volume Share (%), by Country 2024 & 2032
- Figure 47: Asia Pacific Chondroitin Sulfate Market Revenue (Million), by Source 2024 & 2032
- Figure 48: Asia Pacific Chondroitin Sulfate Market Volume (K Unit), by Source 2024 & 2032
- Figure 49: Asia Pacific Chondroitin Sulfate Market Revenue Share (%), by Source 2024 & 2032
- Figure 50: Asia Pacific Chondroitin Sulfate Market Volume Share (%), by Source 2024 & 2032
- Figure 51: Asia Pacific Chondroitin Sulfate Market Revenue (Million), by Application 2024 & 2032
- Figure 52: Asia Pacific Chondroitin Sulfate Market Volume (K Unit), by Application 2024 & 2032
- Figure 53: Asia Pacific Chondroitin Sulfate Market Revenue Share (%), by Application 2024 & 2032
- Figure 54: Asia Pacific Chondroitin Sulfate Market Volume Share (%), by Application 2024 & 2032
- Figure 55: Asia Pacific Chondroitin Sulfate Market Revenue (Million), by Country 2024 & 2032
- Figure 56: Asia Pacific Chondroitin Sulfate Market Volume (K Unit), by Country 2024 & 2032
- Figure 57: Asia Pacific Chondroitin Sulfate Market Revenue Share (%), by Country 2024 & 2032
- Figure 58: Asia Pacific Chondroitin Sulfate Market Volume Share (%), by Country 2024 & 2032
- Figure 59: Middle East and Africa Chondroitin Sulfate Market Revenue (Million), by Source 2024 & 2032
- Figure 60: Middle East and Africa Chondroitin Sulfate Market Volume (K Unit), by Source 2024 & 2032
- Figure 61: Middle East and Africa Chondroitin Sulfate Market Revenue Share (%), by Source 2024 & 2032
- Figure 62: Middle East and Africa Chondroitin Sulfate Market Volume Share (%), by Source 2024 & 2032
- Figure 63: Middle East and Africa Chondroitin Sulfate Market Revenue (Million), by Application 2024 & 2032
- Figure 64: Middle East and Africa Chondroitin Sulfate Market Volume (K Unit), by Application 2024 & 2032
- Figure 65: Middle East and Africa Chondroitin Sulfate Market Revenue Share (%), by Application 2024 & 2032
- Figure 66: Middle East and Africa Chondroitin Sulfate Market Volume Share (%), by Application 2024 & 2032
- Figure 67: Middle East and Africa Chondroitin Sulfate Market Revenue (Million), by Country 2024 & 2032
- Figure 68: Middle East and Africa Chondroitin Sulfate Market Volume (K Unit), by Country 2024 & 2032
- Figure 69: Middle East and Africa Chondroitin Sulfate Market Revenue Share (%), by Country 2024 & 2032
- Figure 70: Middle East and Africa Chondroitin Sulfate Market Volume Share (%), by Country 2024 & 2032
- Figure 71: South America Chondroitin Sulfate Market Revenue (Million), by Source 2024 & 2032
- Figure 72: South America Chondroitin Sulfate Market Volume (K Unit), by Source 2024 & 2032
- Figure 73: South America Chondroitin Sulfate Market Revenue Share (%), by Source 2024 & 2032
- Figure 74: South America Chondroitin Sulfate Market Volume Share (%), by Source 2024 & 2032
- Figure 75: South America Chondroitin Sulfate Market Revenue (Million), by Application 2024 & 2032
- Figure 76: South America Chondroitin Sulfate Market Volume (K Unit), by Application 2024 & 2032
- Figure 77: South America Chondroitin Sulfate Market Revenue Share (%), by Application 2024 & 2032
- Figure 78: South America Chondroitin Sulfate Market Volume Share (%), by Application 2024 & 2032
- Figure 79: South America Chondroitin Sulfate Market Revenue (Million), by Country 2024 & 2032
- Figure 80: South America Chondroitin Sulfate Market Volume (K Unit), by Country 2024 & 2032
- Figure 81: South America Chondroitin Sulfate Market Revenue Share (%), by Country 2024 & 2032
- Figure 82: South America Chondroitin Sulfate Market Volume Share (%), by Country 2024 & 2032
List of Tables
- Table 1: Global Chondroitin Sulfate Market Revenue Million Forecast, by Region 2019 & 2032
- Table 2: Global Chondroitin Sulfate Market Volume K Unit Forecast, by Region 2019 & 2032
- Table 3: Global Chondroitin Sulfate Market Revenue Million Forecast, by Source 2019 & 2032
- Table 4: Global Chondroitin Sulfate Market Volume K Unit Forecast, by Source 2019 & 2032
- Table 5: Global Chondroitin Sulfate Market Revenue Million Forecast, by Application 2019 & 2032
- Table 6: Global Chondroitin Sulfate Market Volume K Unit Forecast, by Application 2019 & 2032
- Table 7: Global Chondroitin Sulfate Market Revenue Million Forecast, by Region 2019 & 2032
- Table 8: Global Chondroitin Sulfate Market Volume K Unit Forecast, by Region 2019 & 2032
- Table 9: Global Chondroitin Sulfate Market Revenue Million Forecast, by Country 2019 & 2032
- Table 10: Global Chondroitin Sulfate Market Volume K Unit Forecast, by Country 2019 & 2032
- Table 11: United States Chondroitin Sulfate Market Revenue (Million) Forecast, by Application 2019 & 2032
- Table 12: United States Chondroitin Sulfate Market Volume (K Unit) Forecast, by Application 2019 & 2032
- Table 13: Canada Chondroitin Sulfate Market Revenue (Million) Forecast, by Application 2019 & 2032
- Table 14: Canada Chondroitin Sulfate Market Volume (K Unit) Forecast, by Application 2019 & 2032
- Table 15: Mexico Chondroitin Sulfate Market Revenue (Million) Forecast, by Application 2019 & 2032
- Table 16: Mexico Chondroitin Sulfate Market Volume (K Unit) Forecast, by Application 2019 & 2032
- Table 17: Global Chondroitin Sulfate Market Revenue Million Forecast, by Country 2019 & 2032
- Table 18: Global Chondroitin Sulfate Market Volume K Unit Forecast, by Country 2019 & 2032
- Table 19: Germany Chondroitin Sulfate Market Revenue (Million) Forecast, by Application 2019 & 2032
- Table 20: Germany Chondroitin Sulfate Market Volume (K Unit) Forecast, by Application 2019 & 2032
- Table 21: United Kingdom Chondroitin Sulfate Market Revenue (Million) Forecast, by Application 2019 & 2032
- Table 22: United Kingdom Chondroitin Sulfate Market Volume (K Unit) Forecast, by Application 2019 & 2032
- Table 23: France Chondroitin Sulfate Market Revenue (Million) Forecast, by Application 2019 & 2032
- Table 24: France Chondroitin Sulfate Market Volume (K Unit) Forecast, by Application 2019 & 2032
- Table 25: Italy Chondroitin Sulfate Market Revenue (Million) Forecast, by Application 2019 & 2032
- Table 26: Italy Chondroitin Sulfate Market Volume (K Unit) Forecast, by Application 2019 & 2032
- Table 27: Spain Chondroitin Sulfate Market Revenue (Million) Forecast, by Application 2019 & 2032
- Table 28: Spain Chondroitin Sulfate Market Volume (K Unit) Forecast, by Application 2019 & 2032
- Table 29: Rest of Europe Chondroitin Sulfate Market Revenue (Million) Forecast, by Application 2019 & 2032
- Table 30: Rest of Europe Chondroitin Sulfate Market Volume (K Unit) Forecast, by Application 2019 & 2032
- Table 31: Global Chondroitin Sulfate Market Revenue Million Forecast, by Country 2019 & 2032
- Table 32: Global Chondroitin Sulfate Market Volume K Unit Forecast, by Country 2019 & 2032
- Table 33: China Chondroitin Sulfate Market Revenue (Million) Forecast, by Application 2019 & 2032
- Table 34: China Chondroitin Sulfate Market Volume (K Unit) Forecast, by Application 2019 & 2032
- Table 35: Japan Chondroitin Sulfate Market Revenue (Million) Forecast, by Application 2019 & 2032
- Table 36: Japan Chondroitin Sulfate Market Volume (K Unit) Forecast, by Application 2019 & 2032
- Table 37: India Chondroitin Sulfate Market Revenue (Million) Forecast, by Application 2019 & 2032
- Table 38: India Chondroitin Sulfate Market Volume (K Unit) Forecast, by Application 2019 & 2032
- Table 39: Australia Chondroitin Sulfate Market Revenue (Million) Forecast, by Application 2019 & 2032
- Table 40: Australia Chondroitin Sulfate Market Volume (K Unit) Forecast, by Application 2019 & 2032
- Table 41: South Korea Chondroitin Sulfate Market Revenue (Million) Forecast, by Application 2019 & 2032
- Table 42: South Korea Chondroitin Sulfate Market Volume (K Unit) Forecast, by Application 2019 & 2032
- Table 43: Rest of Asia Pacific Chondroitin Sulfate Market Revenue (Million) Forecast, by Application 2019 & 2032
- Table 44: Rest of Asia Pacific Chondroitin Sulfate Market Volume (K Unit) Forecast, by Application 2019 & 2032
- Table 45: Global Chondroitin Sulfate Market Revenue Million Forecast, by Country 2019 & 2032
- Table 46: Global Chondroitin Sulfate Market Volume K Unit Forecast, by Country 2019 & 2032
- Table 47: GCC Chondroitin Sulfate Market Revenue (Million) Forecast, by Application 2019 & 2032
- Table 48: GCC Chondroitin Sulfate Market Volume (K Unit) Forecast, by Application 2019 & 2032
- Table 49: South Africa Chondroitin Sulfate Market Revenue (Million) Forecast, by Application 2019 & 2032
- Table 50: South Africa Chondroitin Sulfate Market Volume (K Unit) Forecast, by Application 2019 & 2032
- Table 51: Rest of Middle East and Africa Chondroitin Sulfate Market Revenue (Million) Forecast, by Application 2019 & 2032
- Table 52: Rest of Middle East and Africa Chondroitin Sulfate Market Volume (K Unit) Forecast, by Application 2019 & 2032
- Table 53: Global Chondroitin Sulfate Market Revenue Million Forecast, by Country 2019 & 2032
- Table 54: Global Chondroitin Sulfate Market Volume K Unit Forecast, by Country 2019 & 2032
- Table 55: Brazil Chondroitin Sulfate Market Revenue (Million) Forecast, by Application 2019 & 2032
- Table 56: Brazil Chondroitin Sulfate Market Volume (K Unit) Forecast, by Application 2019 & 2032
- Table 57: Argentina Chondroitin Sulfate Market Revenue (Million) Forecast, by Application 2019 & 2032
- Table 58: Argentina Chondroitin Sulfate Market Volume (K Unit) Forecast, by Application 2019 & 2032
- Table 59: Rest of South America Chondroitin Sulfate Market Revenue (Million) Forecast, by Application 2019 & 2032
- Table 60: Rest of South America Chondroitin Sulfate Market Volume (K Unit) Forecast, by Application 2019 & 2032
- Table 61: Global Chondroitin Sulfate Market Revenue Million Forecast, by Source 2019 & 2032
- Table 62: Global Chondroitin Sulfate Market Volume K Unit Forecast, by Source 2019 & 2032
- Table 63: Global Chondroitin Sulfate Market Revenue Million Forecast, by Application 2019 & 2032
- Table 64: Global Chondroitin Sulfate Market Volume K Unit Forecast, by Application 2019 & 2032
- Table 65: Global Chondroitin Sulfate Market Revenue Million Forecast, by Country 2019 & 2032
- Table 66: Global Chondroitin Sulfate Market Volume K Unit Forecast, by Country 2019 & 2032
- Table 67: United States Chondroitin Sulfate Market Revenue (Million) Forecast, by Application 2019 & 2032
- Table 68: United States Chondroitin Sulfate Market Volume (K Unit) Forecast, by Application 2019 & 2032
- Table 69: Canada Chondroitin Sulfate Market Revenue (Million) Forecast, by Application 2019 & 2032
- Table 70: Canada Chondroitin Sulfate Market Volume (K Unit) Forecast, by Application 2019 & 2032
- Table 71: Mexico Chondroitin Sulfate Market Revenue (Million) Forecast, by Application 2019 & 2032
- Table 72: Mexico Chondroitin Sulfate Market Volume (K Unit) Forecast, by Application 2019 & 2032
- Table 73: Global Chondroitin Sulfate Market Revenue Million Forecast, by Source 2019 & 2032
- Table 74: Global Chondroitin Sulfate Market Volume K Unit Forecast, by Source 2019 & 2032
- Table 75: Global Chondroitin Sulfate Market Revenue Million Forecast, by Application 2019 & 2032
- Table 76: Global Chondroitin Sulfate Market Volume K Unit Forecast, by Application 2019 & 2032
- Table 77: Global Chondroitin Sulfate Market Revenue Million Forecast, by Country 2019 & 2032
- Table 78: Global Chondroitin Sulfate Market Volume K Unit Forecast, by Country 2019 & 2032
- Table 79: Germany Chondroitin Sulfate Market Revenue (Million) Forecast, by Application 2019 & 2032
- Table 80: Germany Chondroitin Sulfate Market Volume (K Unit) Forecast, by Application 2019 & 2032
- Table 81: United Kingdom Chondroitin Sulfate Market Revenue (Million) Forecast, by Application 2019 & 2032
- Table 82: United Kingdom Chondroitin Sulfate Market Volume (K Unit) Forecast, by Application 2019 & 2032
- Table 83: France Chondroitin Sulfate Market Revenue (Million) Forecast, by Application 2019 & 2032
- Table 84: France Chondroitin Sulfate Market Volume (K Unit) Forecast, by Application 2019 & 2032
- Table 85: Italy Chondroitin Sulfate Market Revenue (Million) Forecast, by Application 2019 & 2032
- Table 86: Italy Chondroitin Sulfate Market Volume (K Unit) Forecast, by Application 2019 & 2032
- Table 87: Spain Chondroitin Sulfate Market Revenue (Million) Forecast, by Application 2019 & 2032
- Table 88: Spain Chondroitin Sulfate Market Volume (K Unit) Forecast, by Application 2019 & 2032
- Table 89: Rest of Europe Chondroitin Sulfate Market Revenue (Million) Forecast, by Application 2019 & 2032
- Table 90: Rest of Europe Chondroitin Sulfate Market Volume (K Unit) Forecast, by Application 2019 & 2032
- Table 91: Global Chondroitin Sulfate Market Revenue Million Forecast, by Source 2019 & 2032
- Table 92: Global Chondroitin Sulfate Market Volume K Unit Forecast, by Source 2019 & 2032
- Table 93: Global Chondroitin Sulfate Market Revenue Million Forecast, by Application 2019 & 2032
- Table 94: Global Chondroitin Sulfate Market Volume K Unit Forecast, by Application 2019 & 2032
- Table 95: Global Chondroitin Sulfate Market Revenue Million Forecast, by Country 2019 & 2032
- Table 96: Global Chondroitin Sulfate Market Volume K Unit Forecast, by Country 2019 & 2032
- Table 97: China Chondroitin Sulfate Market Revenue (Million) Forecast, by Application 2019 & 2032
- Table 98: China Chondroitin Sulfate Market Volume (K Unit) Forecast, by Application 2019 & 2032
- Table 99: Japan Chondroitin Sulfate Market Revenue (Million) Forecast, by Application 2019 & 2032
- Table 100: Japan Chondroitin Sulfate Market Volume (K Unit) Forecast, by Application 2019 & 2032
- Table 101: India Chondroitin Sulfate Market Revenue (Million) Forecast, by Application 2019 & 2032
- Table 102: India Chondroitin Sulfate Market Volume (K Unit) Forecast, by Application 2019 & 2032
- Table 103: Australia Chondroitin Sulfate Market Revenue (Million) Forecast, by Application 2019 & 2032
- Table 104: Australia Chondroitin Sulfate Market Volume (K Unit) Forecast, by Application 2019 & 2032
- Table 105: South Korea Chondroitin Sulfate Market Revenue (Million) Forecast, by Application 2019 & 2032
- Table 106: South Korea Chondroitin Sulfate Market Volume (K Unit) Forecast, by Application 2019 & 2032
- Table 107: Rest of Asia Pacific Chondroitin Sulfate Market Revenue (Million) Forecast, by Application 2019 & 2032
- Table 108: Rest of Asia Pacific Chondroitin Sulfate Market Volume (K Unit) Forecast, by Application 2019 & 2032
- Table 109: Global Chondroitin Sulfate Market Revenue Million Forecast, by Source 2019 & 2032
- Table 110: Global Chondroitin Sulfate Market Volume K Unit Forecast, by Source 2019 & 2032
- Table 111: Global Chondroitin Sulfate Market Revenue Million Forecast, by Application 2019 & 2032
- Table 112: Global Chondroitin Sulfate Market Volume K Unit Forecast, by Application 2019 & 2032
- Table 113: Global Chondroitin Sulfate Market Revenue Million Forecast, by Country 2019 & 2032
- Table 114: Global Chondroitin Sulfate Market Volume K Unit Forecast, by Country 2019 & 2032
- Table 115: GCC Chondroitin Sulfate Market Revenue (Million) Forecast, by Application 2019 & 2032
- Table 116: GCC Chondroitin Sulfate Market Volume (K Unit) Forecast, by Application 2019 & 2032
- Table 117: South Africa Chondroitin Sulfate Market Revenue (Million) Forecast, by Application 2019 & 2032
- Table 118: South Africa Chondroitin Sulfate Market Volume (K Unit) Forecast, by Application 2019 & 2032
- Table 119: Rest of Middle East and Africa Chondroitin Sulfate Market Revenue (Million) Forecast, by Application 2019 & 2032
- Table 120: Rest of Middle East and Africa Chondroitin Sulfate Market Volume (K Unit) Forecast, by Application 2019 & 2032
- Table 121: Global Chondroitin Sulfate Market Revenue Million Forecast, by Source 2019 & 2032
- Table 122: Global Chondroitin Sulfate Market Volume K Unit Forecast, by Source 2019 & 2032
- Table 123: Global Chondroitin Sulfate Market Revenue Million Forecast, by Application 2019 & 2032
- Table 124: Global Chondroitin Sulfate Market Volume K Unit Forecast, by Application 2019 & 2032
- Table 125: Global Chondroitin Sulfate Market Revenue Million Forecast, by Country 2019 & 2032
- Table 126: Global Chondroitin Sulfate Market Volume K Unit Forecast, by Country 2019 & 2032
- Table 127: Brazil Chondroitin Sulfate Market Revenue (Million) Forecast, by Application 2019 & 2032
- Table 128: Brazil Chondroitin Sulfate Market Volume (K Unit) Forecast, by Application 2019 & 2032
- Table 129: Argentina Chondroitin Sulfate Market Revenue (Million) Forecast, by Application 2019 & 2032
- Table 130: Argentina Chondroitin Sulfate Market Volume (K Unit) Forecast, by Application 2019 & 2032
- Table 131: Rest of South America Chondroitin Sulfate Market Revenue (Million) Forecast, by Application 2019 & 2032
- Table 132: Rest of South America Chondroitin Sulfate Market Volume (K Unit) Forecast, by Application 2019 & 2032
Frequently Asked Questions
1. What is the projected Compound Annual Growth Rate (CAGR) of the Chondroitin Sulfate Market?
The projected CAGR is approximately 3.36%.
2. Which companies are prominent players in the Chondroitin Sulfate Market?
Key companies in the market include TSI Group Ltd, BeiJing Geyuantianrun Bio-tech Co Ltd, Chongqing Aoli Biopharmaceutical Co Ltd, Synutra Inc, Lesaffre (Gnosis SpA), Merck KGaA (Sigma-Aldrich Inc ), Beloor Bayir, Rochem International Inc, Summit Nutritionals International, BASIC NUTRITION, SARIA International GmbH (Bioiberica S A U).
3. What are the main segments of the Chondroitin Sulfate Market?
The market segments include Source, Application.
4. Can you provide details about the market size?
The market size is estimated to be USD 1.32 Million as of 2022.
5. What are some drivers contributing to market growth?
Increasing Prevalence of Osteoarthritis; Growing Applications of Chondroitin Sulfate.
6. What are the notable trends driving market growth?
The Pharmaceutical Segment is Expected to Witness Significant Growth During the Forecast Period.
7. Are there any restraints impacting market growth?
Adverse Effects of Chondroitin Sulfate.
8. Can you provide examples of recent developments in the market?
July 2022: Infinitus, a Chinese herbal health products and services provider, launched a new series of Li Mai Jian supplements with the theme "Making Bones Stronger for Joint Health."
9. What pricing options are available for accessing the report?
Pricing options include single-user, multi-user, and enterprise licenses priced at USD 4750, USD 5250, and USD 8750 respectively.
10. Is the market size provided in terms of value or volume?
The market size is provided in terms of value, measured in Million and volume, measured in K Unit.
11. Are there any specific market keywords associated with the report?
Yes, the market keyword associated with the report is "Chondroitin Sulfate Market," which aids in identifying and referencing the specific market segment covered.
12. How do I determine which pricing option suits my needs best?
The pricing options vary based on user requirements and access needs. Individual users may opt for single-user licenses, while businesses requiring broader access may choose multi-user or enterprise licenses for cost-effective access to the report.
13. Are there any additional resources or data provided in the Chondroitin Sulfate Market report?
While the report offers comprehensive insights, it's advisable to review the specific contents or supplementary materials provided to ascertain if additional resources or data are available.
14. How can I stay updated on further developments or reports in the Chondroitin Sulfate Market?
To stay informed about further developments, trends, and reports in the Chondroitin Sulfate Market, consider subscribing to industry newsletters, following relevant companies and organizations, or regularly checking reputable industry news sources and publications.
Methodology
Step 1 - Identification of Relevant Samples Size from Population Database


Step 2 - Approaches for Defining Global Market Size (Value, Volume* & Price*)

Note*: In applicable scenarios
Step 3 - Data Sources
Primary Research
- Web Analytics
- Survey Reports
- Research Institute
- Latest Research Reports
- Opinion Leaders
Secondary Research
- Annual Reports
- White Paper
- Latest Press Release
- Industry Association
- Paid Database
- Investor Presentations

Step 4 - Data Triangulation
Involves using different sources of information in order to increase the validity of a study
These sources are likely to be stakeholders in a program - participants, other researchers, program staff, other community members, and so on.
Then we put all data in single framework & apply various statistical tools to find out the dynamic on the market.
During the analysis stage, feedback from the stakeholder groups would be compared to determine areas of agreement as well as areas of divergence


