
Key Insights
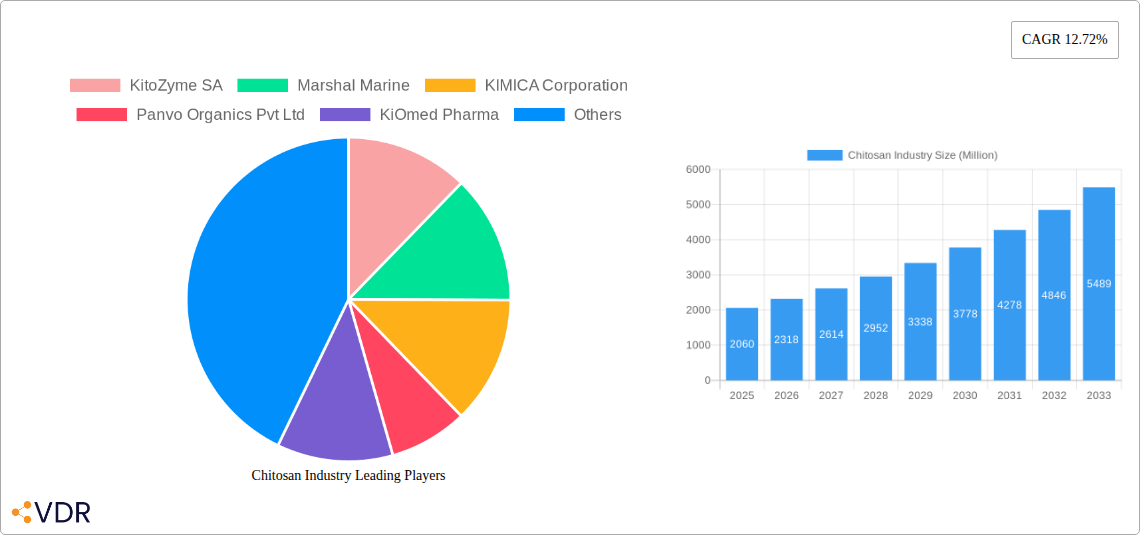
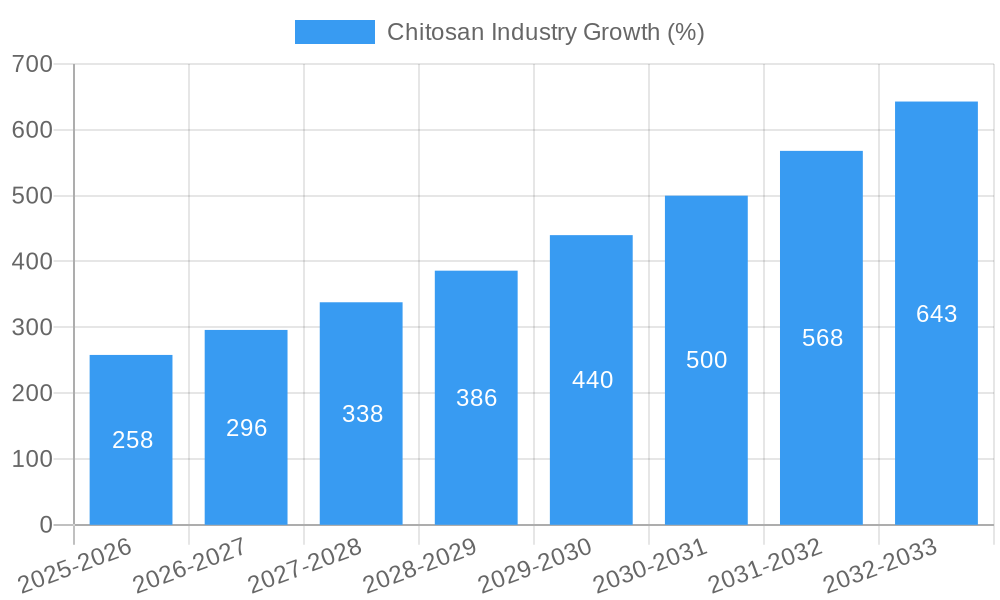
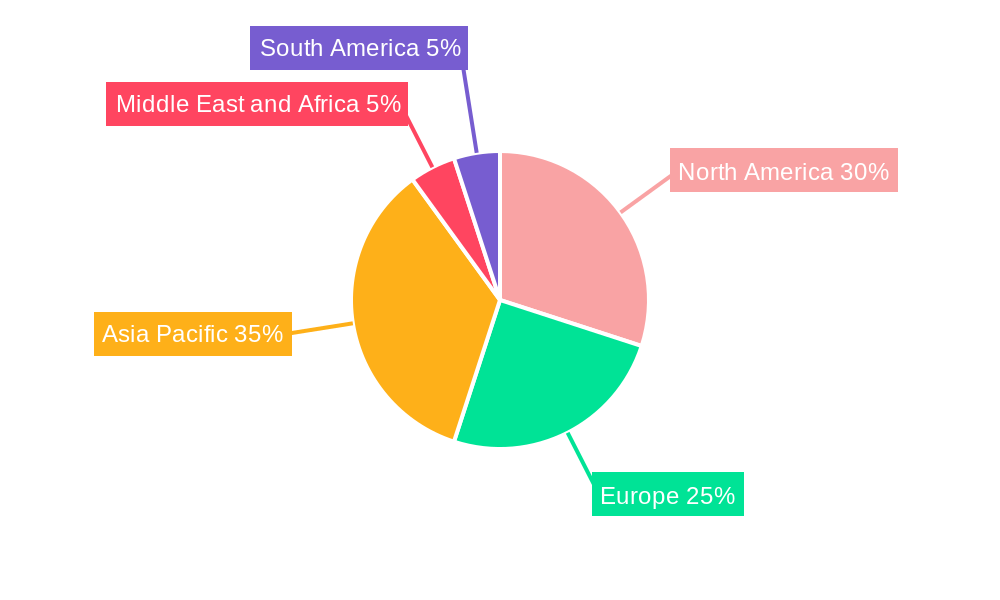
The global chitosan market, valued at $2.06 billion in 2025, is projected to experience robust growth, driven by increasing demand across diverse applications. A compound annual growth rate (CAGR) of 12.72% from 2025 to 2033 indicates a significant expansion potential. Key application segments, such as water treatment (leveraging chitosan's biodegradability and flocculation properties), cosmetics (for its film-forming and moisturizing capabilities), and pharmaceuticals and biomedical (owing to its biocompatibility and wound-healing properties), are major contributors to market growth. The food and beverage industry also utilizes chitosan as a natural preservative and thickening agent, further fueling market expansion. Shrimp, prawns, and crabs remain the dominant sources of chitosan, although research into alternative, more sustainable sources is ongoing. Geographic analysis reveals strong market presence in North America and Europe, driven by established industries and regulatory frameworks. However, the Asia-Pacific region, particularly China and India, is expected to witness the most significant growth due to burgeoning industries and increasing consumer awareness of natural and sustainable products. Competitive landscape analysis indicates a mix of established players and emerging companies, fostering innovation and driving market evolution. Growth will continue to be shaped by factors like rising environmental concerns leading to demand for sustainable solutions in water treatment, increasing health consciousness driving the demand for natural ingredients in cosmetics and pharmaceuticals, and the ongoing research and development efforts towards discovering new applications and improving production efficiency.
The market's expansion is also being influenced by several factors. Technological advancements in chitosan extraction and processing are enhancing product quality and reducing production costs, making it more competitive with synthetic alternatives. Stringent government regulations related to water pollution and the growing preference for natural and eco-friendly products are also acting as significant drivers. However, challenges such as price volatility of raw materials and the potential for inconsistent product quality due to variations in the sourcing and processing of chitosan may constrain market growth. Nevertheless, ongoing innovations in chitosan modifications and the exploration of its versatile applications across various industries suggest a positive and sustained growth trajectory for the foreseeable future. The market's future prospects depend heavily on the continuous research and development efforts, especially focusing on cost-effective production methods and exploration of new applications in emerging sectors.
Chitosan Industry Market Report: 2019-2033
This comprehensive report provides a detailed analysis of the Chitosan industry, encompassing market dynamics, growth trends, regional dominance, product landscape, key players, and future outlook. The study period covers 2019-2033, with 2025 as the base and estimated year. This report is crucial for businesses, investors, and researchers seeking in-depth insights into this rapidly evolving market. The report analyzes the parent market (Biomaterials) and child markets (Water Treatment, Cosmetics, Pharmaceuticals, Food & Beverage) to offer a complete understanding of market segmentation and growth drivers.
Keywords: Chitosan market, Chitosan industry, Chitosan applications, Chitosan production, Chitosan market size, Chitosan market share, Chitosan price, Chitosan trends, Chitosan forecast, Chitosan suppliers, Shrimp chitosan, Crab chitosan, Water treatment chitosan, Cosmetic chitosan, Pharmaceutical chitosan, Food chitosan, KitoZyme, Marshal Marine, KIMICA, Panvo Organics, KiOmed Pharma, Meron Biopolymers, ChitoTech, Qingdao Yunzhou, Austanz Chitin, BIO21, Dainichiseika, Heppe Medical Chitosan.
Chitosan Industry Market Dynamics & Structure
The Chitosan market is characterized by moderate concentration, with a few key players holding significant market share. Technological innovation, particularly in extraction and purification methods, is a major driver of growth. Stringent regulatory frameworks concerning food safety and biomedical applications significantly influence market dynamics. Competitive pressure from synthetic alternatives exists, although Chitosan's biodegradability and biocompatibility provide a competitive edge. End-user demographics are expanding as applications diversify across various sectors. Mergers and acquisitions are relatively infrequent, indicating a relatively stable competitive landscape.
- Market Concentration: Moderately concentrated, with the top 5 players accounting for approximately xx% of the global market in 2025.
- Technological Innovation: Focus on improving extraction yields, enhancing purity, and developing novel applications drives innovation.
- Regulatory Landscape: Stringent regulations, particularly in pharmaceutical and food applications, pose both a challenge and an opportunity for standardization and quality control.
- Competitive Substitutes: Synthetic polymers pose a competitive threat, although Chitosan's biodegradability offers a significant advantage.
- M&A Activity: Low to moderate M&A activity observed during the historical period (2019-2024), with an estimated xx deals annually.
Chitosan Industry Growth Trends & Insights
The global Chitosan market exhibited steady growth during the historical period (2019-2024), driven by increasing demand across diverse applications. The market is expected to maintain a robust Compound Annual Growth Rate (CAGR) of xx% during the forecast period (2025-2033), reaching a value of xx Million by 2033. This growth is fueled by rising consumer awareness of natural and sustainable materials, increasing demand for biocompatible materials in the pharmaceutical and biomedical sectors, and expanding applications in water treatment. Technological advancements such as improved extraction techniques and the development of new chitosan derivatives are also contributing to the market's expansion. Market penetration in emerging economies is also expected to increase significantly, adding to the overall growth.
Dominant Regions, Countries, or Segments in Chitosan Industry
The Asia-Pacific region is currently the dominant market for Chitosan, driven by substantial production capacity, particularly in China. North America and Europe also hold significant market shares. Within the application segments, the Pharmaceutical and Biomedical sector demonstrates the highest growth rate and market value, followed by the Water Treatment segment. By Source, Shrimps and Crabs are the leading sources, although increasing demand is pushing for diversification from other sustainable sources.
- Key Drivers (Asia-Pacific): Large-scale shrimp and crab processing industries, supportive government policies promoting the development of bio-based materials, and substantial investments in R&D.
- Key Drivers (North America): Strong demand from the pharmaceutical and biomedical industries, coupled with increasing awareness of sustainable alternatives.
- Key Drivers (Europe): Stringent environmental regulations supporting the adoption of eco-friendly water treatment solutions, as well as rising consumer demand for natural cosmetics.
- Dominant Segment (Application): Pharmaceutical and Biomedical (xx Million in 2025)
- Dominant Segment (Source): Shrimps (xx Million in 2025)
Chitosan Industry Product Landscape
The Chitosan product landscape is characterized by a diverse range of grades and derivatives tailored for specific applications. Innovations focus on improving solubility, enhancing bioactivity, and developing specialized formulations for targeted use. These innovations cater to specific requirements in water purification, drug delivery, wound healing, and cosmetic applications. Unique selling propositions often include high purity, biodegradability, biocompatibility, and improved functionality. Technological advancements are focused on improving extraction techniques, modifying the molecular weight, and producing novel derivatives with enhanced performance characteristics.
Key Drivers, Barriers & Challenges in Chitosan Industry
Key Drivers: Growing demand for bio-based materials, increasing focus on sustainability, and expansion of applications across various industries (especially in water treatment and pharmaceuticals). The rising awareness of the health benefits of chitosan in various applications, especially in the food and healthcare industry, is significantly contributing to the market's expansion.
Challenges: Fluctuations in raw material prices (shrimp, crab shells), limited availability of high-quality raw materials, and stringent regulatory requirements particularly in the pharmaceutical and food and beverage sector can slow down market growth.
Emerging Opportunities in Chitosan Industry
Emerging opportunities lie in expanding applications within the agricultural sector (e.g., biopesticides, biostimulants), developing advanced drug delivery systems, and exploring new markets in developing countries. The exploration of new sources of chitosan from sustainable and waste-based materials is also presenting promising opportunities.
Growth Accelerators in the Chitosan Industry
Strategic partnerships and collaborations between researchers, producers, and end-users are key accelerators. Technological breakthroughs in extraction and modification techniques will further unlock the potential of Chitosan. Expansion into new markets, particularly in developing countries with growing demand for bio-based materials, is also a key driver for long-term growth.
Key Players Shaping the Chitosan Industry Market
- KitoZyme SA
- Marshal Marine
- KIMICA Corporation
- Panvo Organics Pvt Ltd
- KiOmed Pharma
- Meron Biopolymers
- ChitoTech
- Qingdao Yunzhou
- Austanz Chitin Pty Ltd
- BIO21 Co Ltd
- Dainichiseika Color & Chemicals Mfg Co Ltd
- Heppe Medical Chitosan GmbH
Notable Milestones in Chitosan Industry Sector
- 2021: KitoZyme SA launches a new line of high-purity Chitosan for pharmaceutical applications.
- 2022: A significant investment in Chitosan production capacity is announced in China.
- 2023: Several key players announce strategic partnerships focused on research and development of novel Chitosan derivatives.
In-Depth Chitosan Industry Market Outlook
The Chitosan market is poised for significant growth driven by technological advancements and expanding applications. The future outlook is positive, with opportunities for innovation, market expansion, and strategic collaborations. Continued research and development, focusing on sustainable sourcing and novel applications, will further propel market growth throughout the forecast period. The increasing focus on sustainability and the need for bio-based materials are key drivers for the future growth of this industry.
Chitosan Industry Segmentation
-
1. Source
- 1.1. Shrimps
- 1.2. Prawns
- 1.3. Crabs
- 1.4. Other Sources
-
2. Application
- 2.1. Water treatment
- 2.2. Cosmetics
- 2.3. Pharmaceutical and Biomedical
- 2.4. Food and Beverage
- 2.5. Other Applications
Chitosan Industry Segmentation By Geography
-
1. North America
- 1.1. United States
- 1.2. Canada
- 1.3. Mexico
-
2. Europe
- 2.1. Germany
- 2.2. United Kingdom
- 2.3. France
- 2.4. Italy
- 2.5. Spain
- 2.6. Rest of Europe
-
3. Asia Pacific
- 3.1. China
- 3.2. Japan
- 3.3. India
- 3.4. Australia
- 3.5. South Korea
- 3.6. Rest of Asia Pacific
-
4. Middle East and Africa
- 4.1. GCC
- 4.2. South Africa
- 4.3. Rest of Middle East and Africa
-
5. South America
- 5.1. Brazil
- 5.2. Argentina
- 5.3. Rest of South America
Chitosan Industry REPORT HIGHLIGHTS
| Aspects | Details |
|---|---|
| Study Period | 2019-2033 |
| Base Year | 2024 |
| Estimated Year | 2025 |
| Forecast Period | 2025-2033 |
| Historical Period | 2019-2024 |
| Growth Rate | CAGR of 12.72% from 2019-2033 |
| Segmentation |
|
Table of Contents
- 1. Introduction
- 1.1. Research Scope
- 1.2. Market Segmentation
- 1.3. Research Methodology
- 1.4. Definitions and Assumptions
- 2. Executive Summary
- 2.1. Introduction
- 3. Market Dynamics
- 3.1. Introduction
- 3.2. Market Drivers
- 3.2.1 Rising Water Treatment Activities; Growing Product Application in the Biomedical
- 3.2.2 Cosmetics
- 3.2.3 and Food and Beverage Industries; Strong Advancements in the Healthcare/Medical Industry
- 3.3. Market Restrains
- 3.3.1. Regulatory Framework
- 3.4. Market Trends
- 3.4.1 Under Application
- 3.4.2 Water Treatment is Expected to Witness a Healthy Growth Rate Over the Forecast Period
- 4. Market Factor Analysis
- 4.1. Porters Five Forces
- 4.2. Supply/Value Chain
- 4.3. PESTEL analysis
- 4.4. Market Entropy
- 4.5. Patent/Trademark Analysis
- 5. Global Chitosan Industry Analysis, Insights and Forecast, 2019-2031
- 5.1. Market Analysis, Insights and Forecast - by Source
- 5.1.1. Shrimps
- 5.1.2. Prawns
- 5.1.3. Crabs
- 5.1.4. Other Sources
- 5.2. Market Analysis, Insights and Forecast - by Application
- 5.2.1. Water treatment
- 5.2.2. Cosmetics
- 5.2.3. Pharmaceutical and Biomedical
- 5.2.4. Food and Beverage
- 5.2.5. Other Applications
- 5.3. Market Analysis, Insights and Forecast - by Region
- 5.3.1. North America
- 5.3.2. Europe
- 5.3.3. Asia Pacific
- 5.3.4. Middle East and Africa
- 5.3.5. South America
- 5.1. Market Analysis, Insights and Forecast - by Source
- 6. North America Chitosan Industry Analysis, Insights and Forecast, 2019-2031
- 6.1. Market Analysis, Insights and Forecast - by Source
- 6.1.1. Shrimps
- 6.1.2. Prawns
- 6.1.3. Crabs
- 6.1.4. Other Sources
- 6.2. Market Analysis, Insights and Forecast - by Application
- 6.2.1. Water treatment
- 6.2.2. Cosmetics
- 6.2.3. Pharmaceutical and Biomedical
- 6.2.4. Food and Beverage
- 6.2.5. Other Applications
- 6.1. Market Analysis, Insights and Forecast - by Source
- 7. Europe Chitosan Industry Analysis, Insights and Forecast, 2019-2031
- 7.1. Market Analysis, Insights and Forecast - by Source
- 7.1.1. Shrimps
- 7.1.2. Prawns
- 7.1.3. Crabs
- 7.1.4. Other Sources
- 7.2. Market Analysis, Insights and Forecast - by Application
- 7.2.1. Water treatment
- 7.2.2. Cosmetics
- 7.2.3. Pharmaceutical and Biomedical
- 7.2.4. Food and Beverage
- 7.2.5. Other Applications
- 7.1. Market Analysis, Insights and Forecast - by Source
- 8. Asia Pacific Chitosan Industry Analysis, Insights and Forecast, 2019-2031
- 8.1. Market Analysis, Insights and Forecast - by Source
- 8.1.1. Shrimps
- 8.1.2. Prawns
- 8.1.3. Crabs
- 8.1.4. Other Sources
- 8.2. Market Analysis, Insights and Forecast - by Application
- 8.2.1. Water treatment
- 8.2.2. Cosmetics
- 8.2.3. Pharmaceutical and Biomedical
- 8.2.4. Food and Beverage
- 8.2.5. Other Applications
- 8.1. Market Analysis, Insights and Forecast - by Source
- 9. Middle East and Africa Chitosan Industry Analysis, Insights and Forecast, 2019-2031
- 9.1. Market Analysis, Insights and Forecast - by Source
- 9.1.1. Shrimps
- 9.1.2. Prawns
- 9.1.3. Crabs
- 9.1.4. Other Sources
- 9.2. Market Analysis, Insights and Forecast - by Application
- 9.2.1. Water treatment
- 9.2.2. Cosmetics
- 9.2.3. Pharmaceutical and Biomedical
- 9.2.4. Food and Beverage
- 9.2.5. Other Applications
- 9.1. Market Analysis, Insights and Forecast - by Source
- 10. South America Chitosan Industry Analysis, Insights and Forecast, 2019-2031
- 10.1. Market Analysis, Insights and Forecast - by Source
- 10.1.1. Shrimps
- 10.1.2. Prawns
- 10.1.3. Crabs
- 10.1.4. Other Sources
- 10.2. Market Analysis, Insights and Forecast - by Application
- 10.2.1. Water treatment
- 10.2.2. Cosmetics
- 10.2.3. Pharmaceutical and Biomedical
- 10.2.4. Food and Beverage
- 10.2.5. Other Applications
- 10.1. Market Analysis, Insights and Forecast - by Source
- 11. North America Chitosan Industry Analysis, Insights and Forecast, 2019-2031
- 11.1. Market Analysis, Insights and Forecast - By Country/Sub-region
- 11.1.1 United States
- 11.1.2 Canada
- 11.1.3 Mexico
- 12. Europe Chitosan Industry Analysis, Insights and Forecast, 2019-2031
- 12.1. Market Analysis, Insights and Forecast - By Country/Sub-region
- 12.1.1 Germany
- 12.1.2 United Kingdom
- 12.1.3 France
- 12.1.4 Italy
- 12.1.5 Spain
- 12.1.6 Rest of Europe
- 13. Asia Pacific Chitosan Industry Analysis, Insights and Forecast, 2019-2031
- 13.1. Market Analysis, Insights and Forecast - By Country/Sub-region
- 13.1.1 China
- 13.1.2 Japan
- 13.1.3 India
- 13.1.4 Australia
- 13.1.5 South Korea
- 13.1.6 Rest of Asia Pacific
- 14. Middle East and Africa Chitosan Industry Analysis, Insights and Forecast, 2019-2031
- 14.1. Market Analysis, Insights and Forecast - By Country/Sub-region
- 14.1.1 GCC
- 14.1.2 South Africa
- 14.1.3 Rest of Middle East and Africa
- 15. South America Chitosan Industry Analysis, Insights and Forecast, 2019-2031
- 15.1. Market Analysis, Insights and Forecast - By Country/Sub-region
- 15.1.1 Brazil
- 15.1.2 Argentina
- 15.1.3 Rest of South America
- 16. Competitive Analysis
- 16.1. Global Market Share Analysis 2024
- 16.2. Company Profiles
- 16.2.1 KitoZyme SA
- 16.2.1.1. Overview
- 16.2.1.2. Products
- 16.2.1.3. SWOT Analysis
- 16.2.1.4. Recent Developments
- 16.2.1.5. Financials (Based on Availability)
- 16.2.2 Marshal Marine
- 16.2.2.1. Overview
- 16.2.2.2. Products
- 16.2.2.3. SWOT Analysis
- 16.2.2.4. Recent Developments
- 16.2.2.5. Financials (Based on Availability)
- 16.2.3 KIMICA Corporation
- 16.2.3.1. Overview
- 16.2.3.2. Products
- 16.2.3.3. SWOT Analysis
- 16.2.3.4. Recent Developments
- 16.2.3.5. Financials (Based on Availability)
- 16.2.4 Panvo Organics Pvt Ltd
- 16.2.4.1. Overview
- 16.2.4.2. Products
- 16.2.4.3. SWOT Analysis
- 16.2.4.4. Recent Developments
- 16.2.4.5. Financials (Based on Availability)
- 16.2.5 KiOmed Pharma
- 16.2.5.1. Overview
- 16.2.5.2. Products
- 16.2.5.3. SWOT Analysis
- 16.2.5.4. Recent Developments
- 16.2.5.5. Financials (Based on Availability)
- 16.2.6 Meron Biopolymers
- 16.2.6.1. Overview
- 16.2.6.2. Products
- 16.2.6.3. SWOT Analysis
- 16.2.6.4. Recent Developments
- 16.2.6.5. Financials (Based on Availability)
- 16.2.7 ChitoTech
- 16.2.7.1. Overview
- 16.2.7.2. Products
- 16.2.7.3. SWOT Analysis
- 16.2.7.4. Recent Developments
- 16.2.7.5. Financials (Based on Availability)
- 16.2.8 Qingdao Yunzhou
- 16.2.8.1. Overview
- 16.2.8.2. Products
- 16.2.8.3. SWOT Analysis
- 16.2.8.4. Recent Developments
- 16.2.8.5. Financials (Based on Availability)
- 16.2.9 Austanz Chitin Pty Ltd
- 16.2.9.1. Overview
- 16.2.9.2. Products
- 16.2.9.3. SWOT Analysis
- 16.2.9.4. Recent Developments
- 16.2.9.5. Financials (Based on Availability)
- 16.2.10 BIO21 Co Ltd
- 16.2.10.1. Overview
- 16.2.10.2. Products
- 16.2.10.3. SWOT Analysis
- 16.2.10.4. Recent Developments
- 16.2.10.5. Financials (Based on Availability)
- 16.2.11 Dainichiseika Color & Chemicals Mfg Co Ltd
- 16.2.11.1. Overview
- 16.2.11.2. Products
- 16.2.11.3. SWOT Analysis
- 16.2.11.4. Recent Developments
- 16.2.11.5. Financials (Based on Availability)
- 16.2.12 Heppe Medical Chitosan GmbH
- 16.2.12.1. Overview
- 16.2.12.2. Products
- 16.2.12.3. SWOT Analysis
- 16.2.12.4. Recent Developments
- 16.2.12.5. Financials (Based on Availability)
- 16.2.1 KitoZyme SA
List of Figures
- Figure 1: Global Chitosan Industry Revenue Breakdown (Million, %) by Region 2024 & 2032
- Figure 2: Global Chitosan Industry Volume Breakdown (K Unit, %) by Region 2024 & 2032
- Figure 3: North America Chitosan Industry Revenue (Million), by Country 2024 & 2032
- Figure 4: North America Chitosan Industry Volume (K Unit), by Country 2024 & 2032
- Figure 5: North America Chitosan Industry Revenue Share (%), by Country 2024 & 2032
- Figure 6: North America Chitosan Industry Volume Share (%), by Country 2024 & 2032
- Figure 7: Europe Chitosan Industry Revenue (Million), by Country 2024 & 2032
- Figure 8: Europe Chitosan Industry Volume (K Unit), by Country 2024 & 2032
- Figure 9: Europe Chitosan Industry Revenue Share (%), by Country 2024 & 2032
- Figure 10: Europe Chitosan Industry Volume Share (%), by Country 2024 & 2032
- Figure 11: Asia Pacific Chitosan Industry Revenue (Million), by Country 2024 & 2032
- Figure 12: Asia Pacific Chitosan Industry Volume (K Unit), by Country 2024 & 2032
- Figure 13: Asia Pacific Chitosan Industry Revenue Share (%), by Country 2024 & 2032
- Figure 14: Asia Pacific Chitosan Industry Volume Share (%), by Country 2024 & 2032
- Figure 15: Middle East and Africa Chitosan Industry Revenue (Million), by Country 2024 & 2032
- Figure 16: Middle East and Africa Chitosan Industry Volume (K Unit), by Country 2024 & 2032
- Figure 17: Middle East and Africa Chitosan Industry Revenue Share (%), by Country 2024 & 2032
- Figure 18: Middle East and Africa Chitosan Industry Volume Share (%), by Country 2024 & 2032
- Figure 19: South America Chitosan Industry Revenue (Million), by Country 2024 & 2032
- Figure 20: South America Chitosan Industry Volume (K Unit), by Country 2024 & 2032
- Figure 21: South America Chitosan Industry Revenue Share (%), by Country 2024 & 2032
- Figure 22: South America Chitosan Industry Volume Share (%), by Country 2024 & 2032
- Figure 23: North America Chitosan Industry Revenue (Million), by Source 2024 & 2032
- Figure 24: North America Chitosan Industry Volume (K Unit), by Source 2024 & 2032
- Figure 25: North America Chitosan Industry Revenue Share (%), by Source 2024 & 2032
- Figure 26: North America Chitosan Industry Volume Share (%), by Source 2024 & 2032
- Figure 27: North America Chitosan Industry Revenue (Million), by Application 2024 & 2032
- Figure 28: North America Chitosan Industry Volume (K Unit), by Application 2024 & 2032
- Figure 29: North America Chitosan Industry Revenue Share (%), by Application 2024 & 2032
- Figure 30: North America Chitosan Industry Volume Share (%), by Application 2024 & 2032
- Figure 31: North America Chitosan Industry Revenue (Million), by Country 2024 & 2032
- Figure 32: North America Chitosan Industry Volume (K Unit), by Country 2024 & 2032
- Figure 33: North America Chitosan Industry Revenue Share (%), by Country 2024 & 2032
- Figure 34: North America Chitosan Industry Volume Share (%), by Country 2024 & 2032
- Figure 35: Europe Chitosan Industry Revenue (Million), by Source 2024 & 2032
- Figure 36: Europe Chitosan Industry Volume (K Unit), by Source 2024 & 2032
- Figure 37: Europe Chitosan Industry Revenue Share (%), by Source 2024 & 2032
- Figure 38: Europe Chitosan Industry Volume Share (%), by Source 2024 & 2032
- Figure 39: Europe Chitosan Industry Revenue (Million), by Application 2024 & 2032
- Figure 40: Europe Chitosan Industry Volume (K Unit), by Application 2024 & 2032
- Figure 41: Europe Chitosan Industry Revenue Share (%), by Application 2024 & 2032
- Figure 42: Europe Chitosan Industry Volume Share (%), by Application 2024 & 2032
- Figure 43: Europe Chitosan Industry Revenue (Million), by Country 2024 & 2032
- Figure 44: Europe Chitosan Industry Volume (K Unit), by Country 2024 & 2032
- Figure 45: Europe Chitosan Industry Revenue Share (%), by Country 2024 & 2032
- Figure 46: Europe Chitosan Industry Volume Share (%), by Country 2024 & 2032
- Figure 47: Asia Pacific Chitosan Industry Revenue (Million), by Source 2024 & 2032
- Figure 48: Asia Pacific Chitosan Industry Volume (K Unit), by Source 2024 & 2032
- Figure 49: Asia Pacific Chitosan Industry Revenue Share (%), by Source 2024 & 2032
- Figure 50: Asia Pacific Chitosan Industry Volume Share (%), by Source 2024 & 2032
- Figure 51: Asia Pacific Chitosan Industry Revenue (Million), by Application 2024 & 2032
- Figure 52: Asia Pacific Chitosan Industry Volume (K Unit), by Application 2024 & 2032
- Figure 53: Asia Pacific Chitosan Industry Revenue Share (%), by Application 2024 & 2032
- Figure 54: Asia Pacific Chitosan Industry Volume Share (%), by Application 2024 & 2032
- Figure 55: Asia Pacific Chitosan Industry Revenue (Million), by Country 2024 & 2032
- Figure 56: Asia Pacific Chitosan Industry Volume (K Unit), by Country 2024 & 2032
- Figure 57: Asia Pacific Chitosan Industry Revenue Share (%), by Country 2024 & 2032
- Figure 58: Asia Pacific Chitosan Industry Volume Share (%), by Country 2024 & 2032
- Figure 59: Middle East and Africa Chitosan Industry Revenue (Million), by Source 2024 & 2032
- Figure 60: Middle East and Africa Chitosan Industry Volume (K Unit), by Source 2024 & 2032
- Figure 61: Middle East and Africa Chitosan Industry Revenue Share (%), by Source 2024 & 2032
- Figure 62: Middle East and Africa Chitosan Industry Volume Share (%), by Source 2024 & 2032
- Figure 63: Middle East and Africa Chitosan Industry Revenue (Million), by Application 2024 & 2032
- Figure 64: Middle East and Africa Chitosan Industry Volume (K Unit), by Application 2024 & 2032
- Figure 65: Middle East and Africa Chitosan Industry Revenue Share (%), by Application 2024 & 2032
- Figure 66: Middle East and Africa Chitosan Industry Volume Share (%), by Application 2024 & 2032
- Figure 67: Middle East and Africa Chitosan Industry Revenue (Million), by Country 2024 & 2032
- Figure 68: Middle East and Africa Chitosan Industry Volume (K Unit), by Country 2024 & 2032
- Figure 69: Middle East and Africa Chitosan Industry Revenue Share (%), by Country 2024 & 2032
- Figure 70: Middle East and Africa Chitosan Industry Volume Share (%), by Country 2024 & 2032
- Figure 71: South America Chitosan Industry Revenue (Million), by Source 2024 & 2032
- Figure 72: South America Chitosan Industry Volume (K Unit), by Source 2024 & 2032
- Figure 73: South America Chitosan Industry Revenue Share (%), by Source 2024 & 2032
- Figure 74: South America Chitosan Industry Volume Share (%), by Source 2024 & 2032
- Figure 75: South America Chitosan Industry Revenue (Million), by Application 2024 & 2032
- Figure 76: South America Chitosan Industry Volume (K Unit), by Application 2024 & 2032
- Figure 77: South America Chitosan Industry Revenue Share (%), by Application 2024 & 2032
- Figure 78: South America Chitosan Industry Volume Share (%), by Application 2024 & 2032
- Figure 79: South America Chitosan Industry Revenue (Million), by Country 2024 & 2032
- Figure 80: South America Chitosan Industry Volume (K Unit), by Country 2024 & 2032
- Figure 81: South America Chitosan Industry Revenue Share (%), by Country 2024 & 2032
- Figure 82: South America Chitosan Industry Volume Share (%), by Country 2024 & 2032
List of Tables
- Table 1: Global Chitosan Industry Revenue Million Forecast, by Region 2019 & 2032
- Table 2: Global Chitosan Industry Volume K Unit Forecast, by Region 2019 & 2032
- Table 3: Global Chitosan Industry Revenue Million Forecast, by Source 2019 & 2032
- Table 4: Global Chitosan Industry Volume K Unit Forecast, by Source 2019 & 2032
- Table 5: Global Chitosan Industry Revenue Million Forecast, by Application 2019 & 2032
- Table 6: Global Chitosan Industry Volume K Unit Forecast, by Application 2019 & 2032
- Table 7: Global Chitosan Industry Revenue Million Forecast, by Region 2019 & 2032
- Table 8: Global Chitosan Industry Volume K Unit Forecast, by Region 2019 & 2032
- Table 9: Global Chitosan Industry Revenue Million Forecast, by Country 2019 & 2032
- Table 10: Global Chitosan Industry Volume K Unit Forecast, by Country 2019 & 2032
- Table 11: United States Chitosan Industry Revenue (Million) Forecast, by Application 2019 & 2032
- Table 12: United States Chitosan Industry Volume (K Unit) Forecast, by Application 2019 & 2032
- Table 13: Canada Chitosan Industry Revenue (Million) Forecast, by Application 2019 & 2032
- Table 14: Canada Chitosan Industry Volume (K Unit) Forecast, by Application 2019 & 2032
- Table 15: Mexico Chitosan Industry Revenue (Million) Forecast, by Application 2019 & 2032
- Table 16: Mexico Chitosan Industry Volume (K Unit) Forecast, by Application 2019 & 2032
- Table 17: Global Chitosan Industry Revenue Million Forecast, by Country 2019 & 2032
- Table 18: Global Chitosan Industry Volume K Unit Forecast, by Country 2019 & 2032
- Table 19: Germany Chitosan Industry Revenue (Million) Forecast, by Application 2019 & 2032
- Table 20: Germany Chitosan Industry Volume (K Unit) Forecast, by Application 2019 & 2032
- Table 21: United Kingdom Chitosan Industry Revenue (Million) Forecast, by Application 2019 & 2032
- Table 22: United Kingdom Chitosan Industry Volume (K Unit) Forecast, by Application 2019 & 2032
- Table 23: France Chitosan Industry Revenue (Million) Forecast, by Application 2019 & 2032
- Table 24: France Chitosan Industry Volume (K Unit) Forecast, by Application 2019 & 2032
- Table 25: Italy Chitosan Industry Revenue (Million) Forecast, by Application 2019 & 2032
- Table 26: Italy Chitosan Industry Volume (K Unit) Forecast, by Application 2019 & 2032
- Table 27: Spain Chitosan Industry Revenue (Million) Forecast, by Application 2019 & 2032
- Table 28: Spain Chitosan Industry Volume (K Unit) Forecast, by Application 2019 & 2032
- Table 29: Rest of Europe Chitosan Industry Revenue (Million) Forecast, by Application 2019 & 2032
- Table 30: Rest of Europe Chitosan Industry Volume (K Unit) Forecast, by Application 2019 & 2032
- Table 31: Global Chitosan Industry Revenue Million Forecast, by Country 2019 & 2032
- Table 32: Global Chitosan Industry Volume K Unit Forecast, by Country 2019 & 2032
- Table 33: China Chitosan Industry Revenue (Million) Forecast, by Application 2019 & 2032
- Table 34: China Chitosan Industry Volume (K Unit) Forecast, by Application 2019 & 2032
- Table 35: Japan Chitosan Industry Revenue (Million) Forecast, by Application 2019 & 2032
- Table 36: Japan Chitosan Industry Volume (K Unit) Forecast, by Application 2019 & 2032
- Table 37: India Chitosan Industry Revenue (Million) Forecast, by Application 2019 & 2032
- Table 38: India Chitosan Industry Volume (K Unit) Forecast, by Application 2019 & 2032
- Table 39: Australia Chitosan Industry Revenue (Million) Forecast, by Application 2019 & 2032
- Table 40: Australia Chitosan Industry Volume (K Unit) Forecast, by Application 2019 & 2032
- Table 41: South Korea Chitosan Industry Revenue (Million) Forecast, by Application 2019 & 2032
- Table 42: South Korea Chitosan Industry Volume (K Unit) Forecast, by Application 2019 & 2032
- Table 43: Rest of Asia Pacific Chitosan Industry Revenue (Million) Forecast, by Application 2019 & 2032
- Table 44: Rest of Asia Pacific Chitosan Industry Volume (K Unit) Forecast, by Application 2019 & 2032
- Table 45: Global Chitosan Industry Revenue Million Forecast, by Country 2019 & 2032
- Table 46: Global Chitosan Industry Volume K Unit Forecast, by Country 2019 & 2032
- Table 47: GCC Chitosan Industry Revenue (Million) Forecast, by Application 2019 & 2032
- Table 48: GCC Chitosan Industry Volume (K Unit) Forecast, by Application 2019 & 2032
- Table 49: South Africa Chitosan Industry Revenue (Million) Forecast, by Application 2019 & 2032
- Table 50: South Africa Chitosan Industry Volume (K Unit) Forecast, by Application 2019 & 2032
- Table 51: Rest of Middle East and Africa Chitosan Industry Revenue (Million) Forecast, by Application 2019 & 2032
- Table 52: Rest of Middle East and Africa Chitosan Industry Volume (K Unit) Forecast, by Application 2019 & 2032
- Table 53: Global Chitosan Industry Revenue Million Forecast, by Country 2019 & 2032
- Table 54: Global Chitosan Industry Volume K Unit Forecast, by Country 2019 & 2032
- Table 55: Brazil Chitosan Industry Revenue (Million) Forecast, by Application 2019 & 2032
- Table 56: Brazil Chitosan Industry Volume (K Unit) Forecast, by Application 2019 & 2032
- Table 57: Argentina Chitosan Industry Revenue (Million) Forecast, by Application 2019 & 2032
- Table 58: Argentina Chitosan Industry Volume (K Unit) Forecast, by Application 2019 & 2032
- Table 59: Rest of South America Chitosan Industry Revenue (Million) Forecast, by Application 2019 & 2032
- Table 60: Rest of South America Chitosan Industry Volume (K Unit) Forecast, by Application 2019 & 2032
- Table 61: Global Chitosan Industry Revenue Million Forecast, by Source 2019 & 2032
- Table 62: Global Chitosan Industry Volume K Unit Forecast, by Source 2019 & 2032
- Table 63: Global Chitosan Industry Revenue Million Forecast, by Application 2019 & 2032
- Table 64: Global Chitosan Industry Volume K Unit Forecast, by Application 2019 & 2032
- Table 65: Global Chitosan Industry Revenue Million Forecast, by Country 2019 & 2032
- Table 66: Global Chitosan Industry Volume K Unit Forecast, by Country 2019 & 2032
- Table 67: United States Chitosan Industry Revenue (Million) Forecast, by Application 2019 & 2032
- Table 68: United States Chitosan Industry Volume (K Unit) Forecast, by Application 2019 & 2032
- Table 69: Canada Chitosan Industry Revenue (Million) Forecast, by Application 2019 & 2032
- Table 70: Canada Chitosan Industry Volume (K Unit) Forecast, by Application 2019 & 2032
- Table 71: Mexico Chitosan Industry Revenue (Million) Forecast, by Application 2019 & 2032
- Table 72: Mexico Chitosan Industry Volume (K Unit) Forecast, by Application 2019 & 2032
- Table 73: Global Chitosan Industry Revenue Million Forecast, by Source 2019 & 2032
- Table 74: Global Chitosan Industry Volume K Unit Forecast, by Source 2019 & 2032
- Table 75: Global Chitosan Industry Revenue Million Forecast, by Application 2019 & 2032
- Table 76: Global Chitosan Industry Volume K Unit Forecast, by Application 2019 & 2032
- Table 77: Global Chitosan Industry Revenue Million Forecast, by Country 2019 & 2032
- Table 78: Global Chitosan Industry Volume K Unit Forecast, by Country 2019 & 2032
- Table 79: Germany Chitosan Industry Revenue (Million) Forecast, by Application 2019 & 2032
- Table 80: Germany Chitosan Industry Volume (K Unit) Forecast, by Application 2019 & 2032
- Table 81: United Kingdom Chitosan Industry Revenue (Million) Forecast, by Application 2019 & 2032
- Table 82: United Kingdom Chitosan Industry Volume (K Unit) Forecast, by Application 2019 & 2032
- Table 83: France Chitosan Industry Revenue (Million) Forecast, by Application 2019 & 2032
- Table 84: France Chitosan Industry Volume (K Unit) Forecast, by Application 2019 & 2032
- Table 85: Italy Chitosan Industry Revenue (Million) Forecast, by Application 2019 & 2032
- Table 86: Italy Chitosan Industry Volume (K Unit) Forecast, by Application 2019 & 2032
- Table 87: Spain Chitosan Industry Revenue (Million) Forecast, by Application 2019 & 2032
- Table 88: Spain Chitosan Industry Volume (K Unit) Forecast, by Application 2019 & 2032
- Table 89: Rest of Europe Chitosan Industry Revenue (Million) Forecast, by Application 2019 & 2032
- Table 90: Rest of Europe Chitosan Industry Volume (K Unit) Forecast, by Application 2019 & 2032
- Table 91: Global Chitosan Industry Revenue Million Forecast, by Source 2019 & 2032
- Table 92: Global Chitosan Industry Volume K Unit Forecast, by Source 2019 & 2032
- Table 93: Global Chitosan Industry Revenue Million Forecast, by Application 2019 & 2032
- Table 94: Global Chitosan Industry Volume K Unit Forecast, by Application 2019 & 2032
- Table 95: Global Chitosan Industry Revenue Million Forecast, by Country 2019 & 2032
- Table 96: Global Chitosan Industry Volume K Unit Forecast, by Country 2019 & 2032
- Table 97: China Chitosan Industry Revenue (Million) Forecast, by Application 2019 & 2032
- Table 98: China Chitosan Industry Volume (K Unit) Forecast, by Application 2019 & 2032
- Table 99: Japan Chitosan Industry Revenue (Million) Forecast, by Application 2019 & 2032
- Table 100: Japan Chitosan Industry Volume (K Unit) Forecast, by Application 2019 & 2032
- Table 101: India Chitosan Industry Revenue (Million) Forecast, by Application 2019 & 2032
- Table 102: India Chitosan Industry Volume (K Unit) Forecast, by Application 2019 & 2032
- Table 103: Australia Chitosan Industry Revenue (Million) Forecast, by Application 2019 & 2032
- Table 104: Australia Chitosan Industry Volume (K Unit) Forecast, by Application 2019 & 2032
- Table 105: South Korea Chitosan Industry Revenue (Million) Forecast, by Application 2019 & 2032
- Table 106: South Korea Chitosan Industry Volume (K Unit) Forecast, by Application 2019 & 2032
- Table 107: Rest of Asia Pacific Chitosan Industry Revenue (Million) Forecast, by Application 2019 & 2032
- Table 108: Rest of Asia Pacific Chitosan Industry Volume (K Unit) Forecast, by Application 2019 & 2032
- Table 109: Global Chitosan Industry Revenue Million Forecast, by Source 2019 & 2032
- Table 110: Global Chitosan Industry Volume K Unit Forecast, by Source 2019 & 2032
- Table 111: Global Chitosan Industry Revenue Million Forecast, by Application 2019 & 2032
- Table 112: Global Chitosan Industry Volume K Unit Forecast, by Application 2019 & 2032
- Table 113: Global Chitosan Industry Revenue Million Forecast, by Country 2019 & 2032
- Table 114: Global Chitosan Industry Volume K Unit Forecast, by Country 2019 & 2032
- Table 115: GCC Chitosan Industry Revenue (Million) Forecast, by Application 2019 & 2032
- Table 116: GCC Chitosan Industry Volume (K Unit) Forecast, by Application 2019 & 2032
- Table 117: South Africa Chitosan Industry Revenue (Million) Forecast, by Application 2019 & 2032
- Table 118: South Africa Chitosan Industry Volume (K Unit) Forecast, by Application 2019 & 2032
- Table 119: Rest of Middle East and Africa Chitosan Industry Revenue (Million) Forecast, by Application 2019 & 2032
- Table 120: Rest of Middle East and Africa Chitosan Industry Volume (K Unit) Forecast, by Application 2019 & 2032
- Table 121: Global Chitosan Industry Revenue Million Forecast, by Source 2019 & 2032
- Table 122: Global Chitosan Industry Volume K Unit Forecast, by Source 2019 & 2032
- Table 123: Global Chitosan Industry Revenue Million Forecast, by Application 2019 & 2032
- Table 124: Global Chitosan Industry Volume K Unit Forecast, by Application 2019 & 2032
- Table 125: Global Chitosan Industry Revenue Million Forecast, by Country 2019 & 2032
- Table 126: Global Chitosan Industry Volume K Unit Forecast, by Country 2019 & 2032
- Table 127: Brazil Chitosan Industry Revenue (Million) Forecast, by Application 2019 & 2032
- Table 128: Brazil Chitosan Industry Volume (K Unit) Forecast, by Application 2019 & 2032
- Table 129: Argentina Chitosan Industry Revenue (Million) Forecast, by Application 2019 & 2032
- Table 130: Argentina Chitosan Industry Volume (K Unit) Forecast, by Application 2019 & 2032
- Table 131: Rest of South America Chitosan Industry Revenue (Million) Forecast, by Application 2019 & 2032
- Table 132: Rest of South America Chitosan Industry Volume (K Unit) Forecast, by Application 2019 & 2032
Frequently Asked Questions
1. What is the projected Compound Annual Growth Rate (CAGR) of the Chitosan Industry?
The projected CAGR is approximately 12.72%.
2. Which companies are prominent players in the Chitosan Industry?
Key companies in the market include KitoZyme SA, Marshal Marine, KIMICA Corporation, Panvo Organics Pvt Ltd, KiOmed Pharma, Meron Biopolymers, ChitoTech, Qingdao Yunzhou, Austanz Chitin Pty Ltd, BIO21 Co Ltd, Dainichiseika Color & Chemicals Mfg Co Ltd, Heppe Medical Chitosan GmbH.
3. What are the main segments of the Chitosan Industry?
The market segments include Source, Application.
4. Can you provide details about the market size?
The market size is estimated to be USD 2.06 Million as of 2022.
5. What are some drivers contributing to market growth?
Rising Water Treatment Activities; Growing Product Application in the Biomedical. Cosmetics. and Food and Beverage Industries; Strong Advancements in the Healthcare/Medical Industry.
6. What are the notable trends driving market growth?
Under Application. Water Treatment is Expected to Witness a Healthy Growth Rate Over the Forecast Period.
7. Are there any restraints impacting market growth?
Regulatory Framework.
8. Can you provide examples of recent developments in the market?
N/A
9. What pricing options are available for accessing the report?
Pricing options include single-user, multi-user, and enterprise licenses priced at USD 4750, USD 5250, and USD 8750 respectively.
10. Is the market size provided in terms of value or volume?
The market size is provided in terms of value, measured in Million and volume, measured in K Unit.
11. Are there any specific market keywords associated with the report?
Yes, the market keyword associated with the report is "Chitosan Industry," which aids in identifying and referencing the specific market segment covered.
12. How do I determine which pricing option suits my needs best?
The pricing options vary based on user requirements and access needs. Individual users may opt for single-user licenses, while businesses requiring broader access may choose multi-user or enterprise licenses for cost-effective access to the report.
13. Are there any additional resources or data provided in the Chitosan Industry report?
While the report offers comprehensive insights, it's advisable to review the specific contents or supplementary materials provided to ascertain if additional resources or data are available.
14. How can I stay updated on further developments or reports in the Chitosan Industry?
To stay informed about further developments, trends, and reports in the Chitosan Industry, consider subscribing to industry newsletters, following relevant companies and organizations, or regularly checking reputable industry news sources and publications.
Methodology
Step 1 - Identification of Relevant Samples Size from Population Database


Step 2 - Approaches for Defining Global Market Size (Value, Volume* & Price*)

Note*: In applicable scenarios
Step 3 - Data Sources
Primary Research
- Web Analytics
- Survey Reports
- Research Institute
- Latest Research Reports
- Opinion Leaders
Secondary Research
- Annual Reports
- White Paper
- Latest Press Release
- Industry Association
- Paid Database
- Investor Presentations

Step 4 - Data Triangulation
Involves using different sources of information in order to increase the validity of a study
These sources are likely to be stakeholders in a program - participants, other researchers, program staff, other community members, and so on.
Then we put all data in single framework & apply various statistical tools to find out the dynamic on the market.
During the analysis stage, feedback from the stakeholder groups would be compared to determine areas of agreement as well as areas of divergence


