

Key Insights
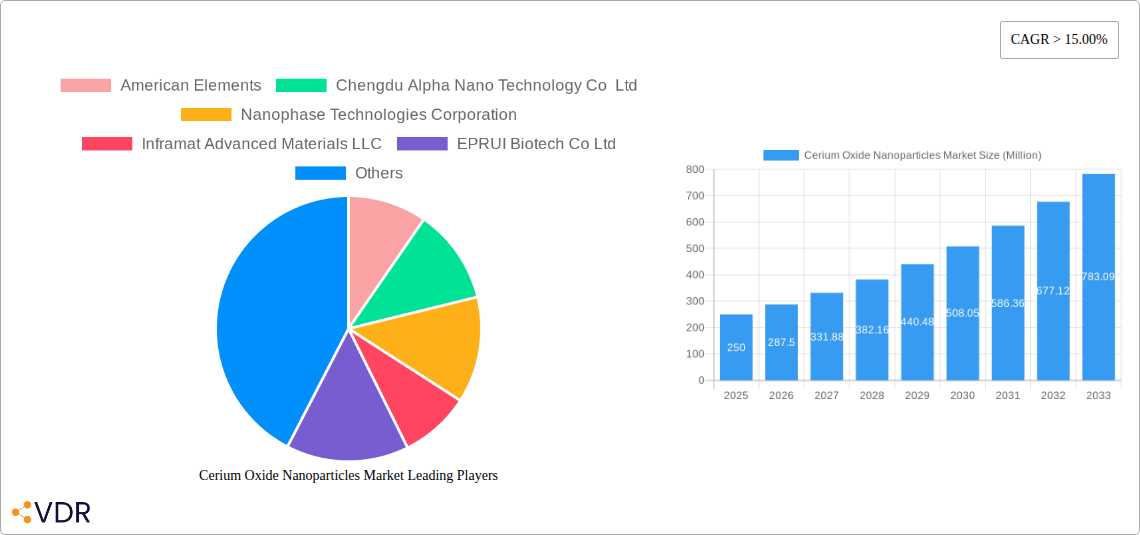
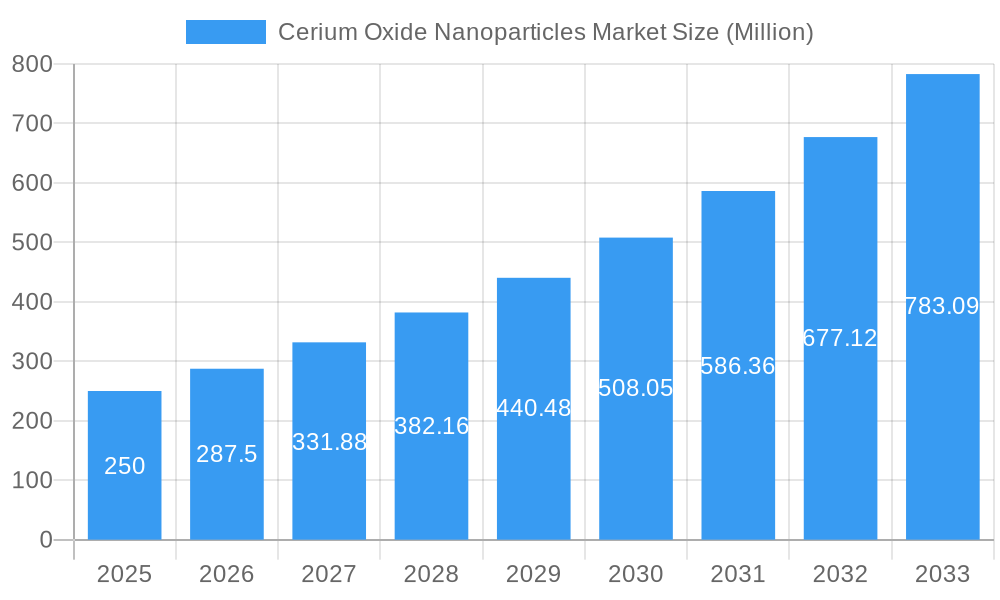
The global Cerium Oxide Nanoparticles market is poised for significant expansion, driven by widespread adoption across key industries. With a projected Compound Annual Growth Rate (CAGR) of 14%, the market is estimated at $0.84 billion in the base year 2025 and is expected to reach substantial figures by 2033. Key growth catalysts include the escalating demand for advanced materials in Chemical Mechanical Planarization (CMP) for semiconductor fabrication, the increasing utilization of cerium oxide nanoparticles as high-performance polishing agents, and their critical role in catalytic processes. Emerging applications in the biomedical field, such as advanced drug delivery and sensitive biosensors, alongside the burgeoning renewable energy sector's need for efficient energy storage solutions, are further accelerating market growth. The market is segmented by form (dispersion and powder) and application (CMP, polishing, catalysis, biomedical, energy storage, and others), enabling targeted market strategies.
Cerium Oxide Nanoparticles Market Market Size (In Million)
Geographically, North America leads the market, propelled by its advanced technological infrastructure and dominant semiconductor industry. Asia-Pacific, particularly China, is experiencing rapid expansion due to robust industrialization and increased investment in novel material technologies. Europe also holds a significant market share. The competitive landscape features established global suppliers and agile emerging players, indicating a dynamic and globally distributed market. The forecast period (2025-2033) anticipates sustained high growth, contingent on ongoing innovation in applications and the successful navigation of regulatory considerations.
Cerium Oxide Nanoparticles Market Company Market Share
Cerium Oxide Nanoparticles Market: A Comprehensive Report (2019-2033)
This comprehensive report provides a detailed analysis of the Cerium Oxide Nanoparticles market, offering invaluable insights for industry professionals, investors, and researchers. With a study period spanning 2019-2033, a base year of 2025, and a forecast period of 2025-2033, this report meticulously examines market dynamics, growth trends, and key players. The report segments the market by form (Dispersion, Powder) and application (Chemical Mechanical Planarization (CMP), Polishing Agent, Catalyst, Biomedical, Energy Storage, Others), providing granular insights into each segment's performance and potential. The market size is estimated to be xx Million in 2025 and is projected to reach xx Million by 2033.
Cerium Oxide Nanoparticles Market Market Dynamics & Structure
This section delves into the intricate dynamics shaping the Cerium Oxide Nanoparticles market. We analyze market concentration, revealing the share held by major players and identifying any trends towards consolidation or fragmentation. Technological innovation, a crucial driver, is examined, focusing on advancements in synthesis methods and application-specific formulations. The regulatory landscape is thoroughly assessed, highlighting relevant policies and their impact on market growth. Competitive pressures from substitute materials are evaluated, alongside analyses of end-user demographics and their evolving needs. Finally, the report explores mergers and acquisitions (M&A) activity within the sector, providing quantitative data on deal volumes and qualitative assessments of their impact on market structure.
- Market Concentration: The market is currently [Describe concentration level – e.g., moderately concentrated] with the top 5 players holding approximately xx% of the market share in 2025.
- Technological Innovation: Key innovations include [mention specific innovations, e.g., improved synthesis techniques leading to higher purity and better particle size control].
- Regulatory Framework: [Discuss relevant regulations and their impact – e.g., environmental regulations impacting manufacturing processes].
- Competitive Substitutes: [Identify and analyze substitute materials and their competitive advantages/disadvantages].
- M&A Activity: [Report on M&A trends – e.g., xx number of M&A deals were recorded between 2019 and 2024, primarily driven by [mention reasons]].
Cerium Oxide Nanoparticles Market Growth Trends & Insights
This section presents a comprehensive analysis of the Cerium Oxide Nanoparticles market's growth trajectory. We leverage extensive data and industry expertise to provide a detailed overview of market size evolution, adoption rates across various applications, and the impact of technological disruptions. Consumer behavior shifts and their influence on market demand are also explored. Specific metrics, such as Compound Annual Growth Rate (CAGR) and market penetration rates, are utilized to offer a nuanced understanding of market dynamics. The analysis incorporates data from [mention data sources].
Dominant Regions, Countries, or Segments in Cerium Oxide Nanoparticles Market
This section identifies the leading geographic regions, countries, and market segments within the Cerium Oxide Nanoparticles market. We pinpoint the dominant segments (e.g., Dispersion form, CMP application) and regions, providing in-depth analysis of their market share and growth potential. The analysis considers several factors influencing regional dominance, including economic policies, infrastructure development, and industry concentration.
- Leading Region: [Name the leading region, e.g., North America] driven by [mention reasons e.g., strong demand from the electronics industry].
- Leading Country: [Name the leading country, e.g., USA] due to [mention reasons e.g., presence of major manufacturers and robust R&D activities].
- Leading Segment (Form): [Name the leading form, e.g., Dispersion] due to [mention reasons, e.g., higher ease of handling and integration in various applications].
- Leading Segment (Application): [Name the leading application, e.g., Chemical Mechanical Planarization (CMP)] owing to [mention reasons, e.g., extensive use in semiconductor manufacturing].
Cerium Oxide Nanoparticles Market Product Landscape
This section provides a concise overview of the product landscape, focusing on key product innovations, applications, and performance metrics. We highlight unique selling propositions and technological advancements that differentiate various products in the market. The analysis focuses on product features impacting performance such as particle size, purity, and surface functionalization.
Key Drivers, Barriers & Challenges in Cerium Oxide Nanoparticles Market
This section analyzes the key drivers and challenges impacting the Cerium Oxide Nanoparticles market. Drivers include technological advancements, favorable government policies, and rising demand from key industries. Challenges include supply chain disruptions, fluctuating raw material prices, and stringent regulatory compliance requirements. Specific examples and quantifiable impacts are provided.
- Key Drivers: [List key drivers, e.g., Increasing demand for advanced electronic devices, rising investments in renewable energy technologies].
- Key Challenges: [List key challenges, e.g., Price volatility of raw materials, stringent environmental regulations].
Emerging Opportunities in Cerium Oxide Nanoparticles Market
This section identifies emerging opportunities for growth, including untapped markets, innovative applications, and evolving consumer preferences. It highlights potential areas for expansion and strategic investments.
- Untapped Markets: [Mention untapped markets, e.g., biomedical applications in developing countries].
- Innovative Applications: [Mention innovative applications, e.g., catalysts in green chemistry].
Growth Accelerators in the Cerium Oxide Nanoparticles Market Industry
This section discusses factors accelerating long-term market growth, such as technological breakthroughs, strategic partnerships, and market expansion strategies. The focus is on sustainable growth drivers and long-term market outlook.
Key Players Shaping the Cerium Oxide Nanoparticles Market Market
This section profiles key players in the Cerium Oxide Nanoparticles market.
- American Elements
- Chengdu Alpha Nano Technology Co Ltd
- Nanophase Technologies Corporation
- Inframat Advanced Materials LLC
- EPRUI Biotech Co Ltd
- Nanostructured & Amorphous Materials Inc
- Advanced Nano Products Co Ltd
- Cerion LLC
- Meliorum Technologies Inc
- Strem Chemicals Inc
- NYACOL Nano Technologies Inc
- SkySpring Nanomaterials Inc
Notable Milestones in Cerium Oxide Nanoparticles Market Sector
This section lists significant developments impacting the market dynamics. [List key milestones with dates - e.g., "Q1 2023: Nanophase Technologies Corporation announced a new production facility for cerium oxide nanoparticles."]
In-Depth Cerium Oxide Nanoparticles Market Market Outlook
This section summarizes the growth accelerators and provides a future outlook for the Cerium Oxide Nanoparticles market, highlighting potential growth areas and strategic opportunities for market participants. The focus is on the long-term vision and potential for sustained growth in the coming years.
Cerium Oxide Nanoparticles Market Segmentation
-
1. Form
- 1.1. Dispersion
- 1.2. Powder
-
2. Application
- 2.1. Chemical Mechanical Planarization (CMP)
- 2.2. Polishing Agent
- 2.3. Catalyst
- 2.4. Biomedical
- 2.5. Energy Storage
- 2.6. Others
Cerium Oxide Nanoparticles Market Segmentation By Geography
-
1. Asia Pacific
- 1.1. China
- 1.2. India
- 1.3. Japan
- 1.4. South Korea
- 1.5. Rest of Asia Pacific
-
2. North America
- 2.1. United States
- 2.2. Canada
- 2.3. Mexico
-
3. Europe
- 3.1. Germany
- 3.2. United Kingdom
- 3.3. France
- 3.4. Italy
- 3.5. Rest of Europe
-
4. Rest of the World
- 4.1. South America
- 4.2. Middle East and Africa
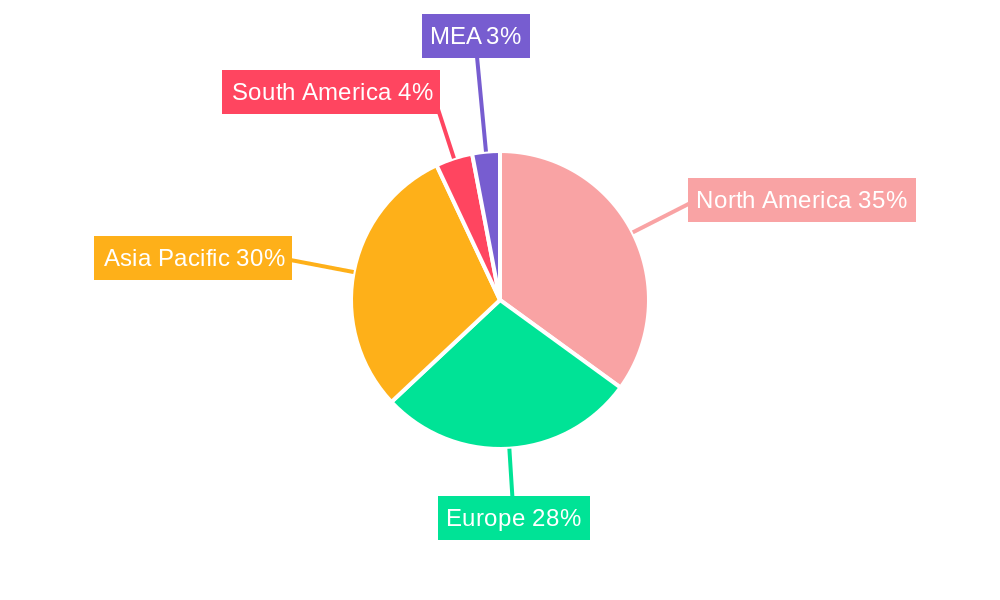
Cerium Oxide Nanoparticles Market Regional Market Share
Geographic Coverage of Cerium Oxide Nanoparticles Market
Cerium Oxide Nanoparticles Market REPORT HIGHLIGHTS
| Aspects | Details |
|---|---|
| Study Period | 2020-2034 |
| Base Year | 2025 |
| Estimated Year | 2026 |
| Forecast Period | 2026-2034 |
| Historical Period | 2020-2025 |
| Growth Rate | CAGR of 14% from 2020-2034 |
| Segmentation |
|
Table of Contents
- 1. Introduction
- 1.1. Research Scope
- 1.2. Market Segmentation
- 1.3. Research Objective
- 1.4. Definitions and Assumptions
- 2. Executive Summary
- 2.1. Market Snapshot
- 3. Market Dynamics
- 3.1. Market Drivers
- 3.2. Market Restrains
- 3.3. Market Trends
- 3.4. Market Opportunities
- 4. Market Factor Analysis
- 4.1. Porters Five Forces
- 4.1.1. Bargaining Power of Suppliers
- 4.1.2. Bargaining Power of Buyers
- 4.1.3. Threat of New Entrants
- 4.1.4. Threat of Substitutes
- 4.1.5. Competitive Rivalry
- 4.2. PESTEL analysis
- 4.3. BCG Analysis
- 4.3.1. Stars (High Growth, High Market Share)
- 4.3.2. Cash Cows (Low Growth, High Market Share)
- 4.3.3. Question Mark (High Growth, Low Market Share)
- 4.3.4. Dogs (Low Growth, Low Market Share)
- 4.4. Ansoff Matrix Analysis
- 4.5. Supply Chain Analysis
- 4.6. Regulatory Landscape
- 4.7. Current Market Potential and Opportunity Assessment (TAM–SAM–SOM Framework)
- 4.8. VDR Analyst Note
- 4.1. Porters Five Forces
- 5. Market Analysis, Insights and Forecast 2021-2033
- 5.1. Market Analysis, Insights and Forecast - by Form
- 5.1.1. Dispersion
- 5.1.2. Powder
- 5.2. Market Analysis, Insights and Forecast - by Application
- 5.2.1. Chemical Mechanical Planarization (CMP)
- 5.2.2. Polishing Agent
- 5.2.3. Catalyst
- 5.2.4. Biomedical
- 5.2.5. Energy Storage
- 5.2.6. Others
- 5.3. Market Analysis, Insights and Forecast - by Region
- 5.3.1. Asia Pacific
- 5.3.2. North America
- 5.3.3. Europe
- 5.3.4. Rest of the World
- 5.1. Market Analysis, Insights and Forecast - by Form
- 6. Global Cerium Oxide Nanoparticles Market Analysis, Insights and Forecast, 2021-2033
- 6.1. Market Analysis, Insights and Forecast - by Form
- 6.1.1. Dispersion
- 6.1.2. Powder
- 6.2. Market Analysis, Insights and Forecast - by Application
- 6.2.1. Chemical Mechanical Planarization (CMP)
- 6.2.2. Polishing Agent
- 6.2.3. Catalyst
- 6.2.4. Biomedical
- 6.2.5. Energy Storage
- 6.2.6. Others
- 6.1. Market Analysis, Insights and Forecast - by Form
- 7. Asia Pacific Cerium Oxide Nanoparticles Market Analysis, Insights and Forecast, 2021-2033
- 7.1. Market Analysis, Insights and Forecast - by Form
- 7.1.1. Dispersion
- 7.1.2. Powder
- 7.2. Market Analysis, Insights and Forecast - by Application
- 7.2.1. Chemical Mechanical Planarization (CMP)
- 7.2.2. Polishing Agent
- 7.2.3. Catalyst
- 7.2.4. Biomedical
- 7.2.5. Energy Storage
- 7.2.6. Others
- 7.1. Market Analysis, Insights and Forecast - by Form
- 8. North America Cerium Oxide Nanoparticles Market Analysis, Insights and Forecast, 2021-2033
- 8.1. Market Analysis, Insights and Forecast - by Form
- 8.1.1. Dispersion
- 8.1.2. Powder
- 8.2. Market Analysis, Insights and Forecast - by Application
- 8.2.1. Chemical Mechanical Planarization (CMP)
- 8.2.2. Polishing Agent
- 8.2.3. Catalyst
- 8.2.4. Biomedical
- 8.2.5. Energy Storage
- 8.2.6. Others
- 8.1. Market Analysis, Insights and Forecast - by Form
- 9. Europe Cerium Oxide Nanoparticles Market Analysis, Insights and Forecast, 2021-2033
- 9.1. Market Analysis, Insights and Forecast - by Form
- 9.1.1. Dispersion
- 9.1.2. Powder
- 9.2. Market Analysis, Insights and Forecast - by Application
- 9.2.1. Chemical Mechanical Planarization (CMP)
- 9.2.2. Polishing Agent
- 9.2.3. Catalyst
- 9.2.4. Biomedical
- 9.2.5. Energy Storage
- 9.2.6. Others
- 9.1. Market Analysis, Insights and Forecast - by Form
- 10. Rest of the World Cerium Oxide Nanoparticles Market Analysis, Insights and Forecast, 2021-2033
- 10.1. Market Analysis, Insights and Forecast - by Form
- 10.1.1. Dispersion
- 10.1.2. Powder
- 10.2. Market Analysis, Insights and Forecast - by Application
- 10.2.1. Chemical Mechanical Planarization (CMP)
- 10.2.2. Polishing Agent
- 10.2.3. Catalyst
- 10.2.4. Biomedical
- 10.2.5. Energy Storage
- 10.2.6. Others
- 10.1. Market Analysis, Insights and Forecast - by Form
- 11. Competitive Analysis
- 11.1. Company Profiles
- 11.1.1 American Elements
- 11.1.1.1. Company Overview
- 11.1.1.2. Products
- 11.1.1.3. Company Financials
- 11.1.1.4. SWOT Analysis
- 11.1.2 Chengdu Alpha Nano Technology Co Ltd
- 11.1.2.1. Company Overview
- 11.1.2.2. Products
- 11.1.2.3. Company Financials
- 11.1.2.4. SWOT Analysis
- 11.1.3 Nanophase Technologies Corporation
- 11.1.3.1. Company Overview
- 11.1.3.2. Products
- 11.1.3.3. Company Financials
- 11.1.3.4. SWOT Analysis
- 11.1.4 Inframat Advanced Materials LLC
- 11.1.4.1. Company Overview
- 11.1.4.2. Products
- 11.1.4.3. Company Financials
- 11.1.4.4. SWOT Analysis
- 11.1.5 EPRUI Biotech Co Ltd
- 11.1.5.1. Company Overview
- 11.1.5.2. Products
- 11.1.5.3. Company Financials
- 11.1.5.4. SWOT Analysis
- 11.1.6 Nanostructured & Amorphous Materials Inc
- 11.1.6.1. Company Overview
- 11.1.6.2. Products
- 11.1.6.3. Company Financials
- 11.1.6.4. SWOT Analysis
- 11.1.7 Advanced Nano Products Co Ltd
- 11.1.7.1. Company Overview
- 11.1.7.2. Products
- 11.1.7.3. Company Financials
- 11.1.7.4. SWOT Analysis
- 11.1.8 Cerion LLC
- 11.1.8.1. Company Overview
- 11.1.8.2. Products
- 11.1.8.3. Company Financials
- 11.1.8.4. SWOT Analysis
- 11.1.9 Meliorum Technologies Inc
- 11.1.9.1. Company Overview
- 11.1.9.2. Products
- 11.1.9.3. Company Financials
- 11.1.9.4. SWOT Analysis
- 11.1.10 Strem Chemicals Inc *List Not Exhaustive
- 11.1.10.1. Company Overview
- 11.1.10.2. Products
- 11.1.10.3. Company Financials
- 11.1.10.4. SWOT Analysis
- 11.1.11 NYACOL Nano Technologies Inc
- 11.1.11.1. Company Overview
- 11.1.11.2. Products
- 11.1.11.3. Company Financials
- 11.1.11.4. SWOT Analysis
- 11.1.12 SkySpring Nanomaterials Inc
- 11.1.12.1. Company Overview
- 11.1.12.2. Products
- 11.1.12.3. Company Financials
- 11.1.12.4. SWOT Analysis
- 11.1.1 American Elements
- 11.2. Market Entropy
- 11.2.1 Company's Key Areas Served
- 11.2.2 Recent Developments
- 11.3. Company Market Share Analysis 2025
- 11.3.1 Top 5 Companies Market Share Analysis
- 11.3.2 Top 3 Companies Market Share Analysis
- 11.4. List of Potential Customers
- 12. Research Methodology
List of Figures
- Figure 1: Global Cerium Oxide Nanoparticles Market Revenue Breakdown (billion, %) by Region 2025 & 2033
- Figure 2: Asia Pacific Cerium Oxide Nanoparticles Market Revenue (billion), by Form 2025 & 2033
- Figure 3: Asia Pacific Cerium Oxide Nanoparticles Market Revenue Share (%), by Form 2025 & 2033
- Figure 4: Asia Pacific Cerium Oxide Nanoparticles Market Revenue (billion), by Application 2025 & 2033
- Figure 5: Asia Pacific Cerium Oxide Nanoparticles Market Revenue Share (%), by Application 2025 & 2033
- Figure 6: Asia Pacific Cerium Oxide Nanoparticles Market Revenue (billion), by Country 2025 & 2033
- Figure 7: Asia Pacific Cerium Oxide Nanoparticles Market Revenue Share (%), by Country 2025 & 2033
- Figure 8: North America Cerium Oxide Nanoparticles Market Revenue (billion), by Form 2025 & 2033
- Figure 9: North America Cerium Oxide Nanoparticles Market Revenue Share (%), by Form 2025 & 2033
- Figure 10: North America Cerium Oxide Nanoparticles Market Revenue (billion), by Application 2025 & 2033
- Figure 11: North America Cerium Oxide Nanoparticles Market Revenue Share (%), by Application 2025 & 2033
- Figure 12: North America Cerium Oxide Nanoparticles Market Revenue (billion), by Country 2025 & 2033
- Figure 13: North America Cerium Oxide Nanoparticles Market Revenue Share (%), by Country 2025 & 2033
- Figure 14: Europe Cerium Oxide Nanoparticles Market Revenue (billion), by Form 2025 & 2033
- Figure 15: Europe Cerium Oxide Nanoparticles Market Revenue Share (%), by Form 2025 & 2033
- Figure 16: Europe Cerium Oxide Nanoparticles Market Revenue (billion), by Application 2025 & 2033
- Figure 17: Europe Cerium Oxide Nanoparticles Market Revenue Share (%), by Application 2025 & 2033
- Figure 18: Europe Cerium Oxide Nanoparticles Market Revenue (billion), by Country 2025 & 2033
- Figure 19: Europe Cerium Oxide Nanoparticles Market Revenue Share (%), by Country 2025 & 2033
- Figure 20: Rest of the World Cerium Oxide Nanoparticles Market Revenue (billion), by Form 2025 & 2033
- Figure 21: Rest of the World Cerium Oxide Nanoparticles Market Revenue Share (%), by Form 2025 & 2033
- Figure 22: Rest of the World Cerium Oxide Nanoparticles Market Revenue (billion), by Application 2025 & 2033
- Figure 23: Rest of the World Cerium Oxide Nanoparticles Market Revenue Share (%), by Application 2025 & 2033
- Figure 24: Rest of the World Cerium Oxide Nanoparticles Market Revenue (billion), by Country 2025 & 2033
- Figure 25: Rest of the World Cerium Oxide Nanoparticles Market Revenue Share (%), by Country 2025 & 2033
List of Tables
- Table 1: Global Cerium Oxide Nanoparticles Market Revenue billion Forecast, by Form 2020 & 2033
- Table 2: Global Cerium Oxide Nanoparticles Market Revenue billion Forecast, by Application 2020 & 2033
- Table 3: Global Cerium Oxide Nanoparticles Market Revenue billion Forecast, by Region 2020 & 2033
- Table 4: Global Cerium Oxide Nanoparticles Market Revenue billion Forecast, by Form 2020 & 2033
- Table 5: Global Cerium Oxide Nanoparticles Market Revenue billion Forecast, by Application 2020 & 2033
- Table 6: Global Cerium Oxide Nanoparticles Market Revenue billion Forecast, by Country 2020 & 2033
- Table 7: China Cerium Oxide Nanoparticles Market Revenue (billion) Forecast, by Application 2020 & 2033
- Table 8: India Cerium Oxide Nanoparticles Market Revenue (billion) Forecast, by Application 2020 & 2033
- Table 9: Japan Cerium Oxide Nanoparticles Market Revenue (billion) Forecast, by Application 2020 & 2033
- Table 10: South Korea Cerium Oxide Nanoparticles Market Revenue (billion) Forecast, by Application 2020 & 2033
- Table 11: Rest of Asia Pacific Cerium Oxide Nanoparticles Market Revenue (billion) Forecast, by Application 2020 & 2033
- Table 12: Global Cerium Oxide Nanoparticles Market Revenue billion Forecast, by Form 2020 & 2033
- Table 13: Global Cerium Oxide Nanoparticles Market Revenue billion Forecast, by Application 2020 & 2033
- Table 14: Global Cerium Oxide Nanoparticles Market Revenue billion Forecast, by Country 2020 & 2033
- Table 15: United States Cerium Oxide Nanoparticles Market Revenue (billion) Forecast, by Application 2020 & 2033
- Table 16: Canada Cerium Oxide Nanoparticles Market Revenue (billion) Forecast, by Application 2020 & 2033
- Table 17: Mexico Cerium Oxide Nanoparticles Market Revenue (billion) Forecast, by Application 2020 & 2033
- Table 18: Global Cerium Oxide Nanoparticles Market Revenue billion Forecast, by Form 2020 & 2033
- Table 19: Global Cerium Oxide Nanoparticles Market Revenue billion Forecast, by Application 2020 & 2033
- Table 20: Global Cerium Oxide Nanoparticles Market Revenue billion Forecast, by Country 2020 & 2033
- Table 21: Germany Cerium Oxide Nanoparticles Market Revenue (billion) Forecast, by Application 2020 & 2033
- Table 22: United Kingdom Cerium Oxide Nanoparticles Market Revenue (billion) Forecast, by Application 2020 & 2033
- Table 23: France Cerium Oxide Nanoparticles Market Revenue (billion) Forecast, by Application 2020 & 2033
- Table 24: Italy Cerium Oxide Nanoparticles Market Revenue (billion) Forecast, by Application 2020 & 2033
- Table 25: Rest of Europe Cerium Oxide Nanoparticles Market Revenue (billion) Forecast, by Application 2020 & 2033
- Table 26: Global Cerium Oxide Nanoparticles Market Revenue billion Forecast, by Form 2020 & 2033
- Table 27: Global Cerium Oxide Nanoparticles Market Revenue billion Forecast, by Application 2020 & 2033
- Table 28: Global Cerium Oxide Nanoparticles Market Revenue billion Forecast, by Country 2020 & 2033
- Table 29: South America Cerium Oxide Nanoparticles Market Revenue (billion) Forecast, by Application 2020 & 2033
- Table 30: Middle East and Africa Cerium Oxide Nanoparticles Market Revenue (billion) Forecast, by Application 2020 & 2033
Frequently Asked Questions
1. What is the projected Compound Annual Growth Rate (CAGR) of the Cerium Oxide Nanoparticles Market?
The projected CAGR is approximately 14%.
2. Which companies are prominent players in the Cerium Oxide Nanoparticles Market?
Key companies in the market include American Elements, Chengdu Alpha Nano Technology Co Ltd, Nanophase Technologies Corporation, Inframat Advanced Materials LLC, EPRUI Biotech Co Ltd, Nanostructured & Amorphous Materials Inc, Advanced Nano Products Co Ltd, Cerion LLC, Meliorum Technologies Inc, Strem Chemicals Inc *List Not Exhaustive, NYACOL Nano Technologies Inc, SkySpring Nanomaterials Inc.
3. What are the main segments of the Cerium Oxide Nanoparticles Market?
The market segments include Form, Application.
4. Can you provide details about the market size?
The market size is estimated to be USD 0.84 billion as of 2022.
5. What are some drivers contributing to market growth?
; Growing Demand from Semiconductor Industry; Rising Polishing Agent Utilization.
6. What are the notable trends driving market growth?
Chemical Mechanical Planarization (CMP) Segment to Dominate the Market.
7. Are there any restraints impacting market growth?
; Toxic Nature at High Concentration; Unfavorable Conditions Arising Due to COVID-19 Outbreak.
8. Can you provide examples of recent developments in the market?
N/A
9. What pricing options are available for accessing the report?
Pricing options include single-user, multi-user, and enterprise licenses priced at USD 4750, USD 5250, and USD 8750 respectively.
10. Is the market size provided in terms of value or volume?
The market size is provided in terms of value, measured in billion.
11. Are there any specific market keywords associated with the report?
Yes, the market keyword associated with the report is "Cerium Oxide Nanoparticles Market," which aids in identifying and referencing the specific market segment covered.
12. How do I determine which pricing option suits my needs best?
The pricing options vary based on user requirements and access needs. Individual users may opt for single-user licenses, while businesses requiring broader access may choose multi-user or enterprise licenses for cost-effective access to the report.
13. Are there any additional resources or data provided in the Cerium Oxide Nanoparticles Market report?
While the report offers comprehensive insights, it's advisable to review the specific contents or supplementary materials provided to ascertain if additional resources or data are available.
14. How can I stay updated on further developments or reports in the Cerium Oxide Nanoparticles Market?
To stay informed about further developments, trends, and reports in the Cerium Oxide Nanoparticles Market, consider subscribing to industry newsletters, following relevant companies and organizations, or regularly checking reputable industry news sources and publications.
Methodology
Step 1 - Identification of Relevant Samples Size from Population Database


Step 2 - Approaches for Defining Global Market Size (Value, Volume* & Price*)

Note*: In applicable scenarios
Step 3 - Data Sources
Primary Research
- Web Analytics
- Survey Reports
- Research Institute
- Latest Research Reports
- Opinion Leaders
Secondary Research
- Annual Reports
- White Paper
- Latest Press Release
- Industry Association
- Paid Database
- Investor Presentations

Step 4 - Data Triangulation
Involves using different sources of information in order to increase the validity of a study
These sources are likely to be stakeholders in a program - participants, other researchers, program staff, other community members, and so on.
Then we put all data in single framework & apply various statistical tools to find out the dynamic on the market.
During the analysis stage, feedback from the stakeholder groups would be compared to determine areas of agreement as well as areas of divergence