
Key Insights
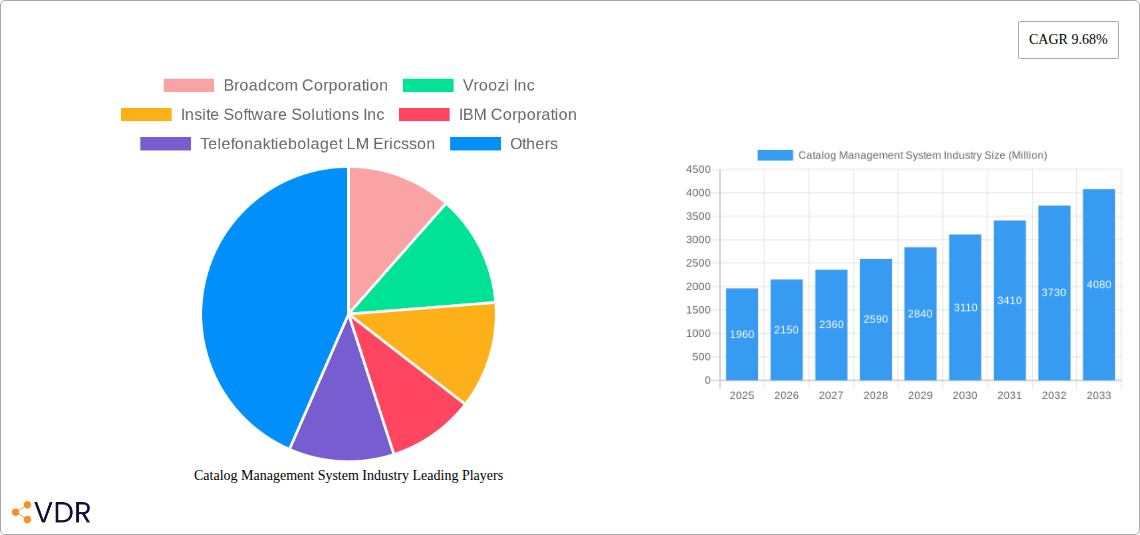
The Catalog Management System (CMS) market, valued at $1.96 billion in 2025, is experiencing robust growth, projected to expand at a Compound Annual Growth Rate (CAGR) of 9.68% from 2025 to 2033. This growth is fueled by several key drivers. The increasing need for efficient inventory management across diverse industries like retail, e-commerce, and manufacturing necessitates streamlined catalog processes. Businesses are adopting CMS solutions to improve data accuracy, reduce operational costs associated with manual catalog updates, and enhance customer experiences through accurate and readily available product information. Furthermore, the rising adoption of cloud-based deployment models offers scalability and accessibility, further accelerating market expansion. The shift towards omnichannel commerce strategies, requiring seamless integration of product catalogs across various sales platforms, is another significant driver. While challenges such as integration complexities with legacy systems and the need for skilled personnel to manage these systems exist, the overall market outlook remains positive, driven by the continuous evolution of e-commerce and the demand for efficient digital catalog management.
The CMS market is segmented by type (Service Catalogs and Product Catalogs), deployment type (Cloud and On-premises), and industry vertical (IT & Telecom, Retail & E-commerce, BFSI, Media & Entertainment, Travel & Hospitality, and Others). Cloud-based deployments are gaining significant traction due to their inherent flexibility and cost-effectiveness. The retail and e-commerce sectors currently dominate the market due to the high volume of product catalogs managed and the critical role accurate catalog information plays in online sales. However, other sectors, including BFSI and Travel & Hospitality, are showing increasing adoption rates, indicating a broadening market base. Key players such as Broadcom, IBM, and SAP are shaping the market landscape through continuous innovation and strategic acquisitions. Geographic expansion, particularly in Asia-Pacific driven by the growth of e-commerce in emerging markets, contributes significantly to the market's overall growth trajectory. Competitive pressures, technological advancements, and evolving customer expectations will likely shape the market dynamics in the coming years, favoring vendors who can deliver innovative, scalable, and user-friendly solutions.
Catalog Management System Industry Market Report: 2019-2033
This comprehensive report provides an in-depth analysis of the Catalog Management System (CMS) industry, encompassing market dynamics, growth trends, regional segmentation, product landscape, key players, and future outlook. The report covers the period 2019-2033, with a focus on 2025 as the base and estimated year. The parent market is Enterprise Resource Planning (ERP) software, while the child market is specifically Catalog Management Systems. The total addressable market (TAM) in 2025 is estimated at xx Million.
Catalog Management System Industry Market Dynamics & Structure
The Catalog Management System market is characterized by a moderately consolidated structure, with a few major players holding significant market share. However, the market is also witnessing an increase in competition from smaller, niche players offering specialized solutions. Technological innovation, particularly in areas like AI-powered product recommendations and automated catalog updates, is a significant growth driver. Regulatory frameworks, such as data privacy regulations (GDPR, CCPA), are shaping vendor strategies and influencing product development. The emergence of cloud-based solutions is a key trend, offering increased scalability and flexibility compared to on-premise systems. Competitive substitutes include manual catalog management processes and basic e-commerce platforms lacking sophisticated CMS capabilities. The end-user demographic spans various industry verticals, with a concentration in Retail & E-commerce and IT & Telecom. M&A activity in the CMS sector has been moderate, with xx deals recorded between 2019 and 2024, primarily driven by consolidation efforts and the acquisition of specialized technologies.
- Market Concentration: Top 5 players hold approximately xx% of the market share in 2025.
- Innovation Drivers: AI-powered catalog optimization, API integrations, enhanced user experience.
- Regulatory Factors: GDPR, CCPA compliance driving data security and transparency requirements.
- M&A Activity: xx deals between 2019 and 2024, with an average deal size of xx Million.
- Innovation Barriers: High initial investment costs, integration complexities, lack of skilled resources.
Catalog Management System Industry Growth Trends & Insights
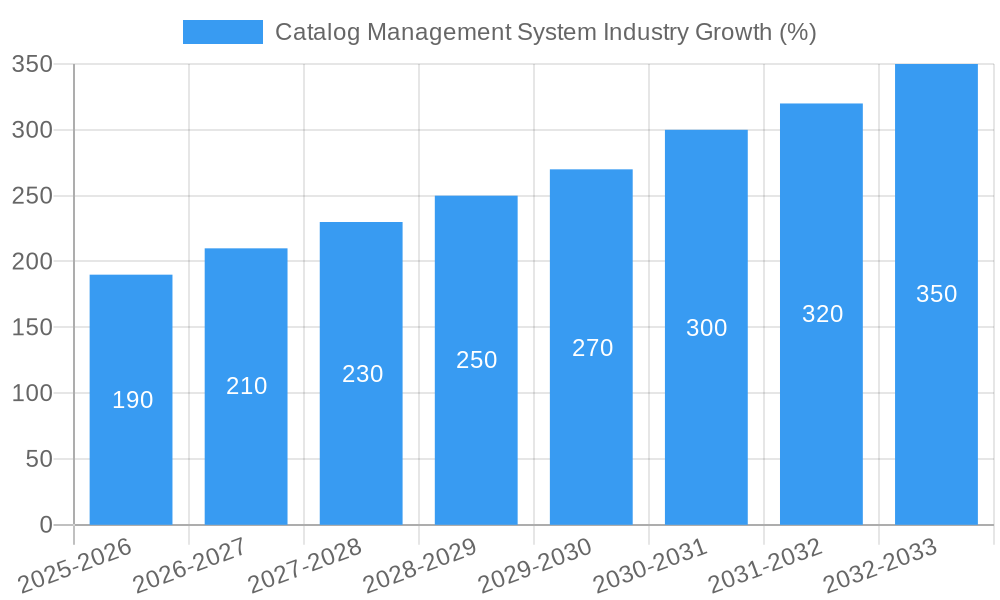
The CMS market experienced significant growth between 2019 and 2024, driven by the increasing adoption of e-commerce and the need for efficient product information management across various channels. The market size grew from xx Million in 2019 to xx Million in 2024, with a CAGR of xx%. The cloud deployment model witnessed the highest adoption rate, owing to its scalability and cost-effectiveness. Technological disruptions, such as the rise of headless commerce and the integration of PIM (Product Information Management) systems, are further accelerating market growth. Shifts in consumer behavior, including the preference for personalized experiences and omnichannel engagement, are driving demand for advanced CMS solutions capable of managing complex product catalogs across diverse platforms. The market is expected to continue its growth trajectory, reaching xx Million by 2033, with a projected CAGR of xx% during the forecast period (2025-2033). Market penetration in key industry verticals is expected to increase significantly.
Dominant Regions, Countries, or Segments in Catalog Management System Industry
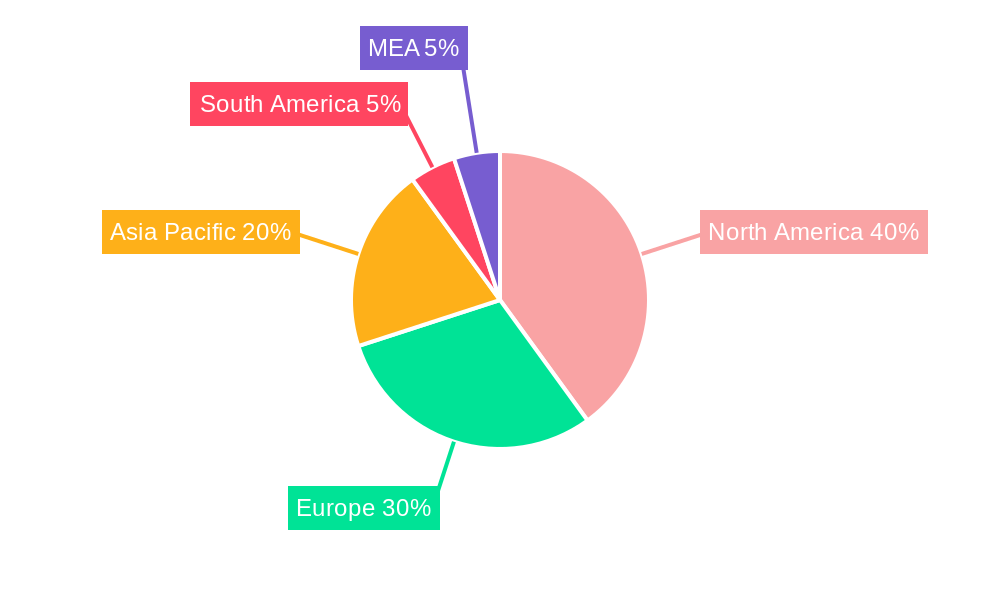
North America currently holds the largest market share in the CMS industry, driven by high e-commerce adoption rates and the presence of major technology companies. Within North America, the United States dominates. Europe is the second-largest region, with significant growth potential in emerging markets like Eastern Europe. Asia Pacific is experiencing rapid growth, fueled by increasing e-commerce penetration and government initiatives promoting digital transformation. Among segments, the cloud deployment type dominates, representing xx% of the market in 2025, followed by on-premises solutions. In terms of industry verticals, Retail and E-commerce is the largest segment, accounting for xx% of the market, followed by IT and Telecom.
- Key Drivers: Strong e-commerce growth, increasing demand for omnichannel strategies, digital transformation initiatives.
- North America Dominance: High adoption of cloud solutions, strong presence of key players, advanced digital infrastructure.
- Asia Pacific Growth: Rapid e-commerce adoption, supportive government policies, increasing smartphone penetration.
- Retail & E-commerce Segment: High dependence on efficient product catalog management for online sales.
Catalog Management System Industry Product Landscape
The CMS market offers a diverse range of products, from basic catalog management systems to advanced platforms integrating PIM, DAM (Digital Asset Management), and other functionalities. Key features include centralized catalog management, multi-channel publishing, product information enrichment, automated workflows, and advanced analytics. Product innovation focuses on improving user experience, integrating AI/ML for enhanced personalization, and strengthening data security. Leading vendors continuously introduce new features and integrations to meet the evolving demands of their customers.
Key Drivers, Barriers & Challenges in Catalog Management System Industry
Key Drivers: The rising adoption of e-commerce, the need for efficient product information management, and the increasing demand for personalized customer experiences are key drivers. Furthermore, technological advancements, such as AI and machine learning, are enhancing the capabilities of CMS solutions and driving growth.
Key Barriers and Challenges: High implementation costs, integration complexity with existing systems, and the need for skilled personnel are significant barriers. Data security and compliance with evolving regulations pose further challenges. Competitive pressures from established players and new entrants also impact market dynamics. The estimated impact of these challenges on market growth is approximately xx% reduction in CAGR by 2033.
Emerging Opportunities in Catalog Management System Industry
Emerging opportunities lie in untapped markets in developing economies, the growing demand for integrated PIM and DAM solutions, and the increasing adoption of headless commerce architectures. The integration of AI for personalized product recommendations, improved search capabilities, and automated catalog updates presents significant potential. Furthermore, the development of solutions tailored to specific industry needs, such as healthcare or manufacturing, offers considerable growth opportunities.
Growth Accelerators in the Catalog Management System Industry Industry
Strategic partnerships between CMS providers and other technology vendors, such as PIM and ERP companies, are accelerating market growth. Technological breakthroughs, such as the adoption of AI and machine learning, enhance the capabilities of CMS solutions. Market expansion strategies, particularly into emerging markets, also contribute to growth.
Key Players Shaping the Catalog Management System Industry Market
- Broadcom Corporation
- Vroozi Inc
- Insite Software Solutions Inc
- IBM Corporation
- Telefonaktiebolaget LM Ericsson
- Coupa Software Inc
- GEP Worldwide
- Amdocs
- Fujitsu Limited
- Zycus Inc
- Sellercloud Inc
- ServiceNow Inc
- Salsify Inc
- Oracle Corporation
- Comarch SA
- Plytix com Ap
- Proactis Holdings Plc
- SAP SE
Notable Milestones in Catalog Management System Industry Sector
- 2020: Increased adoption of cloud-based CMS solutions due to the pandemic.
- 2021: Several key players launched AI-powered features in their CMS platforms.
- 2022: Significant investments in PIM and DAM integrations by major CMS providers.
- 2023: Focus on headless commerce and API-first architectures.
- 2024: Several mergers and acquisitions aimed at consolidating the market.
In-Depth Catalog Management System Industry Market Outlook
The CMS market is poised for continued strong growth, driven by ongoing digital transformation efforts across various industry sectors. Opportunities abound in the development of AI-powered solutions, the expansion into emerging markets, and the integration of innovative technologies. Strategic partnerships and mergers and acquisitions will continue to shape the market landscape, leading to increased consolidation and the emergence of more robust and comprehensive CMS platforms. The market is expected to maintain a healthy growth trajectory, presenting significant opportunities for both established players and new entrants.
Catalog Management System Industry Segmentation
-
1. Type
- 1.1. Service Catalogs
- 1.2. Product Catalogs
-
2. Deployment Type
- 2.1. Cloud
- 2.2. On-Premises
-
3. Industry Vertical
- 3.1. IT and Telecom
- 3.2. Retail and E-commerce
- 3.3. BFSI
- 3.4. Media and Entertainment
- 3.5. Travel and Hospitality
- 3.6. Other Industry Verticals
Catalog Management System Industry Segmentation By Geography
- 1. North America
- 2. Europe
- 3. Asia
- 4. Australia and New Zealand
- 5. Latin America
- 6. Middle East and Africa
Catalog Management System Industry REPORT HIGHLIGHTS
| Aspects | Details |
|---|---|
| Study Period | 2019-2033 |
| Base Year | 2024 |
| Estimated Year | 2025 |
| Forecast Period | 2025-2033 |
| Historical Period | 2019-2024 |
| Growth Rate | CAGR of 9.68% from 2019-2033 |
| Segmentation |
|
Table of Contents
- 1. Introduction
- 1.1. Research Scope
- 1.2. Market Segmentation
- 1.3. Research Methodology
- 1.4. Definitions and Assumptions
- 2. Executive Summary
- 2.1. Introduction
- 3. Market Dynamics
- 3.1. Introduction
- 3.2. Market Drivers
- 3.2.1. Growing Digital Transformation Initiatives; Necessity of Centralized Systems for Improved Marketing and Selling
- 3.3. Market Restrains
- 3.3.1. Privacy and Security Concerns
- 3.4. Market Trends
- 3.4.1. Growing Digital Transformation Initiatives Drives the Market
- 4. Market Factor Analysis
- 4.1. Porters Five Forces
- 4.2. Supply/Value Chain
- 4.3. PESTEL analysis
- 4.4. Market Entropy
- 4.5. Patent/Trademark Analysis
- 5. Global Catalog Management System Industry Analysis, Insights and Forecast, 2019-2031
- 5.1. Market Analysis, Insights and Forecast - by Type
- 5.1.1. Service Catalogs
- 5.1.2. Product Catalogs
- 5.2. Market Analysis, Insights and Forecast - by Deployment Type
- 5.2.1. Cloud
- 5.2.2. On-Premises
- 5.3. Market Analysis, Insights and Forecast - by Industry Vertical
- 5.3.1. IT and Telecom
- 5.3.2. Retail and E-commerce
- 5.3.3. BFSI
- 5.3.4. Media and Entertainment
- 5.3.5. Travel and Hospitality
- 5.3.6. Other Industry Verticals
- 5.4. Market Analysis, Insights and Forecast - by Region
- 5.4.1. North America
- 5.4.2. Europe
- 5.4.3. Asia
- 5.4.4. Australia and New Zealand
- 5.4.5. Latin America
- 5.4.6. Middle East and Africa
- 5.1. Market Analysis, Insights and Forecast - by Type
- 6. North America Catalog Management System Industry Analysis, Insights and Forecast, 2019-2031
- 6.1. Market Analysis, Insights and Forecast - by Type
- 6.1.1. Service Catalogs
- 6.1.2. Product Catalogs
- 6.2. Market Analysis, Insights and Forecast - by Deployment Type
- 6.2.1. Cloud
- 6.2.2. On-Premises
- 6.3. Market Analysis, Insights and Forecast - by Industry Vertical
- 6.3.1. IT and Telecom
- 6.3.2. Retail and E-commerce
- 6.3.3. BFSI
- 6.3.4. Media and Entertainment
- 6.3.5. Travel and Hospitality
- 6.3.6. Other Industry Verticals
- 6.1. Market Analysis, Insights and Forecast - by Type
- 7. Europe Catalog Management System Industry Analysis, Insights and Forecast, 2019-2031
- 7.1. Market Analysis, Insights and Forecast - by Type
- 7.1.1. Service Catalogs
- 7.1.2. Product Catalogs
- 7.2. Market Analysis, Insights and Forecast - by Deployment Type
- 7.2.1. Cloud
- 7.2.2. On-Premises
- 7.3. Market Analysis, Insights and Forecast - by Industry Vertical
- 7.3.1. IT and Telecom
- 7.3.2. Retail and E-commerce
- 7.3.3. BFSI
- 7.3.4. Media and Entertainment
- 7.3.5. Travel and Hospitality
- 7.3.6. Other Industry Verticals
- 7.1. Market Analysis, Insights and Forecast - by Type
- 8. Asia Catalog Management System Industry Analysis, Insights and Forecast, 2019-2031
- 8.1. Market Analysis, Insights and Forecast - by Type
- 8.1.1. Service Catalogs
- 8.1.2. Product Catalogs
- 8.2. Market Analysis, Insights and Forecast - by Deployment Type
- 8.2.1. Cloud
- 8.2.2. On-Premises
- 8.3. Market Analysis, Insights and Forecast - by Industry Vertical
- 8.3.1. IT and Telecom
- 8.3.2. Retail and E-commerce
- 8.3.3. BFSI
- 8.3.4. Media and Entertainment
- 8.3.5. Travel and Hospitality
- 8.3.6. Other Industry Verticals
- 8.1. Market Analysis, Insights and Forecast - by Type
- 9. Australia and New Zealand Catalog Management System Industry Analysis, Insights and Forecast, 2019-2031
- 9.1. Market Analysis, Insights and Forecast - by Type
- 9.1.1. Service Catalogs
- 9.1.2. Product Catalogs
- 9.2. Market Analysis, Insights and Forecast - by Deployment Type
- 9.2.1. Cloud
- 9.2.2. On-Premises
- 9.3. Market Analysis, Insights and Forecast - by Industry Vertical
- 9.3.1. IT and Telecom
- 9.3.2. Retail and E-commerce
- 9.3.3. BFSI
- 9.3.4. Media and Entertainment
- 9.3.5. Travel and Hospitality
- 9.3.6. Other Industry Verticals
- 9.1. Market Analysis, Insights and Forecast - by Type
- 10. Latin America Catalog Management System Industry Analysis, Insights and Forecast, 2019-2031
- 10.1. Market Analysis, Insights and Forecast - by Type
- 10.1.1. Service Catalogs
- 10.1.2. Product Catalogs
- 10.2. Market Analysis, Insights and Forecast - by Deployment Type
- 10.2.1. Cloud
- 10.2.2. On-Premises
- 10.3. Market Analysis, Insights and Forecast - by Industry Vertical
- 10.3.1. IT and Telecom
- 10.3.2. Retail and E-commerce
- 10.3.3. BFSI
- 10.3.4. Media and Entertainment
- 10.3.5. Travel and Hospitality
- 10.3.6. Other Industry Verticals
- 10.1. Market Analysis, Insights and Forecast - by Type
- 11. Middle East and Africa Catalog Management System Industry Analysis, Insights and Forecast, 2019-2031
- 11.1. Market Analysis, Insights and Forecast - by Type
- 11.1.1. Service Catalogs
- 11.1.2. Product Catalogs
- 11.2. Market Analysis, Insights and Forecast - by Deployment Type
- 11.2.1. Cloud
- 11.2.2. On-Premises
- 11.3. Market Analysis, Insights and Forecast - by Industry Vertical
- 11.3.1. IT and Telecom
- 11.3.2. Retail and E-commerce
- 11.3.3. BFSI
- 11.3.4. Media and Entertainment
- 11.3.5. Travel and Hospitality
- 11.3.6. Other Industry Verticals
- 11.1. Market Analysis, Insights and Forecast - by Type
- 12. North America Catalog Management System Industry Analysis, Insights and Forecast, 2019-2031
- 12.1. Market Analysis, Insights and Forecast - By Country/Sub-region
- 12.1.1 United States
- 12.1.2 Canada
- 12.1.3 Mexico
- 13. Europe Catalog Management System Industry Analysis, Insights and Forecast, 2019-2031
- 13.1. Market Analysis, Insights and Forecast - By Country/Sub-region
- 13.1.1 Germany
- 13.1.2 United Kingdom
- 13.1.3 France
- 13.1.4 Spain
- 13.1.5 Italy
- 13.1.6 Spain
- 13.1.7 Belgium
- 13.1.8 Netherland
- 13.1.9 Nordics
- 13.1.10 Rest of Europe
- 14. Asia Pacific Catalog Management System Industry Analysis, Insights and Forecast, 2019-2031
- 14.1. Market Analysis, Insights and Forecast - By Country/Sub-region
- 14.1.1 China
- 14.1.2 Japan
- 14.1.3 India
- 14.1.4 South Korea
- 14.1.5 Southeast Asia
- 14.1.6 Australia
- 14.1.7 Indonesia
- 14.1.8 Phillipes
- 14.1.9 Singapore
- 14.1.10 Thailandc
- 14.1.11 Rest of Asia Pacific
- 15. South America Catalog Management System Industry Analysis, Insights and Forecast, 2019-2031
- 15.1. Market Analysis, Insights and Forecast - By Country/Sub-region
- 15.1.1 Brazil
- 15.1.2 Argentina
- 15.1.3 Peru
- 15.1.4 Chile
- 15.1.5 Colombia
- 15.1.6 Ecuador
- 15.1.7 Venezuela
- 15.1.8 Rest of South America
- 16. North America Catalog Management System Industry Analysis, Insights and Forecast, 2019-2031
- 16.1. Market Analysis, Insights and Forecast - By Country/Sub-region
- 16.1.1 United States
- 16.1.2 Canada
- 16.1.3 Mexico
- 17. MEA Catalog Management System Industry Analysis, Insights and Forecast, 2019-2031
- 17.1. Market Analysis, Insights and Forecast - By Country/Sub-region
- 17.1.1 United Arab Emirates
- 17.1.2 Saudi Arabia
- 17.1.3 South Africa
- 17.1.4 Rest of Middle East and Africa
- 18. Competitive Analysis
- 18.1. Global Market Share Analysis 2024
- 18.2. Company Profiles
- 18.2.1 Broadcom Corporation
- 18.2.1.1. Overview
- 18.2.1.2. Products
- 18.2.1.3. SWOT Analysis
- 18.2.1.4. Recent Developments
- 18.2.1.5. Financials (Based on Availability)
- 18.2.2 Vroozi Inc
- 18.2.2.1. Overview
- 18.2.2.2. Products
- 18.2.2.3. SWOT Analysis
- 18.2.2.4. Recent Developments
- 18.2.2.5. Financials (Based on Availability)
- 18.2.3 Insite Software Solutions Inc
- 18.2.3.1. Overview
- 18.2.3.2. Products
- 18.2.3.3. SWOT Analysis
- 18.2.3.4. Recent Developments
- 18.2.3.5. Financials (Based on Availability)
- 18.2.4 IBM Corporation
- 18.2.4.1. Overview
- 18.2.4.2. Products
- 18.2.4.3. SWOT Analysis
- 18.2.4.4. Recent Developments
- 18.2.4.5. Financials (Based on Availability)
- 18.2.5 Telefonaktiebolaget LM Ericsson
- 18.2.5.1. Overview
- 18.2.5.2. Products
- 18.2.5.3. SWOT Analysis
- 18.2.5.4. Recent Developments
- 18.2.5.5. Financials (Based on Availability)
- 18.2.6 Coupa Software Inc
- 18.2.6.1. Overview
- 18.2.6.2. Products
- 18.2.6.3. SWOT Analysis
- 18.2.6.4. Recent Developments
- 18.2.6.5. Financials (Based on Availability)
- 18.2.7 GEP Worldwide
- 18.2.7.1. Overview
- 18.2.7.2. Products
- 18.2.7.3. SWOT Analysis
- 18.2.7.4. Recent Developments
- 18.2.7.5. Financials (Based on Availability)
- 18.2.8 Amdocs
- 18.2.8.1. Overview
- 18.2.8.2. Products
- 18.2.8.3. SWOT Analysis
- 18.2.8.4. Recent Developments
- 18.2.8.5. Financials (Based on Availability)
- 18.2.9 Fujitsu Limited
- 18.2.9.1. Overview
- 18.2.9.2. Products
- 18.2.9.3. SWOT Analysis
- 18.2.9.4. Recent Developments
- 18.2.9.5. Financials (Based on Availability)
- 18.2.10 Zycus Inc
- 18.2.10.1. Overview
- 18.2.10.2. Products
- 18.2.10.3. SWOT Analysis
- 18.2.10.4. Recent Developments
- 18.2.10.5. Financials (Based on Availability)
- 18.2.11 Sellercloud Inc
- 18.2.11.1. Overview
- 18.2.11.2. Products
- 18.2.11.3. SWOT Analysis
- 18.2.11.4. Recent Developments
- 18.2.11.5. Financials (Based on Availability)
- 18.2.12 ServiceNow Inc
- 18.2.12.1. Overview
- 18.2.12.2. Products
- 18.2.12.3. SWOT Analysis
- 18.2.12.4. Recent Developments
- 18.2.12.5. Financials (Based on Availability)
- 18.2.13 Salsify Inc
- 18.2.13.1. Overview
- 18.2.13.2. Products
- 18.2.13.3. SWOT Analysis
- 18.2.13.4. Recent Developments
- 18.2.13.5. Financials (Based on Availability)
- 18.2.14 Oracle Corporation
- 18.2.14.1. Overview
- 18.2.14.2. Products
- 18.2.14.3. SWOT Analysis
- 18.2.14.4. Recent Developments
- 18.2.14.5. Financials (Based on Availability)
- 18.2.15 Comarch SA
- 18.2.15.1. Overview
- 18.2.15.2. Products
- 18.2.15.3. SWOT Analysis
- 18.2.15.4. Recent Developments
- 18.2.15.5. Financials (Based on Availability)
- 18.2.16 Plytix com Ap
- 18.2.16.1. Overview
- 18.2.16.2. Products
- 18.2.16.3. SWOT Analysis
- 18.2.16.4. Recent Developments
- 18.2.16.5. Financials (Based on Availability)
- 18.2.17 Proactis Holdings Plc
- 18.2.17.1. Overview
- 18.2.17.2. Products
- 18.2.17.3. SWOT Analysis
- 18.2.17.4. Recent Developments
- 18.2.17.5. Financials (Based on Availability)
- 18.2.18 SAP SE
- 18.2.18.1. Overview
- 18.2.18.2. Products
- 18.2.18.3. SWOT Analysis
- 18.2.18.4. Recent Developments
- 18.2.18.5. Financials (Based on Availability)
- 18.2.1 Broadcom Corporation
List of Figures
- Figure 1: Global Catalog Management System Industry Revenue Breakdown (Million, %) by Region 2024 & 2032
- Figure 2: North America Catalog Management System Industry Revenue (Million), by Country 2024 & 2032
- Figure 3: North America Catalog Management System Industry Revenue Share (%), by Country 2024 & 2032
- Figure 4: Europe Catalog Management System Industry Revenue (Million), by Country 2024 & 2032
- Figure 5: Europe Catalog Management System Industry Revenue Share (%), by Country 2024 & 2032
- Figure 6: Asia Pacific Catalog Management System Industry Revenue (Million), by Country 2024 & 2032
- Figure 7: Asia Pacific Catalog Management System Industry Revenue Share (%), by Country 2024 & 2032
- Figure 8: South America Catalog Management System Industry Revenue (Million), by Country 2024 & 2032
- Figure 9: South America Catalog Management System Industry Revenue Share (%), by Country 2024 & 2032
- Figure 10: North America Catalog Management System Industry Revenue (Million), by Country 2024 & 2032
- Figure 11: North America Catalog Management System Industry Revenue Share (%), by Country 2024 & 2032
- Figure 12: MEA Catalog Management System Industry Revenue (Million), by Country 2024 & 2032
- Figure 13: MEA Catalog Management System Industry Revenue Share (%), by Country 2024 & 2032
- Figure 14: North America Catalog Management System Industry Revenue (Million), by Type 2024 & 2032
- Figure 15: North America Catalog Management System Industry Revenue Share (%), by Type 2024 & 2032
- Figure 16: North America Catalog Management System Industry Revenue (Million), by Deployment Type 2024 & 2032
- Figure 17: North America Catalog Management System Industry Revenue Share (%), by Deployment Type 2024 & 2032
- Figure 18: North America Catalog Management System Industry Revenue (Million), by Industry Vertical 2024 & 2032
- Figure 19: North America Catalog Management System Industry Revenue Share (%), by Industry Vertical 2024 & 2032
- Figure 20: North America Catalog Management System Industry Revenue (Million), by Country 2024 & 2032
- Figure 21: North America Catalog Management System Industry Revenue Share (%), by Country 2024 & 2032
- Figure 22: Europe Catalog Management System Industry Revenue (Million), by Type 2024 & 2032
- Figure 23: Europe Catalog Management System Industry Revenue Share (%), by Type 2024 & 2032
- Figure 24: Europe Catalog Management System Industry Revenue (Million), by Deployment Type 2024 & 2032
- Figure 25: Europe Catalog Management System Industry Revenue Share (%), by Deployment Type 2024 & 2032
- Figure 26: Europe Catalog Management System Industry Revenue (Million), by Industry Vertical 2024 & 2032
- Figure 27: Europe Catalog Management System Industry Revenue Share (%), by Industry Vertical 2024 & 2032
- Figure 28: Europe Catalog Management System Industry Revenue (Million), by Country 2024 & 2032
- Figure 29: Europe Catalog Management System Industry Revenue Share (%), by Country 2024 & 2032
- Figure 30: Asia Catalog Management System Industry Revenue (Million), by Type 2024 & 2032
- Figure 31: Asia Catalog Management System Industry Revenue Share (%), by Type 2024 & 2032
- Figure 32: Asia Catalog Management System Industry Revenue (Million), by Deployment Type 2024 & 2032
- Figure 33: Asia Catalog Management System Industry Revenue Share (%), by Deployment Type 2024 & 2032
- Figure 34: Asia Catalog Management System Industry Revenue (Million), by Industry Vertical 2024 & 2032
- Figure 35: Asia Catalog Management System Industry Revenue Share (%), by Industry Vertical 2024 & 2032
- Figure 36: Asia Catalog Management System Industry Revenue (Million), by Country 2024 & 2032
- Figure 37: Asia Catalog Management System Industry Revenue Share (%), by Country 2024 & 2032
- Figure 38: Australia and New Zealand Catalog Management System Industry Revenue (Million), by Type 2024 & 2032
- Figure 39: Australia and New Zealand Catalog Management System Industry Revenue Share (%), by Type 2024 & 2032
- Figure 40: Australia and New Zealand Catalog Management System Industry Revenue (Million), by Deployment Type 2024 & 2032
- Figure 41: Australia and New Zealand Catalog Management System Industry Revenue Share (%), by Deployment Type 2024 & 2032
- Figure 42: Australia and New Zealand Catalog Management System Industry Revenue (Million), by Industry Vertical 2024 & 2032
- Figure 43: Australia and New Zealand Catalog Management System Industry Revenue Share (%), by Industry Vertical 2024 & 2032
- Figure 44: Australia and New Zealand Catalog Management System Industry Revenue (Million), by Country 2024 & 2032
- Figure 45: Australia and New Zealand Catalog Management System Industry Revenue Share (%), by Country 2024 & 2032
- Figure 46: Latin America Catalog Management System Industry Revenue (Million), by Type 2024 & 2032
- Figure 47: Latin America Catalog Management System Industry Revenue Share (%), by Type 2024 & 2032
- Figure 48: Latin America Catalog Management System Industry Revenue (Million), by Deployment Type 2024 & 2032
- Figure 49: Latin America Catalog Management System Industry Revenue Share (%), by Deployment Type 2024 & 2032
- Figure 50: Latin America Catalog Management System Industry Revenue (Million), by Industry Vertical 2024 & 2032
- Figure 51: Latin America Catalog Management System Industry Revenue Share (%), by Industry Vertical 2024 & 2032
- Figure 52: Latin America Catalog Management System Industry Revenue (Million), by Country 2024 & 2032
- Figure 53: Latin America Catalog Management System Industry Revenue Share (%), by Country 2024 & 2032
- Figure 54: Middle East and Africa Catalog Management System Industry Revenue (Million), by Type 2024 & 2032
- Figure 55: Middle East and Africa Catalog Management System Industry Revenue Share (%), by Type 2024 & 2032
- Figure 56: Middle East and Africa Catalog Management System Industry Revenue (Million), by Deployment Type 2024 & 2032
- Figure 57: Middle East and Africa Catalog Management System Industry Revenue Share (%), by Deployment Type 2024 & 2032
- Figure 58: Middle East and Africa Catalog Management System Industry Revenue (Million), by Industry Vertical 2024 & 2032
- Figure 59: Middle East and Africa Catalog Management System Industry Revenue Share (%), by Industry Vertical 2024 & 2032
- Figure 60: Middle East and Africa Catalog Management System Industry Revenue (Million), by Country 2024 & 2032
- Figure 61: Middle East and Africa Catalog Management System Industry Revenue Share (%), by Country 2024 & 2032
List of Tables
- Table 1: Global Catalog Management System Industry Revenue Million Forecast, by Region 2019 & 2032
- Table 2: Global Catalog Management System Industry Revenue Million Forecast, by Type 2019 & 2032
- Table 3: Global Catalog Management System Industry Revenue Million Forecast, by Deployment Type 2019 & 2032
- Table 4: Global Catalog Management System Industry Revenue Million Forecast, by Industry Vertical 2019 & 2032
- Table 5: Global Catalog Management System Industry Revenue Million Forecast, by Region 2019 & 2032
- Table 6: Global Catalog Management System Industry Revenue Million Forecast, by Country 2019 & 2032
- Table 7: United States Catalog Management System Industry Revenue (Million) Forecast, by Application 2019 & 2032
- Table 8: Canada Catalog Management System Industry Revenue (Million) Forecast, by Application 2019 & 2032
- Table 9: Mexico Catalog Management System Industry Revenue (Million) Forecast, by Application 2019 & 2032
- Table 10: Global Catalog Management System Industry Revenue Million Forecast, by Country 2019 & 2032
- Table 11: Germany Catalog Management System Industry Revenue (Million) Forecast, by Application 2019 & 2032
- Table 12: United Kingdom Catalog Management System Industry Revenue (Million) Forecast, by Application 2019 & 2032
- Table 13: France Catalog Management System Industry Revenue (Million) Forecast, by Application 2019 & 2032
- Table 14: Spain Catalog Management System Industry Revenue (Million) Forecast, by Application 2019 & 2032
- Table 15: Italy Catalog Management System Industry Revenue (Million) Forecast, by Application 2019 & 2032
- Table 16: Spain Catalog Management System Industry Revenue (Million) Forecast, by Application 2019 & 2032
- Table 17: Belgium Catalog Management System Industry Revenue (Million) Forecast, by Application 2019 & 2032
- Table 18: Netherland Catalog Management System Industry Revenue (Million) Forecast, by Application 2019 & 2032
- Table 19: Nordics Catalog Management System Industry Revenue (Million) Forecast, by Application 2019 & 2032
- Table 20: Rest of Europe Catalog Management System Industry Revenue (Million) Forecast, by Application 2019 & 2032
- Table 21: Global Catalog Management System Industry Revenue Million Forecast, by Country 2019 & 2032
- Table 22: China Catalog Management System Industry Revenue (Million) Forecast, by Application 2019 & 2032
- Table 23: Japan Catalog Management System Industry Revenue (Million) Forecast, by Application 2019 & 2032
- Table 24: India Catalog Management System Industry Revenue (Million) Forecast, by Application 2019 & 2032
- Table 25: South Korea Catalog Management System Industry Revenue (Million) Forecast, by Application 2019 & 2032
- Table 26: Southeast Asia Catalog Management System Industry Revenue (Million) Forecast, by Application 2019 & 2032
- Table 27: Australia Catalog Management System Industry Revenue (Million) Forecast, by Application 2019 & 2032
- Table 28: Indonesia Catalog Management System Industry Revenue (Million) Forecast, by Application 2019 & 2032
- Table 29: Phillipes Catalog Management System Industry Revenue (Million) Forecast, by Application 2019 & 2032
- Table 30: Singapore Catalog Management System Industry Revenue (Million) Forecast, by Application 2019 & 2032
- Table 31: Thailandc Catalog Management System Industry Revenue (Million) Forecast, by Application 2019 & 2032
- Table 32: Rest of Asia Pacific Catalog Management System Industry Revenue (Million) Forecast, by Application 2019 & 2032
- Table 33: Global Catalog Management System Industry Revenue Million Forecast, by Country 2019 & 2032
- Table 34: Brazil Catalog Management System Industry Revenue (Million) Forecast, by Application 2019 & 2032
- Table 35: Argentina Catalog Management System Industry Revenue (Million) Forecast, by Application 2019 & 2032
- Table 36: Peru Catalog Management System Industry Revenue (Million) Forecast, by Application 2019 & 2032
- Table 37: Chile Catalog Management System Industry Revenue (Million) Forecast, by Application 2019 & 2032
- Table 38: Colombia Catalog Management System Industry Revenue (Million) Forecast, by Application 2019 & 2032
- Table 39: Ecuador Catalog Management System Industry Revenue (Million) Forecast, by Application 2019 & 2032
- Table 40: Venezuela Catalog Management System Industry Revenue (Million) Forecast, by Application 2019 & 2032
- Table 41: Rest of South America Catalog Management System Industry Revenue (Million) Forecast, by Application 2019 & 2032
- Table 42: Global Catalog Management System Industry Revenue Million Forecast, by Country 2019 & 2032
- Table 43: United States Catalog Management System Industry Revenue (Million) Forecast, by Application 2019 & 2032
- Table 44: Canada Catalog Management System Industry Revenue (Million) Forecast, by Application 2019 & 2032
- Table 45: Mexico Catalog Management System Industry Revenue (Million) Forecast, by Application 2019 & 2032
- Table 46: Global Catalog Management System Industry Revenue Million Forecast, by Country 2019 & 2032
- Table 47: United Arab Emirates Catalog Management System Industry Revenue (Million) Forecast, by Application 2019 & 2032
- Table 48: Saudi Arabia Catalog Management System Industry Revenue (Million) Forecast, by Application 2019 & 2032
- Table 49: South Africa Catalog Management System Industry Revenue (Million) Forecast, by Application 2019 & 2032
- Table 50: Rest of Middle East and Africa Catalog Management System Industry Revenue (Million) Forecast, by Application 2019 & 2032
- Table 51: Global Catalog Management System Industry Revenue Million Forecast, by Type 2019 & 2032
- Table 52: Global Catalog Management System Industry Revenue Million Forecast, by Deployment Type 2019 & 2032
- Table 53: Global Catalog Management System Industry Revenue Million Forecast, by Industry Vertical 2019 & 2032
- Table 54: Global Catalog Management System Industry Revenue Million Forecast, by Country 2019 & 2032
- Table 55: Global Catalog Management System Industry Revenue Million Forecast, by Type 2019 & 2032
- Table 56: Global Catalog Management System Industry Revenue Million Forecast, by Deployment Type 2019 & 2032
- Table 57: Global Catalog Management System Industry Revenue Million Forecast, by Industry Vertical 2019 & 2032
- Table 58: Global Catalog Management System Industry Revenue Million Forecast, by Country 2019 & 2032
- Table 59: Global Catalog Management System Industry Revenue Million Forecast, by Type 2019 & 2032
- Table 60: Global Catalog Management System Industry Revenue Million Forecast, by Deployment Type 2019 & 2032
- Table 61: Global Catalog Management System Industry Revenue Million Forecast, by Industry Vertical 2019 & 2032
- Table 62: Global Catalog Management System Industry Revenue Million Forecast, by Country 2019 & 2032
- Table 63: Global Catalog Management System Industry Revenue Million Forecast, by Type 2019 & 2032
- Table 64: Global Catalog Management System Industry Revenue Million Forecast, by Deployment Type 2019 & 2032
- Table 65: Global Catalog Management System Industry Revenue Million Forecast, by Industry Vertical 2019 & 2032
- Table 66: Global Catalog Management System Industry Revenue Million Forecast, by Country 2019 & 2032
- Table 67: Global Catalog Management System Industry Revenue Million Forecast, by Type 2019 & 2032
- Table 68: Global Catalog Management System Industry Revenue Million Forecast, by Deployment Type 2019 & 2032
- Table 69: Global Catalog Management System Industry Revenue Million Forecast, by Industry Vertical 2019 & 2032
- Table 70: Global Catalog Management System Industry Revenue Million Forecast, by Country 2019 & 2032
- Table 71: Global Catalog Management System Industry Revenue Million Forecast, by Type 2019 & 2032
- Table 72: Global Catalog Management System Industry Revenue Million Forecast, by Deployment Type 2019 & 2032
- Table 73: Global Catalog Management System Industry Revenue Million Forecast, by Industry Vertical 2019 & 2032
- Table 74: Global Catalog Management System Industry Revenue Million Forecast, by Country 2019 & 2032
Frequently Asked Questions
1. What is the projected Compound Annual Growth Rate (CAGR) of the Catalog Management System Industry?
The projected CAGR is approximately 9.68%.
2. Which companies are prominent players in the Catalog Management System Industry?
Key companies in the market include Broadcom Corporation, Vroozi Inc, Insite Software Solutions Inc, IBM Corporation, Telefonaktiebolaget LM Ericsson, Coupa Software Inc, GEP Worldwide, Amdocs, Fujitsu Limited, Zycus Inc, Sellercloud Inc, ServiceNow Inc, Salsify Inc, Oracle Corporation, Comarch SA, Plytix com Ap, Proactis Holdings Plc, SAP SE.
3. What are the main segments of the Catalog Management System Industry?
The market segments include Type, Deployment Type, Industry Vertical.
4. Can you provide details about the market size?
The market size is estimated to be USD 1.96 Million as of 2022.
5. What are some drivers contributing to market growth?
Growing Digital Transformation Initiatives; Necessity of Centralized Systems for Improved Marketing and Selling.
6. What are the notable trends driving market growth?
Growing Digital Transformation Initiatives Drives the Market.
7. Are there any restraints impacting market growth?
Privacy and Security Concerns.
8. Can you provide examples of recent developments in the market?
N/A
9. What pricing options are available for accessing the report?
Pricing options include single-user, multi-user, and enterprise licenses priced at USD 4750, USD 5250, and USD 8750 respectively.
10. Is the market size provided in terms of value or volume?
The market size is provided in terms of value, measured in Million.
11. Are there any specific market keywords associated with the report?
Yes, the market keyword associated with the report is "Catalog Management System Industry," which aids in identifying and referencing the specific market segment covered.
12. How do I determine which pricing option suits my needs best?
The pricing options vary based on user requirements and access needs. Individual users may opt for single-user licenses, while businesses requiring broader access may choose multi-user or enterprise licenses for cost-effective access to the report.
13. Are there any additional resources or data provided in the Catalog Management System Industry report?
While the report offers comprehensive insights, it's advisable to review the specific contents or supplementary materials provided to ascertain if additional resources or data are available.
14. How can I stay updated on further developments or reports in the Catalog Management System Industry?
To stay informed about further developments, trends, and reports in the Catalog Management System Industry, consider subscribing to industry newsletters, following relevant companies and organizations, or regularly checking reputable industry news sources and publications.
Methodology
Step 1 - Identification of Relevant Samples Size from Population Database


Step 2 - Approaches for Defining Global Market Size (Value, Volume* & Price*)

Note*: In applicable scenarios
Step 3 - Data Sources
Primary Research
- Web Analytics
- Survey Reports
- Research Institute
- Latest Research Reports
- Opinion Leaders
Secondary Research
- Annual Reports
- White Paper
- Latest Press Release
- Industry Association
- Paid Database
- Investor Presentations

Step 4 - Data Triangulation
Involves using different sources of information in order to increase the validity of a study
These sources are likely to be stakeholders in a program - participants, other researchers, program staff, other community members, and so on.
Then we put all data in single framework & apply various statistical tools to find out the dynamic on the market.
During the analysis stage, feedback from the stakeholder groups would be compared to determine areas of agreement as well as areas of divergence


