

Key Insights
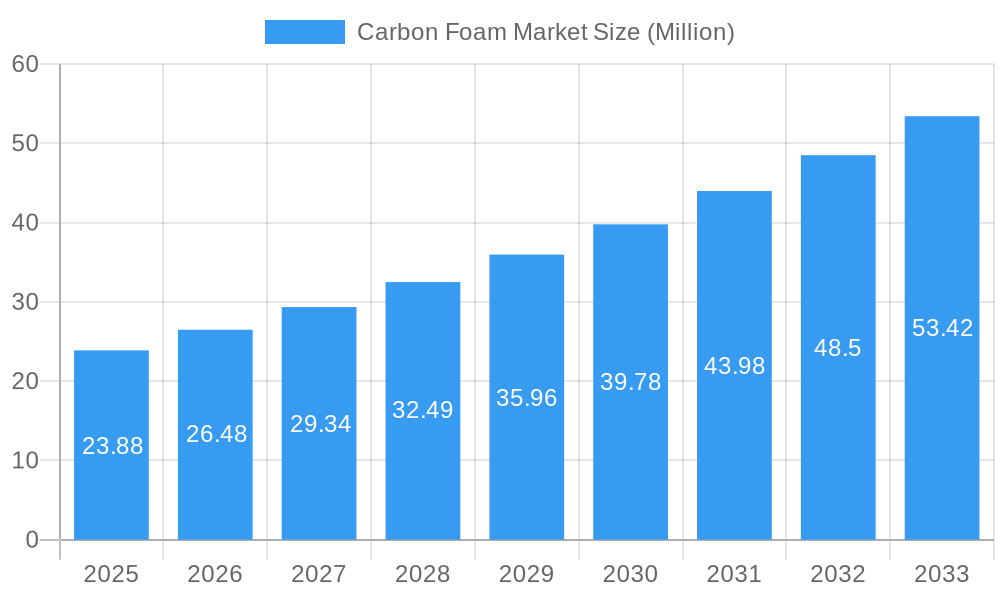
The global carbon foam market is experiencing robust growth, projected to reach $23.88 million in 2025 and maintain a Compound Annual Growth Rate (CAGR) of 10.73% from 2025 to 2033. This expansion is driven by increasing demand across diverse sectors, particularly aerospace and defense, where the lightweight yet strong nature of carbon foam is highly valued for reducing weight and improving fuel efficiency. The automotive industry is also a significant contributor, with manufacturers seeking innovative materials to enhance vehicle performance and reduce emissions. Further growth is fueled by advancements in production techniques leading to improved material properties and cost reductions, along with the growing adoption of carbon foam in building and construction for insulation and structural applications. The graphitic segment currently dominates the market due to superior strength and thermal properties, but the non-graphitic segment is expected to witness significant growth driven by its cost-effectiveness in certain applications. Challenges include the relatively high production cost compared to traditional materials, which could limit widespread adoption in price-sensitive markets. However, ongoing research and development efforts focused on improving manufacturing processes and exploring new applications are expected to mitigate this restraint, fostering continued market expansion throughout the forecast period.
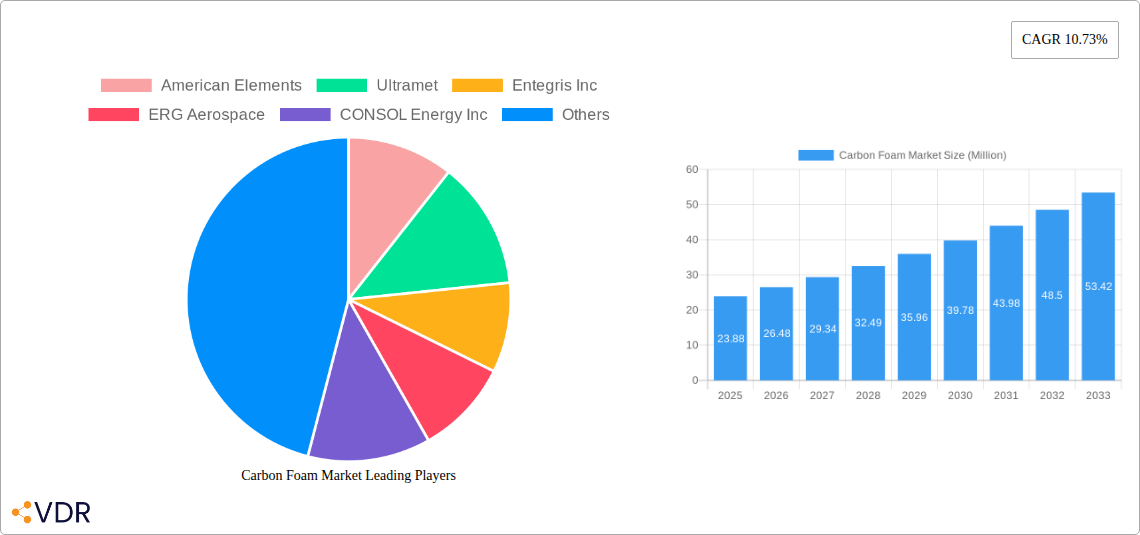
Carbon Foam Market Market Size (In Million)
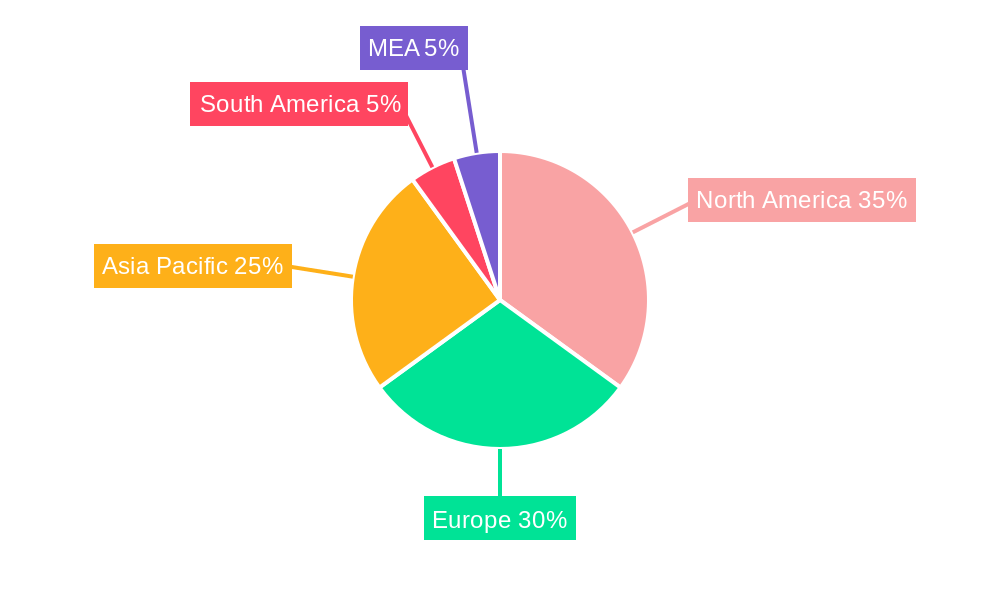
The regional distribution of the carbon foam market reflects the concentration of key industries and technological advancements. North America and Europe currently hold significant market shares, driven by strong aerospace and automotive sectors. However, the Asia-Pacific region is poised for substantial growth, fueled by increasing industrialization and infrastructure development in countries like China and India. This rapid expansion is likely to shift the regional landscape over the next decade. The South American and MEA (Middle East and Africa) regions, while currently holding smaller market shares, present emerging opportunities as these regions invest in infrastructure and industrial development. Competitive dynamics are shaped by a blend of established players with extensive manufacturing capabilities and emerging companies focused on innovation and niche applications.
Carbon Foam Market Company Market Share
Carbon Foam Market: A Comprehensive Report (2019-2033)
This in-depth report provides a comprehensive analysis of the Carbon Foam Market, encompassing market dynamics, growth trends, regional analysis, product landscape, key players, and future outlook. The report covers the period 2019-2033, with a base year of 2025 and a forecast period of 2025-2033. The market is segmented by type (Graphitic, Non-graphitic) and end-user industry (Aerospace & Defense, Building & Construction, Automotive, Electrical, Industrial, Other). The total market size is projected to reach xx Million by 2033.
Carbon Foam Market Market Dynamics & Structure
The Carbon Foam market, valued at xx Million in 2025, is characterized by moderate concentration, with key players holding significant market shares. Technological innovation, particularly in material synthesis and application-specific designs, is a major driver. Stringent environmental regulations are also shaping market dynamics, encouraging the development of sustainable production methods. Competitive substitutes, such as other lightweight materials, pose challenges, requiring continuous innovation to maintain market competitiveness. The M&A landscape in this sector has seen xx deals in the past five years, with a focus on expanding product portfolios and geographic reach.
- Market Concentration: Moderately concentrated, with top 5 players holding xx% market share.
- Technological Innovation: Focus on improving material properties (strength, density, thermal conductivity) and expanding applications.
- Regulatory Framework: Increasing emphasis on sustainability and environmental impact assessments.
- Competitive Substitutes: Lightweight polymers, metal foams, and composites pose competition.
- End-User Demographics: Growth driven by increasing demand from aerospace, automotive, and construction sectors.
- M&A Trends: Consolidation through acquisitions aiming for technological advancements and market expansion.
Carbon Foam Market Growth Trends & Insights
The Carbon Foam market exhibits a robust growth trajectory, exhibiting a CAGR of xx% during the forecast period (2025-2033). This growth is driven by increasing demand from diverse sectors, adoption of advanced manufacturing techniques, and the development of novel applications. Technological disruptions, such as the use of novel raw materials and advanced synthesis techniques, are accelerating market expansion. Consumer preferences are shifting towards lightweight, high-performance materials with improved sustainability attributes, benefiting the Carbon Foam market. Market penetration in key end-user segments is expected to increase significantly in the next decade.
Dominant Regions, Countries, or Segments in Carbon Foam Market
The Aerospace & Defense sector represents the largest segment within the Carbon Foam market, accounting for xx% of the total market value in 2025, followed by Building & Construction at xx%. The North American region holds the largest market share, driven by robust aerospace and automotive industries and substantial investments in infrastructure development. Asia-Pacific is projected to experience the fastest growth, fueled by economic expansion and increased construction activity. Within types, Graphitic carbon foam holds a larger market share due to its superior properties, though Non-graphitic foams are gaining traction in niche applications.
- Key Drivers (North America): Strong aerospace and automotive industries, advanced manufacturing capabilities, substantial R&D investments.
- Key Drivers (Asia-Pacific): Rapid economic growth, rising infrastructure spending, increasing adoption in construction and automotive sectors.
- Segment Dominance: Aerospace & Defense (largest segment by value), Graphitic carbon foam (largest by type).
Carbon Foam Market Product Landscape
Carbon foam products are characterized by their unique combination of low density, high porosity, and excellent thermal and electrical properties. Continuous innovations focus on enhancing mechanical strength, tailoring porosity for specific applications, and developing cost-effective manufacturing processes. The unique selling propositions include lightweighting, energy absorption, and thermal insulation, making them highly desirable across various industries. Recent advancements have led to improved material consistency and surface treatments.
Key Drivers, Barriers & Challenges in Carbon Foam Market
Key Drivers: The increasing demand for lightweight materials in the automotive and aerospace industries, the growing need for advanced thermal management solutions, and stringent environmental regulations favoring sustainable materials are key drivers for the Carbon Foam market.
Challenges: High production costs, the complex manufacturing process, and limited availability of suitable raw materials present significant challenges. Competition from alternative materials also creates pressure on pricing and innovation. The current global supply chain disruptions related to raw material sourcing also pose a significant challenge, creating production bottlenecks and cost increases. Estimated impact of supply chain issues is a xx% increase in production costs.
Emerging Opportunities in Carbon Foam Market
Untapped market opportunities exist in emerging economies, particularly in developing nations experiencing rapid infrastructure development. Innovative applications, such as advanced filtration systems, biomedical implants, and energy storage solutions, hold significant growth potential. The evolving preferences for sustainable and eco-friendly materials further expand market prospects.
Growth Accelerators in the Carbon Foam Market Industry
Technological breakthroughs in material synthesis, leading to improved material properties and cost-effectiveness, are significant growth accelerators. Strategic partnerships between material suppliers and end-users facilitate product development and market penetration. Expansion into new applications and markets, particularly in emerging economies, will further propel market growth.
Key Players Shaping the Carbon Foam Market Market
- American Elements
- Ultramet
- Entegris Inc
- ERG Aerospace
- CONSOL Energy Inc
- Carbon-Core Corporation
- Xiamen Zopin New Material Limited
- Koppers Inc
- Firefly International Energy
Notable Milestones in Carbon Foam Market Sector
- November 2023: Scientists from the Institute of Catalysts of the Siberian branch of the Russian Academy of Sciences developed a carbon foam from oil refining waste, eliminating the need for foaming agents. This breakthrough has the potential to significantly reduce production costs and enhance sustainability.
In-Depth Carbon Foam Market Market Outlook
The Carbon Foam market is poised for significant growth over the forecast period, driven by continuous technological advancements, expanding applications, and increasing demand from key industries. Strategic partnerships, market expansions into emerging economies, and investments in R&D will further enhance market prospects, creating lucrative opportunities for industry players. The market is expected to maintain strong momentum throughout the forecast period, creating considerable value for stakeholders.
Carbon Foam Market Segmentation
-
1. Type
- 1.1. Graphitic
- 1.2. Non-graphitic
-
2. End-user Industry
- 2.1. Aerospace and Defense
- 2.2. Building and Construction
- 2.3. Automotive
- 2.4. Electrical
- 2.5. Industrial
- 2.6. Other End-user Industries
Carbon Foam Market Segmentation By Geography
-
1. Asia Pacific
- 1.1. China
- 1.2. India
- 1.3. Japan
- 1.4. South Korea
- 1.5. Malaysia
- 1.6. Thailand
- 1.7. Indonesia
- 1.8. Vietnam
- 1.9. Rest of Asia Pacific
-
2. North America
- 2.1. United States
- 2.2. Canada
- 2.3. Mexico
-
3. Europe
- 3.1. Germany
- 3.2. United Kingdom
- 3.3. France
- 3.4. Italy
- 3.5. Spain
- 3.6. Nordic
- 3.7. Turkey
- 3.8. Russia
- 3.9. Rest of Europe
-
4. South America
- 4.1. Brazil
- 4.2. Argentina
- 4.3. Rest of South America
-
5. Middle East and Africa
- 5.1. Saudi Arabia
- 5.2. South Africa
- 5.3. Rest of Middle East and Africa
Carbon Foam Market Regional Market Share
Geographic Coverage of Carbon Foam Market
Carbon Foam Market REPORT HIGHLIGHTS
| Aspects | Details |
|---|---|
| Study Period | 2020-2034 |
| Base Year | 2025 |
| Estimated Year | 2026 |
| Forecast Period | 2026-2034 |
| Historical Period | 2020-2025 |
| Growth Rate | CAGR of 10.73% from 2020-2034 |
| Segmentation |
|
Table of Contents
- 1. Introduction
- 1.1. Research Scope
- 1.2. Market Segmentation
- 1.3. Research Objective
- 1.4. Definitions and Assumptions
- 2. Executive Summary
- 2.1. Market Snapshot
- 3. Market Dynamics
- 3.1. Market Drivers
- 3.2. Market Restrains
- 3.3. Market Trends
- 3.4. Market Opportunities
- 4. Market Factor Analysis
- 4.1. Porters Five Forces
- 4.1.1. Bargaining Power of Suppliers
- 4.1.2. Bargaining Power of Buyers
- 4.1.3. Threat of New Entrants
- 4.1.4. Threat of Substitutes
- 4.1.5. Competitive Rivalry
- 4.2. PESTEL analysis
- 4.3. BCG Analysis
- 4.3.1. Stars (High Growth, High Market Share)
- 4.3.2. Cash Cows (Low Growth, High Market Share)
- 4.3.3. Question Mark (High Growth, Low Market Share)
- 4.3.4. Dogs (Low Growth, Low Market Share)
- 4.4. Ansoff Matrix Analysis
- 4.5. Supply Chain Analysis
- 4.6. Regulatory Landscape
- 4.7. Current Market Potential and Opportunity Assessment (TAM–SAM–SOM Framework)
- 4.8. VDR Analyst Note
- 4.1. Porters Five Forces
- 5. Market Analysis, Insights and Forecast 2021-2033
- 5.1. Market Analysis, Insights and Forecast - by Type
- 5.1.1. Graphitic
- 5.1.2. Non-graphitic
- 5.2. Market Analysis, Insights and Forecast - by End-user Industry
- 5.2.1. Aerospace and Defense
- 5.2.2. Building and Construction
- 5.2.3. Automotive
- 5.2.4. Electrical
- 5.2.5. Industrial
- 5.2.6. Other End-user Industries
- 5.3. Market Analysis, Insights and Forecast - by Region
- 5.3.1. Asia Pacific
- 5.3.2. North America
- 5.3.3. Europe
- 5.3.4. South America
- 5.3.5. Middle East and Africa
- 5.1. Market Analysis, Insights and Forecast - by Type
- 6. Global Carbon Foam Market Analysis, Insights and Forecast, 2021-2033
- 6.1. Market Analysis, Insights and Forecast - by Type
- 6.1.1. Graphitic
- 6.1.2. Non-graphitic
- 6.2. Market Analysis, Insights and Forecast - by End-user Industry
- 6.2.1. Aerospace and Defense
- 6.2.2. Building and Construction
- 6.2.3. Automotive
- 6.2.4. Electrical
- 6.2.5. Industrial
- 6.2.6. Other End-user Industries
- 6.1. Market Analysis, Insights and Forecast - by Type
- 7. Asia Pacific Carbon Foam Market Analysis, Insights and Forecast, 2021-2033
- 7.1. Market Analysis, Insights and Forecast - by Type
- 7.1.1. Graphitic
- 7.1.2. Non-graphitic
- 7.2. Market Analysis, Insights and Forecast - by End-user Industry
- 7.2.1. Aerospace and Defense
- 7.2.2. Building and Construction
- 7.2.3. Automotive
- 7.2.4. Electrical
- 7.2.5. Industrial
- 7.2.6. Other End-user Industries
- 7.1. Market Analysis, Insights and Forecast - by Type
- 8. North America Carbon Foam Market Analysis, Insights and Forecast, 2021-2033
- 8.1. Market Analysis, Insights and Forecast - by Type
- 8.1.1. Graphitic
- 8.1.2. Non-graphitic
- 8.2. Market Analysis, Insights and Forecast - by End-user Industry
- 8.2.1. Aerospace and Defense
- 8.2.2. Building and Construction
- 8.2.3. Automotive
- 8.2.4. Electrical
- 8.2.5. Industrial
- 8.2.6. Other End-user Industries
- 8.1. Market Analysis, Insights and Forecast - by Type
- 9. Europe Carbon Foam Market Analysis, Insights and Forecast, 2021-2033
- 9.1. Market Analysis, Insights and Forecast - by Type
- 9.1.1. Graphitic
- 9.1.2. Non-graphitic
- 9.2. Market Analysis, Insights and Forecast - by End-user Industry
- 9.2.1. Aerospace and Defense
- 9.2.2. Building and Construction
- 9.2.3. Automotive
- 9.2.4. Electrical
- 9.2.5. Industrial
- 9.2.6. Other End-user Industries
- 9.1. Market Analysis, Insights and Forecast - by Type
- 10. South America Carbon Foam Market Analysis, Insights and Forecast, 2021-2033
- 10.1. Market Analysis, Insights and Forecast - by Type
- 10.1.1. Graphitic
- 10.1.2. Non-graphitic
- 10.2. Market Analysis, Insights and Forecast - by End-user Industry
- 10.2.1. Aerospace and Defense
- 10.2.2. Building and Construction
- 10.2.3. Automotive
- 10.2.4. Electrical
- 10.2.5. Industrial
- 10.2.6. Other End-user Industries
- 10.1. Market Analysis, Insights and Forecast - by Type
- 11. Middle East and Africa Carbon Foam Market Analysis, Insights and Forecast, 2021-2033
- 11.1. Market Analysis, Insights and Forecast - by Type
- 11.1.1. Graphitic
- 11.1.2. Non-graphitic
- 11.2. Market Analysis, Insights and Forecast - by End-user Industry
- 11.2.1. Aerospace and Defense
- 11.2.2. Building and Construction
- 11.2.3. Automotive
- 11.2.4. Electrical
- 11.2.5. Industrial
- 11.2.6. Other End-user Industries
- 11.1. Market Analysis, Insights and Forecast - by Type
- 12. Competitive Analysis
- 12.1. Company Profiles
- 12.1.1 American Elements
- 12.1.1.1. Company Overview
- 12.1.1.2. Products
- 12.1.1.3. Company Financials
- 12.1.1.4. SWOT Analysis
- 12.1.2 Ultramet
- 12.1.2.1. Company Overview
- 12.1.2.2. Products
- 12.1.2.3. Company Financials
- 12.1.2.4. SWOT Analysis
- 12.1.3 Entegris Inc
- 12.1.3.1. Company Overview
- 12.1.3.2. Products
- 12.1.3.3. Company Financials
- 12.1.3.4. SWOT Analysis
- 12.1.4 ERG Aerospace
- 12.1.4.1. Company Overview
- 12.1.4.2. Products
- 12.1.4.3. Company Financials
- 12.1.4.4. SWOT Analysis
- 12.1.5 CONSOL Energy Inc
- 12.1.5.1. Company Overview
- 12.1.5.2. Products
- 12.1.5.3. Company Financials
- 12.1.5.4. SWOT Analysis
- 12.1.6 Carbon-Core Corporation
- 12.1.6.1. Company Overview
- 12.1.6.2. Products
- 12.1.6.3. Company Financials
- 12.1.6.4. SWOT Analysis
- 12.1.7 Xiamen Zopin New Material Limited
- 12.1.7.1. Company Overview
- 12.1.7.2. Products
- 12.1.7.3. Company Financials
- 12.1.7.4. SWOT Analysis
- 12.1.8 Koppers Inc
- 12.1.8.1. Company Overview
- 12.1.8.2. Products
- 12.1.8.3. Company Financials
- 12.1.8.4. SWOT Analysis
- 12.1.9 Firefly International Energy
- 12.1.9.1. Company Overview
- 12.1.9.2. Products
- 12.1.9.3. Company Financials
- 12.1.9.4. SWOT Analysis
- 12.1.1 American Elements
- 12.2. Market Entropy
- 12.2.1 Company's Key Areas Served
- 12.2.2 Recent Developments
- 12.3. Company Market Share Analysis 2025
- 12.3.1 Top 5 Companies Market Share Analysis
- 12.3.2 Top 3 Companies Market Share Analysis
- 12.4. List of Potential Customers
- 13. Research Methodology
List of Figures
- Figure 1: Global Carbon Foam Market Revenue Breakdown (Million, %) by Region 2025 & 2033
- Figure 2: Global Carbon Foam Market Volume Breakdown (Square Meters, %) by Region 2025 & 2033
- Figure 3: Asia Pacific Carbon Foam Market Revenue (Million), by Type 2025 & 2033
- Figure 4: Asia Pacific Carbon Foam Market Volume (Square Meters), by Type 2025 & 2033
- Figure 5: Asia Pacific Carbon Foam Market Revenue Share (%), by Type 2025 & 2033
- Figure 6: Asia Pacific Carbon Foam Market Volume Share (%), by Type 2025 & 2033
- Figure 7: Asia Pacific Carbon Foam Market Revenue (Million), by End-user Industry 2025 & 2033
- Figure 8: Asia Pacific Carbon Foam Market Volume (Square Meters), by End-user Industry 2025 & 2033
- Figure 9: Asia Pacific Carbon Foam Market Revenue Share (%), by End-user Industry 2025 & 2033
- Figure 10: Asia Pacific Carbon Foam Market Volume Share (%), by End-user Industry 2025 & 2033
- Figure 11: Asia Pacific Carbon Foam Market Revenue (Million), by Country 2025 & 2033
- Figure 12: Asia Pacific Carbon Foam Market Volume (Square Meters), by Country 2025 & 2033
- Figure 13: Asia Pacific Carbon Foam Market Revenue Share (%), by Country 2025 & 2033
- Figure 14: Asia Pacific Carbon Foam Market Volume Share (%), by Country 2025 & 2033
- Figure 15: North America Carbon Foam Market Revenue (Million), by Type 2025 & 2033
- Figure 16: North America Carbon Foam Market Volume (Square Meters), by Type 2025 & 2033
- Figure 17: North America Carbon Foam Market Revenue Share (%), by Type 2025 & 2033
- Figure 18: North America Carbon Foam Market Volume Share (%), by Type 2025 & 2033
- Figure 19: North America Carbon Foam Market Revenue (Million), by End-user Industry 2025 & 2033
- Figure 20: North America Carbon Foam Market Volume (Square Meters), by End-user Industry 2025 & 2033
- Figure 21: North America Carbon Foam Market Revenue Share (%), by End-user Industry 2025 & 2033
- Figure 22: North America Carbon Foam Market Volume Share (%), by End-user Industry 2025 & 2033
- Figure 23: North America Carbon Foam Market Revenue (Million), by Country 2025 & 2033
- Figure 24: North America Carbon Foam Market Volume (Square Meters), by Country 2025 & 2033
- Figure 25: North America Carbon Foam Market Revenue Share (%), by Country 2025 & 2033
- Figure 26: North America Carbon Foam Market Volume Share (%), by Country 2025 & 2033
- Figure 27: Europe Carbon Foam Market Revenue (Million), by Type 2025 & 2033
- Figure 28: Europe Carbon Foam Market Volume (Square Meters), by Type 2025 & 2033
- Figure 29: Europe Carbon Foam Market Revenue Share (%), by Type 2025 & 2033
- Figure 30: Europe Carbon Foam Market Volume Share (%), by Type 2025 & 2033
- Figure 31: Europe Carbon Foam Market Revenue (Million), by End-user Industry 2025 & 2033
- Figure 32: Europe Carbon Foam Market Volume (Square Meters), by End-user Industry 2025 & 2033
- Figure 33: Europe Carbon Foam Market Revenue Share (%), by End-user Industry 2025 & 2033
- Figure 34: Europe Carbon Foam Market Volume Share (%), by End-user Industry 2025 & 2033
- Figure 35: Europe Carbon Foam Market Revenue (Million), by Country 2025 & 2033
- Figure 36: Europe Carbon Foam Market Volume (Square Meters), by Country 2025 & 2033
- Figure 37: Europe Carbon Foam Market Revenue Share (%), by Country 2025 & 2033
- Figure 38: Europe Carbon Foam Market Volume Share (%), by Country 2025 & 2033
- Figure 39: South America Carbon Foam Market Revenue (Million), by Type 2025 & 2033
- Figure 40: South America Carbon Foam Market Volume (Square Meters), by Type 2025 & 2033
- Figure 41: South America Carbon Foam Market Revenue Share (%), by Type 2025 & 2033
- Figure 42: South America Carbon Foam Market Volume Share (%), by Type 2025 & 2033
- Figure 43: South America Carbon Foam Market Revenue (Million), by End-user Industry 2025 & 2033
- Figure 44: South America Carbon Foam Market Volume (Square Meters), by End-user Industry 2025 & 2033
- Figure 45: South America Carbon Foam Market Revenue Share (%), by End-user Industry 2025 & 2033
- Figure 46: South America Carbon Foam Market Volume Share (%), by End-user Industry 2025 & 2033
- Figure 47: South America Carbon Foam Market Revenue (Million), by Country 2025 & 2033
- Figure 48: South America Carbon Foam Market Volume (Square Meters), by Country 2025 & 2033
- Figure 49: South America Carbon Foam Market Revenue Share (%), by Country 2025 & 2033
- Figure 50: South America Carbon Foam Market Volume Share (%), by Country 2025 & 2033
- Figure 51: Middle East and Africa Carbon Foam Market Revenue (Million), by Type 2025 & 2033
- Figure 52: Middle East and Africa Carbon Foam Market Volume (Square Meters), by Type 2025 & 2033
- Figure 53: Middle East and Africa Carbon Foam Market Revenue Share (%), by Type 2025 & 2033
- Figure 54: Middle East and Africa Carbon Foam Market Volume Share (%), by Type 2025 & 2033
- Figure 55: Middle East and Africa Carbon Foam Market Revenue (Million), by End-user Industry 2025 & 2033
- Figure 56: Middle East and Africa Carbon Foam Market Volume (Square Meters), by End-user Industry 2025 & 2033
- Figure 57: Middle East and Africa Carbon Foam Market Revenue Share (%), by End-user Industry 2025 & 2033
- Figure 58: Middle East and Africa Carbon Foam Market Volume Share (%), by End-user Industry 2025 & 2033
- Figure 59: Middle East and Africa Carbon Foam Market Revenue (Million), by Country 2025 & 2033
- Figure 60: Middle East and Africa Carbon Foam Market Volume (Square Meters), by Country 2025 & 2033
- Figure 61: Middle East and Africa Carbon Foam Market Revenue Share (%), by Country 2025 & 2033
- Figure 62: Middle East and Africa Carbon Foam Market Volume Share (%), by Country 2025 & 2033
List of Tables
- Table 1: Global Carbon Foam Market Revenue Million Forecast, by Type 2020 & 2033
- Table 2: Global Carbon Foam Market Volume Square Meters Forecast, by Type 2020 & 2033
- Table 3: Global Carbon Foam Market Revenue Million Forecast, by End-user Industry 2020 & 2033
- Table 4: Global Carbon Foam Market Volume Square Meters Forecast, by End-user Industry 2020 & 2033
- Table 5: Global Carbon Foam Market Revenue Million Forecast, by Region 2020 & 2033
- Table 6: Global Carbon Foam Market Volume Square Meters Forecast, by Region 2020 & 2033
- Table 7: Global Carbon Foam Market Revenue Million Forecast, by Type 2020 & 2033
- Table 8: Global Carbon Foam Market Volume Square Meters Forecast, by Type 2020 & 2033
- Table 9: Global Carbon Foam Market Revenue Million Forecast, by End-user Industry 2020 & 2033
- Table 10: Global Carbon Foam Market Volume Square Meters Forecast, by End-user Industry 2020 & 2033
- Table 11: Global Carbon Foam Market Revenue Million Forecast, by Country 2020 & 2033
- Table 12: Global Carbon Foam Market Volume Square Meters Forecast, by Country 2020 & 2033
- Table 13: China Carbon Foam Market Revenue (Million) Forecast, by Application 2020 & 2033
- Table 14: China Carbon Foam Market Volume (Square Meters) Forecast, by Application 2020 & 2033
- Table 15: India Carbon Foam Market Revenue (Million) Forecast, by Application 2020 & 2033
- Table 16: India Carbon Foam Market Volume (Square Meters) Forecast, by Application 2020 & 2033
- Table 17: Japan Carbon Foam Market Revenue (Million) Forecast, by Application 2020 & 2033
- Table 18: Japan Carbon Foam Market Volume (Square Meters) Forecast, by Application 2020 & 2033
- Table 19: South Korea Carbon Foam Market Revenue (Million) Forecast, by Application 2020 & 2033
- Table 20: South Korea Carbon Foam Market Volume (Square Meters) Forecast, by Application 2020 & 2033
- Table 21: Malaysia Carbon Foam Market Revenue (Million) Forecast, by Application 2020 & 2033
- Table 22: Malaysia Carbon Foam Market Volume (Square Meters) Forecast, by Application 2020 & 2033
- Table 23: Thailand Carbon Foam Market Revenue (Million) Forecast, by Application 2020 & 2033
- Table 24: Thailand Carbon Foam Market Volume (Square Meters) Forecast, by Application 2020 & 2033
- Table 25: Indonesia Carbon Foam Market Revenue (Million) Forecast, by Application 2020 & 2033
- Table 26: Indonesia Carbon Foam Market Volume (Square Meters) Forecast, by Application 2020 & 2033
- Table 27: Vietnam Carbon Foam Market Revenue (Million) Forecast, by Application 2020 & 2033
- Table 28: Vietnam Carbon Foam Market Volume (Square Meters) Forecast, by Application 2020 & 2033
- Table 29: Rest of Asia Pacific Carbon Foam Market Revenue (Million) Forecast, by Application 2020 & 2033
- Table 30: Rest of Asia Pacific Carbon Foam Market Volume (Square Meters) Forecast, by Application 2020 & 2033
- Table 31: Global Carbon Foam Market Revenue Million Forecast, by Type 2020 & 2033
- Table 32: Global Carbon Foam Market Volume Square Meters Forecast, by Type 2020 & 2033
- Table 33: Global Carbon Foam Market Revenue Million Forecast, by End-user Industry 2020 & 2033
- Table 34: Global Carbon Foam Market Volume Square Meters Forecast, by End-user Industry 2020 & 2033
- Table 35: Global Carbon Foam Market Revenue Million Forecast, by Country 2020 & 2033
- Table 36: Global Carbon Foam Market Volume Square Meters Forecast, by Country 2020 & 2033
- Table 37: United States Carbon Foam Market Revenue (Million) Forecast, by Application 2020 & 2033
- Table 38: United States Carbon Foam Market Volume (Square Meters) Forecast, by Application 2020 & 2033
- Table 39: Canada Carbon Foam Market Revenue (Million) Forecast, by Application 2020 & 2033
- Table 40: Canada Carbon Foam Market Volume (Square Meters) Forecast, by Application 2020 & 2033
- Table 41: Mexico Carbon Foam Market Revenue (Million) Forecast, by Application 2020 & 2033
- Table 42: Mexico Carbon Foam Market Volume (Square Meters) Forecast, by Application 2020 & 2033
- Table 43: Global Carbon Foam Market Revenue Million Forecast, by Type 2020 & 2033
- Table 44: Global Carbon Foam Market Volume Square Meters Forecast, by Type 2020 & 2033
- Table 45: Global Carbon Foam Market Revenue Million Forecast, by End-user Industry 2020 & 2033
- Table 46: Global Carbon Foam Market Volume Square Meters Forecast, by End-user Industry 2020 & 2033
- Table 47: Global Carbon Foam Market Revenue Million Forecast, by Country 2020 & 2033
- Table 48: Global Carbon Foam Market Volume Square Meters Forecast, by Country 2020 & 2033
- Table 49: Germany Carbon Foam Market Revenue (Million) Forecast, by Application 2020 & 2033
- Table 50: Germany Carbon Foam Market Volume (Square Meters) Forecast, by Application 2020 & 2033
- Table 51: United Kingdom Carbon Foam Market Revenue (Million) Forecast, by Application 2020 & 2033
- Table 52: United Kingdom Carbon Foam Market Volume (Square Meters) Forecast, by Application 2020 & 2033
- Table 53: France Carbon Foam Market Revenue (Million) Forecast, by Application 2020 & 2033
- Table 54: France Carbon Foam Market Volume (Square Meters) Forecast, by Application 2020 & 2033
- Table 55: Italy Carbon Foam Market Revenue (Million) Forecast, by Application 2020 & 2033
- Table 56: Italy Carbon Foam Market Volume (Square Meters) Forecast, by Application 2020 & 2033
- Table 57: Spain Carbon Foam Market Revenue (Million) Forecast, by Application 2020 & 2033
- Table 58: Spain Carbon Foam Market Volume (Square Meters) Forecast, by Application 2020 & 2033
- Table 59: Nordic Carbon Foam Market Revenue (Million) Forecast, by Application 2020 & 2033
- Table 60: Nordic Carbon Foam Market Volume (Square Meters) Forecast, by Application 2020 & 2033
- Table 61: Turkey Carbon Foam Market Revenue (Million) Forecast, by Application 2020 & 2033
- Table 62: Turkey Carbon Foam Market Volume (Square Meters) Forecast, by Application 2020 & 2033
- Table 63: Russia Carbon Foam Market Revenue (Million) Forecast, by Application 2020 & 2033
- Table 64: Russia Carbon Foam Market Volume (Square Meters) Forecast, by Application 2020 & 2033
- Table 65: Rest of Europe Carbon Foam Market Revenue (Million) Forecast, by Application 2020 & 2033
- Table 66: Rest of Europe Carbon Foam Market Volume (Square Meters) Forecast, by Application 2020 & 2033
- Table 67: Global Carbon Foam Market Revenue Million Forecast, by Type 2020 & 2033
- Table 68: Global Carbon Foam Market Volume Square Meters Forecast, by Type 2020 & 2033
- Table 69: Global Carbon Foam Market Revenue Million Forecast, by End-user Industry 2020 & 2033
- Table 70: Global Carbon Foam Market Volume Square Meters Forecast, by End-user Industry 2020 & 2033
- Table 71: Global Carbon Foam Market Revenue Million Forecast, by Country 2020 & 2033
- Table 72: Global Carbon Foam Market Volume Square Meters Forecast, by Country 2020 & 2033
- Table 73: Brazil Carbon Foam Market Revenue (Million) Forecast, by Application 2020 & 2033
- Table 74: Brazil Carbon Foam Market Volume (Square Meters) Forecast, by Application 2020 & 2033
- Table 75: Argentina Carbon Foam Market Revenue (Million) Forecast, by Application 2020 & 2033
- Table 76: Argentina Carbon Foam Market Volume (Square Meters) Forecast, by Application 2020 & 2033
- Table 77: Rest of South America Carbon Foam Market Revenue (Million) Forecast, by Application 2020 & 2033
- Table 78: Rest of South America Carbon Foam Market Volume (Square Meters) Forecast, by Application 2020 & 2033
- Table 79: Global Carbon Foam Market Revenue Million Forecast, by Type 2020 & 2033
- Table 80: Global Carbon Foam Market Volume Square Meters Forecast, by Type 2020 & 2033
- Table 81: Global Carbon Foam Market Revenue Million Forecast, by End-user Industry 2020 & 2033
- Table 82: Global Carbon Foam Market Volume Square Meters Forecast, by End-user Industry 2020 & 2033
- Table 83: Global Carbon Foam Market Revenue Million Forecast, by Country 2020 & 2033
- Table 84: Global Carbon Foam Market Volume Square Meters Forecast, by Country 2020 & 2033
- Table 85: Saudi Arabia Carbon Foam Market Revenue (Million) Forecast, by Application 2020 & 2033
- Table 86: Saudi Arabia Carbon Foam Market Volume (Square Meters) Forecast, by Application 2020 & 2033
- Table 87: South Africa Carbon Foam Market Revenue (Million) Forecast, by Application 2020 & 2033
- Table 88: South Africa Carbon Foam Market Volume (Square Meters) Forecast, by Application 2020 & 2033
- Table 89: Rest of Middle East and Africa Carbon Foam Market Revenue (Million) Forecast, by Application 2020 & 2033
- Table 90: Rest of Middle East and Africa Carbon Foam Market Volume (Square Meters) Forecast, by Application 2020 & 2033
Frequently Asked Questions
1. What is the projected Compound Annual Growth Rate (CAGR) of the Carbon Foam Market?
The projected CAGR is approximately 10.73%.
2. Which companies are prominent players in the Carbon Foam Market?
Key companies in the market include American Elements, Ultramet, Entegris Inc, ERG Aerospace, CONSOL Energy Inc, Carbon-Core Corporation, Xiamen Zopin New Material Limited, Koppers Inc, Firefly International Energy.
3. What are the main segments of the Carbon Foam Market?
The market segments include Type, End-user Industry.
4. Can you provide details about the market size?
The market size is estimated to be USD 23.88 Million as of 2022.
5. What are some drivers contributing to market growth?
Increasing Usage in the Aerospace and Defense Industry; Environmental Concerns and a Push for Sustainable Solutions; Others.
6. What are the notable trends driving market growth?
The Usage of Carbon Foam is Increasing in the Aerospace and Defense Industry.
7. Are there any restraints impacting market growth?
The High Cost of the Production Process of Carbon Foam; Others.
8. Can you provide examples of recent developments in the market?
November 2023: Carbon foam was obtained by scientists from the Institute of Catalysts of the Siberian branch of the Russian Academy of Sciences. The raw material for the new material is oil refining waste. The synthesis of this material does not need foaming agents.
9. What pricing options are available for accessing the report?
Pricing options include single-user, multi-user, and enterprise licenses priced at USD 4750, USD 5250, and USD 8750 respectively.
10. Is the market size provided in terms of value or volume?
The market size is provided in terms of value, measured in Million and volume, measured in Square Meters.
11. Are there any specific market keywords associated with the report?
Yes, the market keyword associated with the report is "Carbon Foam Market," which aids in identifying and referencing the specific market segment covered.
12. How do I determine which pricing option suits my needs best?
The pricing options vary based on user requirements and access needs. Individual users may opt for single-user licenses, while businesses requiring broader access may choose multi-user or enterprise licenses for cost-effective access to the report.
13. Are there any additional resources or data provided in the Carbon Foam Market report?
While the report offers comprehensive insights, it's advisable to review the specific contents or supplementary materials provided to ascertain if additional resources or data are available.
14. How can I stay updated on further developments or reports in the Carbon Foam Market?
To stay informed about further developments, trends, and reports in the Carbon Foam Market, consider subscribing to industry newsletters, following relevant companies and organizations, or regularly checking reputable industry news sources and publications.
Methodology
Step 1 - Identification of Relevant Samples Size from Population Database


Step 2 - Approaches for Defining Global Market Size (Value, Volume* & Price*)

Note*: In applicable scenarios
Step 3 - Data Sources
Primary Research
- Web Analytics
- Survey Reports
- Research Institute
- Latest Research Reports
- Opinion Leaders
Secondary Research
- Annual Reports
- White Paper
- Latest Press Release
- Industry Association
- Paid Database
- Investor Presentations

Step 4 - Data Triangulation
Involves using different sources of information in order to increase the validity of a study
These sources are likely to be stakeholders in a program - participants, other researchers, program staff, other community members, and so on.
Then we put all data in single framework & apply various statistical tools to find out the dynamic on the market.
During the analysis stage, feedback from the stakeholder groups would be compared to determine areas of agreement as well as areas of divergence