

Key Insights
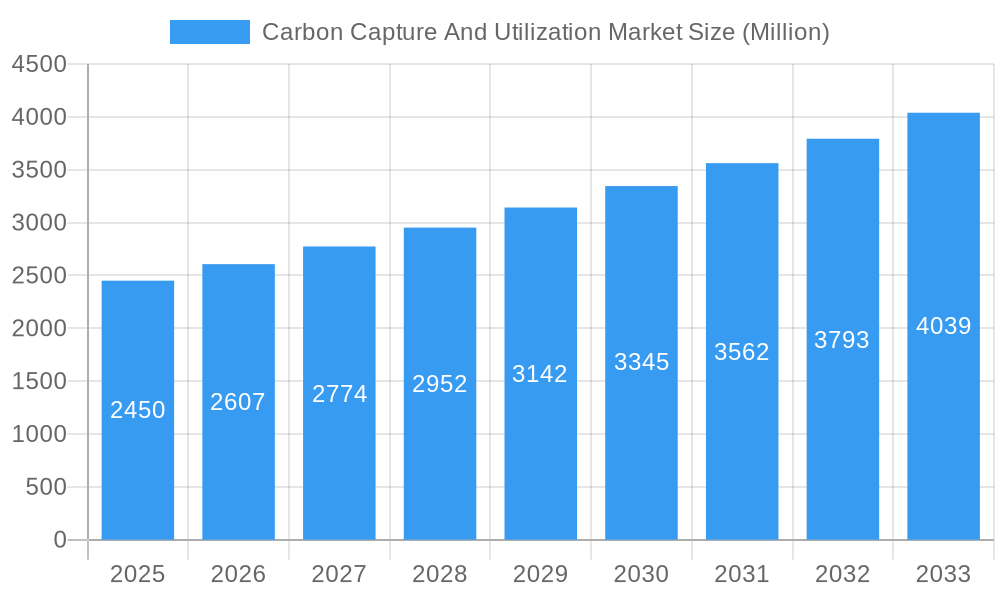
The Carbon Capture and Utilization (CCU) market is experiencing robust growth, projected to reach $2.45 billion in 2025 and maintain a Compound Annual Growth Rate (CAGR) of 6.12% from 2025 to 2033. This expansion is driven by increasing global concerns about climate change and the urgent need to reduce greenhouse gas emissions. Government regulations promoting carbon reduction, coupled with rising investments in renewable energy infrastructure and advancements in CCU technologies, are significant catalysts. The market is segmented by technology type (e.g., pre-combustion, post-combustion, oxy-fuel combustion), application (e.g., enhanced oil recovery, building materials, chemicals), and geographical region. Major players like ExxonMobil, Shell, Chevron, and others are actively involved, driving innovation and expanding market reach through strategic partnerships and acquisitions. While initial capital investment can be substantial, decreasing technology costs and increasing economies of scale are expected to improve the financial viability of CCU projects over time. Challenges remain, including the energy intensity of some capture methods and the need for efficient and cost-effective transportation and storage solutions for captured carbon. Despite these hurdles, the long-term outlook for the CCU market remains positive, driven by a growing awareness of the need for sustainable solutions and the potential for CCU to play a crucial role in mitigating climate change.
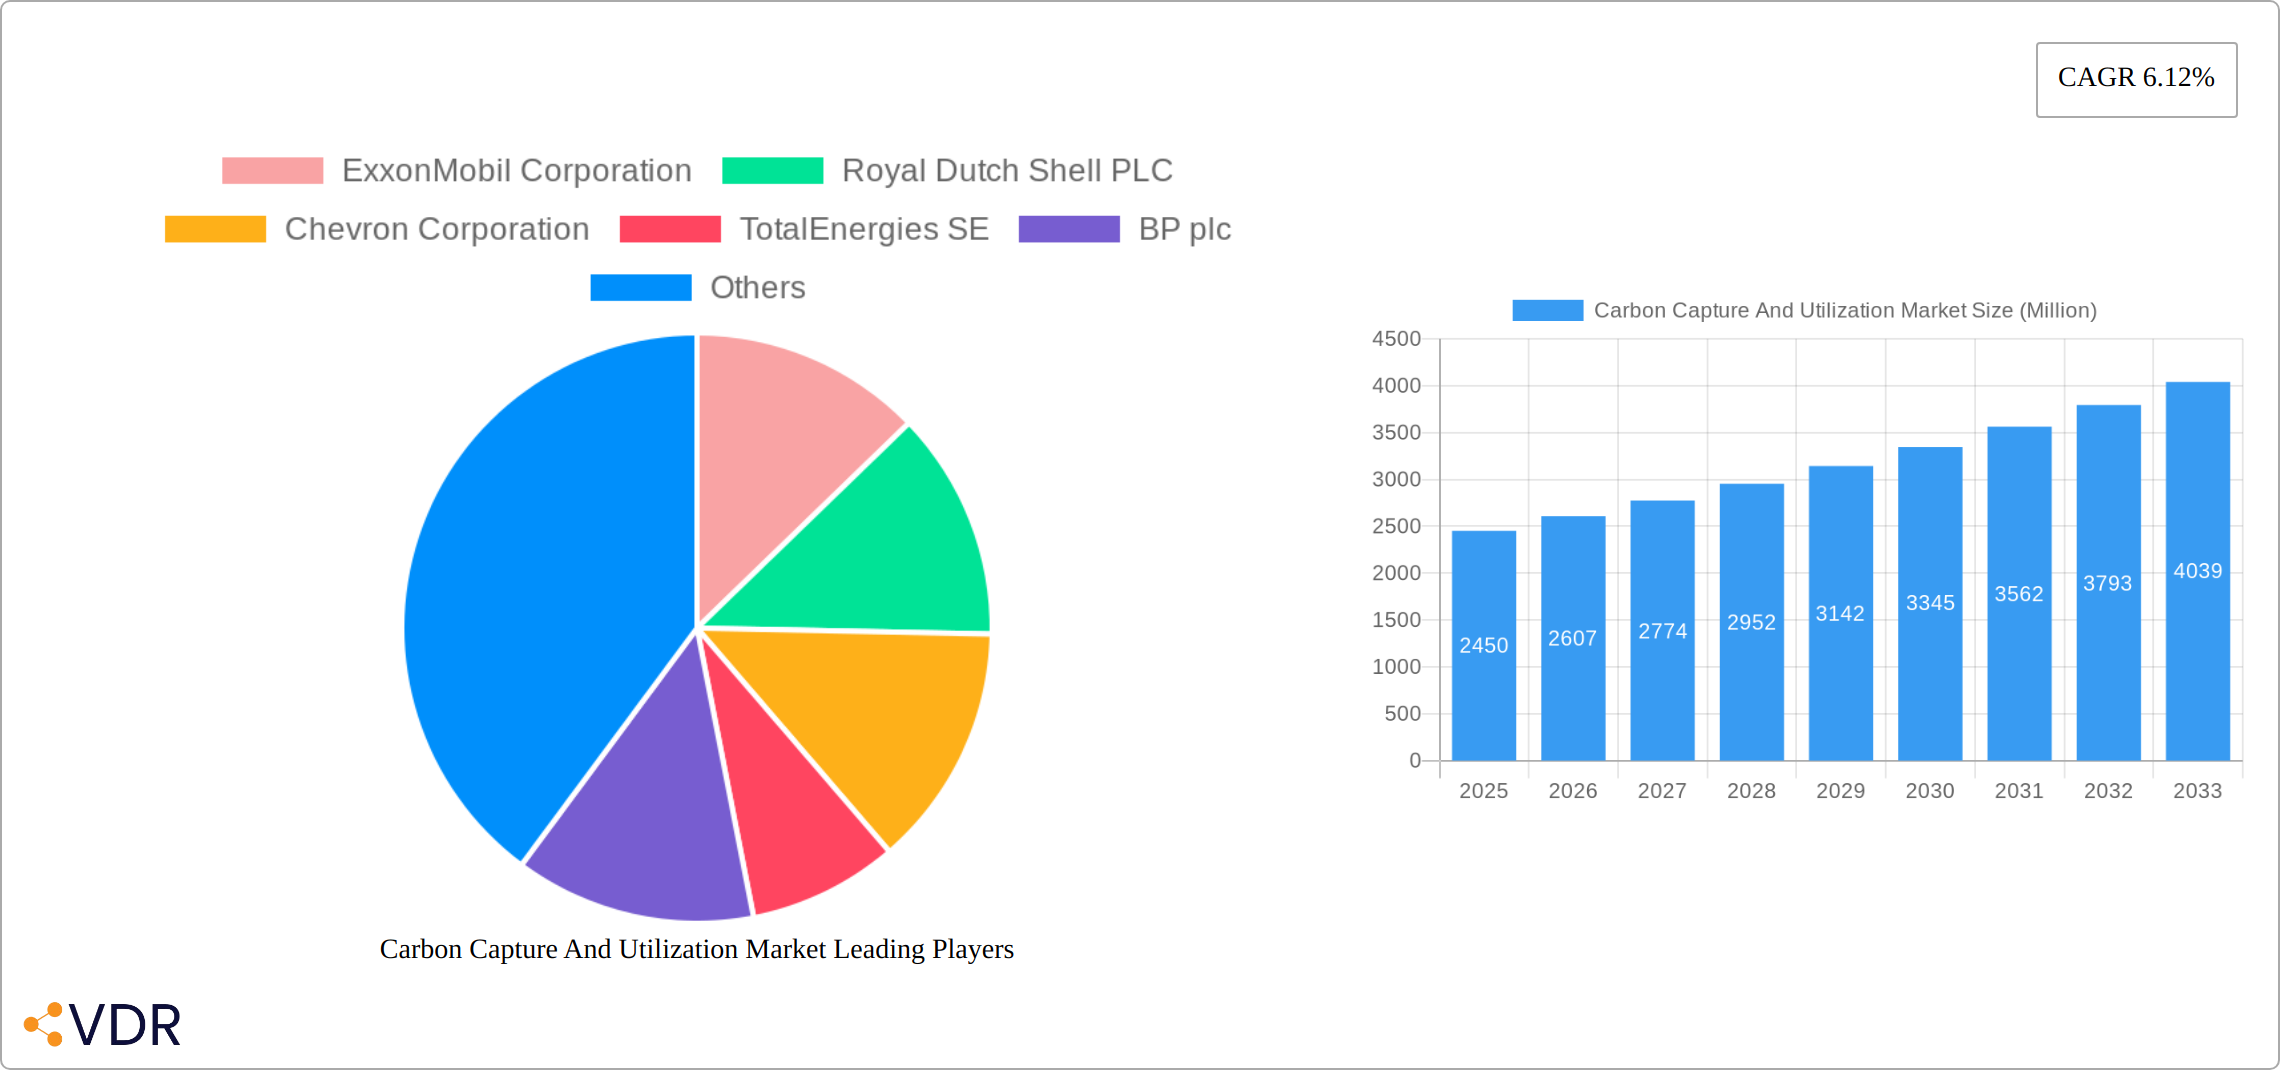
Carbon Capture And Utilization Market Market Size (In Billion)
The significant players in the CCU market are strategically positioning themselves to capitalize on emerging opportunities. Their focus is on developing advanced capture technologies, optimizing carbon utilization processes, and securing long-term supply contracts. Geographic expansion is also a key strategy, with companies targeting regions with favorable regulatory frameworks and abundant sources of carbon dioxide. Future market growth will be influenced by technological advancements, policy support, and the overall progress in global efforts to decarbonize the energy and industrial sectors. Continued research and development, along with public-private partnerships, will be critical in unlocking the full potential of CCU and realizing its contribution to a more sustainable future. The market's success hinges on the effective integration of CCU into broader decarbonization strategies.
Carbon Capture And Utilization Market Company Market Share
Carbon Capture and Utilization (CCU) Market: A Comprehensive Report (2019-2033)
This comprehensive report delivers an in-depth analysis of the Carbon Capture and Utilization (CCU) market, encompassing market dynamics, growth trends, regional dominance, product landscape, key players, and future outlook. The report covers the period from 2019 to 2033, with 2025 serving as the base and estimated year. The analysis delves into the parent market of Carbon Capture, Utilization and Storage (CCUS) and the child market of Direct Air Capture (DAC) to provide a holistic understanding. The global market size is projected to reach xx Million by 2033.
Carbon Capture And Utilization Market Market Dynamics & Structure
The competitive landscape of the Carbon Capture and Utilization (CCU) market is dynamic and evolving, influenced by a complex interplay of technological advancements, evolving regulatory frameworks, and diverse market forces. The global CCU market exhibits a moderately concentrated structure, characterized by the presence of several major industry leaders who command a significant share of the market. Concurrently, the market is experiencing robust growth in participation from emerging companies and innovative startups, focusing on specialized applications and pioneering new CCU technologies.
- Market Concentration: The leading players in the global CCU market are expected to account for approximately 60-70% of the total market share by 2025, indicating a degree of market consolidation. However, the increasing influx of niche players and technology developers signifies a growing diversification.
- Technological Innovation: Continuous advancements in capture technologies, including enhanced solvent-based systems, highly efficient membrane separation techniques, and innovative adsorbent materials, are key drivers of market expansion. Despite these breakthroughs, significant challenges persist regarding high initial capital expenditures and substantial energy requirements for efficient CO2 capture and utilization.
- Regulatory Landscape: Government policies aimed at curbing carbon emissions, coupled with attractive financial incentives and supportive regulatory environments, are profoundly influencing the growth trajectory of the CCU market. However, disparities in regulatory approaches across various geographical regions present complexities and potential hurdles for widespread market penetration and global expansion.
- Competitive Substitutes: While CCU presents a compelling solution for emissions mitigation, alternative strategies for reducing greenhouse gases, such as the widespread adoption of renewable energy sources and advancements in energy efficiency, pose indirect competitive pressures. The overarching goal remains the reduction of atmospheric CO2.
- End-User Demographics: The primary beneficiaries and adopters of CCU technologies are heavily concentrated within carbon-intensive industrial sectors, including power generation, cement manufacturing, steel production, and the chemical industry. Emerging applications are also being explored in the transportation and agriculture sectors.
- M&A Trends: The past five years have witnessed a notable increase in Mergers and Acquisitions (M&A) within the CCU sector, with an estimated 15-20 significant M&A deals. This trend underscores a strategic push towards industry consolidation, the formation of critical partnerships, and the acceleration of technological development and geographical market expansion through collaborative efforts.
Carbon Capture And Utilization Market Growth Trends & Insights
The CCU market has witnessed significant growth from 2019 to 2024, with a Compound Annual Growth Rate (CAGR) of xx%. This growth is primarily driven by increasing environmental concerns, stringent government regulations, and technological advancements in carbon capture and utilization technologies. The market is expected to continue its expansion, driven by technological breakthroughs, the development of large-scale commercial projects, and increasing investments.
The market penetration rate for CCU technologies is currently estimated at xx% in key industries, and it is expected to grow significantly during the forecast period. Several factors such as the increasing cost of carbon emissions, advancements in technology, and financial incentives are expected to further accelerate market adoption. Consumer behavior is increasingly influenced by environmental concerns, driving demand for products and services produced using sustainable and environmentally friendly practices. This shift in consumer preference creates significant growth opportunities for CCU technologies.
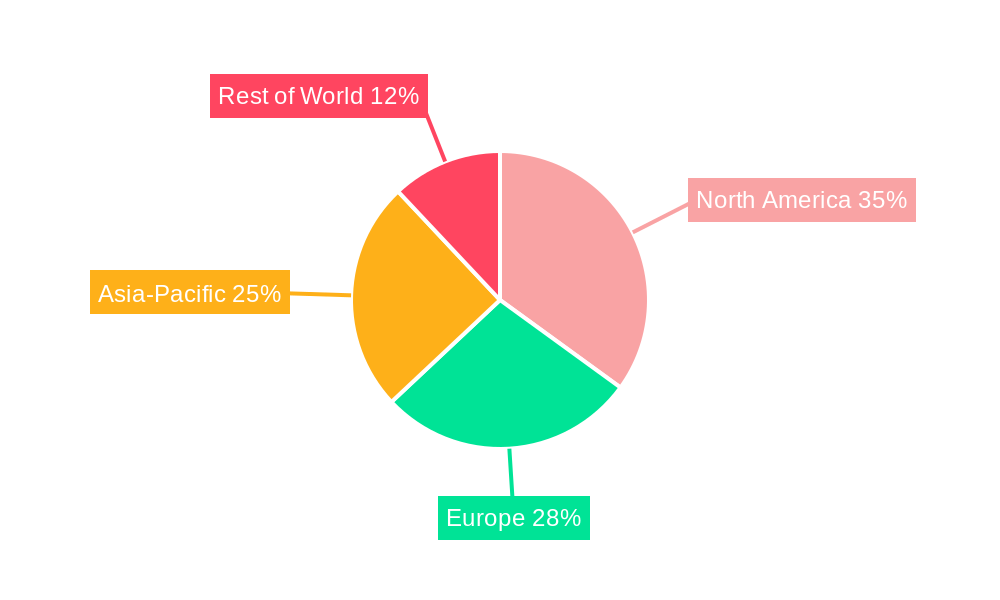
Dominant Regions, Countries, or Segments in Carbon Capture And Utilization Market
North America currently holds the largest market share in the CCU sector, followed by Europe and Asia-Pacific. The dominance of North America is attributed to the strong presence of key players, stringent environmental regulations, and significant investments in CCU research and development. Within North America, the United States is the leading market due to its substantial industrial base and favorable government policies.
Key Drivers for North American Dominance:
- Stringent emission reduction targets and carbon pricing mechanisms.
- Significant government funding and incentives for CCU projects.
- Presence of major energy companies and technology developers.
- Well-established infrastructure and skilled workforce.
Growth Potential in Other Regions: The Asia-Pacific region, particularly China and India, presents significant growth potential due to their large industrial sectors and increasing investments in sustainable technologies. Europe's commitment to achieving carbon neutrality is another major growth driver for the region.
Carbon Capture And Utilization Market Product Landscape
The Carbon Capture and Utilization (CCU) market encompasses a diverse array of technologies designed to capture carbon dioxide from various industrial emission sources and the atmosphere, subsequently transforming it into valuable products. Key capture methodologies include post-combustion capture, pre-combustion capture, oxy-fuel combustion, and direct air capture (DAC). The captured CO2 can then be utilized to produce a wide spectrum of high-value products, such as synthetic fuels, industrial chemicals, and sustainable building materials. Significant innovation is being observed in membrane separation and advanced solvent-based technologies, which are enhancing capture efficiency and progressively reducing operational costs. The unique selling propositions of CCU solutions lie in their ability to substantially reduce greenhouse gas emissions, facilitate the production of environmentally friendly products, and seamlessly integrate with existing industrial infrastructures, offering a pathway towards a circular carbon economy.
Key Drivers, Barriers & Challenges in Carbon Capture And Utilization Market
Key Drivers: The primary drivers include stringent government regulations aimed at reducing carbon emissions, growing environmental concerns, advancements in carbon capture and utilization technologies, and increasing investments in the sector. Policy incentives, such as tax credits and carbon pricing, also stimulate market growth.
Key Challenges: High capital and operating costs, technological limitations, lack of large-scale commercial deployment, and the need for robust carbon transportation and storage infrastructure pose significant challenges. The presence of established, low-cost substitutes and supply chain complexities also impede widespread adoption. These factors can lead to project delays and increased project costs. For example, the lack of large-scale, cost-effective CO2 transport networks can limit the viability of CCU projects.
Emerging Opportunities in Carbon Capture And Utilization Market
Emerging opportunities lie in the development of innovative applications for captured CO2, such as the production of sustainable aviation fuels (SAFs), enhanced oil recovery (EOR), and the creation of building materials. Untapped markets in developing economies and increasing consumer demand for environmentally friendly products provide significant growth potential. The development of more efficient and cost-effective capture technologies and the exploration of new utilization pathways will further propel market growth.
Growth Accelerators in the Carbon Capture And Utilization Market Industry
The Carbon Capture and Utilization (CCU) industry is propelled by several key growth accelerators. Foremost among these are technological advancements that yield more efficient, scalable, and cost-effective CCU solutions, thereby enhancing their economic viability. Strategic partnerships, collaborations, and joint ventures between pioneering technology providers, established energy companies, and major industrial players are instrumental in expediting innovation cycles and facilitating the successful deployment of CCU projects on a larger scale. Furthermore, expanded governmental support, manifested through substantial financial incentives, carbon pricing mechanisms, and the streamlining of regulatory approval processes, plays a critical role in stimulating investment and fostering the continued development and expansion of this rapidly growing and vital sector.
Key Players Shaping the Carbon Capture And Utilization Market Market
Notable Milestones in Carbon Capture And Utilization Market Sector
- April 2024: TotalEnergies and Vanguard Renewables have forged a strategic joint venture to advance Farm Powered Renewable Natural Gas (RNG) initiatives across the United States, aiming to capture methane emissions from agricultural waste and convert them into a sustainable fuel source.
- February 2023: Aker Solutions has been awarded a significant contract for the Draugen project in collaboration with OKEA. This project is anticipated to deliver substantial environmental benefits, projecting an annual reduction in CO2 emissions of up to 200,000 tons, showcasing the practical application of CCU in offshore operations.
In-Depth Carbon Capture And Utilization Market Market Outlook
The CCU market is poised for significant growth over the forecast period. Technological advancements, favorable government policies, and increasing corporate sustainability commitments will drive market expansion. Strategic partnerships and collaborations will play a crucial role in accelerating innovation and scaling up CCU projects. The development of new applications for captured CO2 and the exploration of untapped markets will further contribute to the long-term growth of the CCU market, presenting lucrative strategic opportunities for investors and businesses.
Carbon Capture And Utilization Market Segmentation
-
1. Service
- 1.1. Capture
- 1.2. Transportation
- 1.3. Utilization
- 1.4. Storage
-
2. Technology
- 2.1. Pre-combustion Capture
- 2.2. Oxy-fuel Combustion Capture
- 2.3. Post-combustion Capture
-
3. End User
- 3.1. Oil and Gas
- 3.2. Power Generation
- 3.3. Iron and Steel
- 3.4. Chemical and Petrochemical
- 3.5. Cement
- 3.6. Other End Users
Carbon Capture And Utilization Market Segmentation By Geography
-
1. Asia Pacific
- 1.1. India
- 1.2. China
- 1.3. Japan
- 1.4. Australia
- 1.5. Rest of Asia Pacific
-
2. North America
- 2.1. United States
- 2.2. Canada
- 2.3. Rest of North America
-
3. Europe
- 3.1. Germany
- 3.2. United Kingdom
- 3.3. France
- 3.4. Russia
- 3.5. Rest of Europe
-
4. South America
- 4.1. Brazil
- 4.2. Argentina
- 4.3. Rest of South America
-
5. Middle East and Africa
- 5.1. United Arab Emirates
- 5.2. South Africa
- 5.3. Rest of Middle East and Africa
Carbon Capture And Utilization Market Regional Market Share
Geographic Coverage of Carbon Capture And Utilization Market
Carbon Capture And Utilization Market REPORT HIGHLIGHTS
| Aspects | Details |
|---|---|
| Study Period | 2020-2034 |
| Base Year | 2025 |
| Estimated Year | 2026 |
| Forecast Period | 2026-2034 |
| Historical Period | 2020-2025 |
| Growth Rate | CAGR of 6.12% from 2020-2034 |
| Segmentation |
|
Table of Contents
- 1. Introduction
- 1.1. Research Scope
- 1.2. Market Segmentation
- 1.3. Research Objective
- 1.4. Definitions and Assumptions
- 2. Executive Summary
- 2.1. Market Snapshot
- 3. Market Dynamics
- 3.1. Market Drivers
- 3.2. Market Restrains
- 3.3. Market Trends
- 3.4. Market Opportunities
- 4. Market Factor Analysis
- 4.1. Porters Five Forces
- 4.1.1. Bargaining Power of Suppliers
- 4.1.2. Bargaining Power of Buyers
- 4.1.3. Threat of New Entrants
- 4.1.4. Threat of Substitutes
- 4.1.5. Competitive Rivalry
- 4.2. PESTEL analysis
- 4.3. BCG Analysis
- 4.3.1. Stars (High Growth, High Market Share)
- 4.3.2. Cash Cows (Low Growth, High Market Share)
- 4.3.3. Question Mark (High Growth, Low Market Share)
- 4.3.4. Dogs (Low Growth, Low Market Share)
- 4.4. Ansoff Matrix Analysis
- 4.5. Supply Chain Analysis
- 4.6. Regulatory Landscape
- 4.7. Current Market Potential and Opportunity Assessment (TAM–SAM–SOM Framework)
- 4.8. VDR Analyst Note
- 4.1. Porters Five Forces
- 5. Market Analysis, Insights and Forecast 2021-2033
- 5.1. Market Analysis, Insights and Forecast - by Service
- 5.1.1. Capture
- 5.1.2. Transportation
- 5.1.3. Utilization
- 5.1.4. Storage
- 5.2. Market Analysis, Insights and Forecast - by Technology
- 5.2.1. Pre-combustion Capture
- 5.2.2. Oxy-fuel Combustion Capture
- 5.2.3. Post-combustion Capture
- 5.3. Market Analysis, Insights and Forecast - by End User
- 5.3.1. Oil and Gas
- 5.3.2. Power Generation
- 5.3.3. Iron and Steel
- 5.3.4. Chemical and Petrochemical
- 5.3.5. Cement
- 5.3.6. Other End Users
- 5.4. Market Analysis, Insights and Forecast - by Region
- 5.4.1. Asia Pacific
- 5.4.2. North America
- 5.4.3. Europe
- 5.4.4. South America
- 5.4.5. Middle East and Africa
- 5.1. Market Analysis, Insights and Forecast - by Service
- 6. Global Carbon Capture And Utilization Market Analysis, Insights and Forecast, 2021-2033
- 6.1. Market Analysis, Insights and Forecast - by Service
- 6.1.1. Capture
- 6.1.2. Transportation
- 6.1.3. Utilization
- 6.1.4. Storage
- 6.2. Market Analysis, Insights and Forecast - by Technology
- 6.2.1. Pre-combustion Capture
- 6.2.2. Oxy-fuel Combustion Capture
- 6.2.3. Post-combustion Capture
- 6.3. Market Analysis, Insights and Forecast - by End User
- 6.3.1. Oil and Gas
- 6.3.2. Power Generation
- 6.3.3. Iron and Steel
- 6.3.4. Chemical and Petrochemical
- 6.3.5. Cement
- 6.3.6. Other End Users
- 6.1. Market Analysis, Insights and Forecast - by Service
- 7. Asia Pacific Carbon Capture And Utilization Market Analysis, Insights and Forecast, 2021-2033
- 7.1. Market Analysis, Insights and Forecast - by Service
- 7.1.1. Capture
- 7.1.2. Transportation
- 7.1.3. Utilization
- 7.1.4. Storage
- 7.2. Market Analysis, Insights and Forecast - by Technology
- 7.2.1. Pre-combustion Capture
- 7.2.2. Oxy-fuel Combustion Capture
- 7.2.3. Post-combustion Capture
- 7.3. Market Analysis, Insights and Forecast - by End User
- 7.3.1. Oil and Gas
- 7.3.2. Power Generation
- 7.3.3. Iron and Steel
- 7.3.4. Chemical and Petrochemical
- 7.3.5. Cement
- 7.3.6. Other End Users
- 7.1. Market Analysis, Insights and Forecast - by Service
- 8. North America Carbon Capture And Utilization Market Analysis, Insights and Forecast, 2021-2033
- 8.1. Market Analysis, Insights and Forecast - by Service
- 8.1.1. Capture
- 8.1.2. Transportation
- 8.1.3. Utilization
- 8.1.4. Storage
- 8.2. Market Analysis, Insights and Forecast - by Technology
- 8.2.1. Pre-combustion Capture
- 8.2.2. Oxy-fuel Combustion Capture
- 8.2.3. Post-combustion Capture
- 8.3. Market Analysis, Insights and Forecast - by End User
- 8.3.1. Oil and Gas
- 8.3.2. Power Generation
- 8.3.3. Iron and Steel
- 8.3.4. Chemical and Petrochemical
- 8.3.5. Cement
- 8.3.6. Other End Users
- 8.1. Market Analysis, Insights and Forecast - by Service
- 9. Europe Carbon Capture And Utilization Market Analysis, Insights and Forecast, 2021-2033
- 9.1. Market Analysis, Insights and Forecast - by Service
- 9.1.1. Capture
- 9.1.2. Transportation
- 9.1.3. Utilization
- 9.1.4. Storage
- 9.2. Market Analysis, Insights and Forecast - by Technology
- 9.2.1. Pre-combustion Capture
- 9.2.2. Oxy-fuel Combustion Capture
- 9.2.3. Post-combustion Capture
- 9.3. Market Analysis, Insights and Forecast - by End User
- 9.3.1. Oil and Gas
- 9.3.2. Power Generation
- 9.3.3. Iron and Steel
- 9.3.4. Chemical and Petrochemical
- 9.3.5. Cement
- 9.3.6. Other End Users
- 9.1. Market Analysis, Insights and Forecast - by Service
- 10. South America Carbon Capture And Utilization Market Analysis, Insights and Forecast, 2021-2033
- 10.1. Market Analysis, Insights and Forecast - by Service
- 10.1.1. Capture
- 10.1.2. Transportation
- 10.1.3. Utilization
- 10.1.4. Storage
- 10.2. Market Analysis, Insights and Forecast - by Technology
- 10.2.1. Pre-combustion Capture
- 10.2.2. Oxy-fuel Combustion Capture
- 10.2.3. Post-combustion Capture
- 10.3. Market Analysis, Insights and Forecast - by End User
- 10.3.1. Oil and Gas
- 10.3.2. Power Generation
- 10.3.3. Iron and Steel
- 10.3.4. Chemical and Petrochemical
- 10.3.5. Cement
- 10.3.6. Other End Users
- 10.1. Market Analysis, Insights and Forecast - by Service
- 11. Middle East and Africa Carbon Capture And Utilization Market Analysis, Insights and Forecast, 2021-2033
- 11.1. Market Analysis, Insights and Forecast - by Service
- 11.1.1. Capture
- 11.1.2. Transportation
- 11.1.3. Utilization
- 11.1.4. Storage
- 11.2. Market Analysis, Insights and Forecast - by Technology
- 11.2.1. Pre-combustion Capture
- 11.2.2. Oxy-fuel Combustion Capture
- 11.2.3. Post-combustion Capture
- 11.3. Market Analysis, Insights and Forecast - by End User
- 11.3.1. Oil and Gas
- 11.3.2. Power Generation
- 11.3.3. Iron and Steel
- 11.3.4. Chemical and Petrochemical
- 11.3.5. Cement
- 11.3.6. Other End Users
- 11.1. Market Analysis, Insights and Forecast - by Service
- 12. Competitive Analysis
- 12.1. Company Profiles
- 12.1.1 ExxonMobil Corporation
- 12.1.1.1. Company Overview
- 12.1.1.2. Products
- 12.1.1.3. Company Financials
- 12.1.1.4. SWOT Analysis
- 12.1.2 Royal Dutch Shell PLC
- 12.1.2.1. Company Overview
- 12.1.2.2. Products
- 12.1.2.3. Company Financials
- 12.1.2.4. SWOT Analysis
- 12.1.3 Chevron Corporation
- 12.1.3.1. Company Overview
- 12.1.3.2. Products
- 12.1.3.3. Company Financials
- 12.1.3.4. SWOT Analysis
- 12.1.4 TotalEnergies SE
- 12.1.4.1. Company Overview
- 12.1.4.2. Products
- 12.1.4.3. Company Financials
- 12.1.4.4. SWOT Analysis
- 12.1.5 BP plc
- 12.1.5.1. Company Overview
- 12.1.5.2. Products
- 12.1.5.3. Company Financials
- 12.1.5.4. SWOT Analysis
- 12.1.6 Equinor ASA
- 12.1.6.1. Company Overview
- 12.1.6.2. Products
- 12.1.6.3. Company Financials
- 12.1.6.4. SWOT Analysis
- 12.1.7 Mitsubishi Heavy Industries Ltd
- 12.1.7.1. Company Overview
- 12.1.7.2. Products
- 12.1.7.3. Company Financials
- 12.1.7.4. SWOT Analysis
- 12.1.8 Air Products and Chemicals Inc
- 12.1.8.1. Company Overview
- 12.1.8.2. Products
- 12.1.8.3. Company Financials
- 12.1.8.4. SWOT Analysis
- 12.1.9 Aker Solutions ASA
- 12.1.9.1. Company Overview
- 12.1.9.2. Products
- 12.1.9.3. Company Financials
- 12.1.9.4. SWOT Analysis
- 12.1.10 Schlumberger Limited
- 12.1.10.1. Company Overview
- 12.1.10.2. Products
- 12.1.10.3. Company Financials
- 12.1.10.4. SWOT Analysis
- 12.1.1 ExxonMobil Corporation
- 12.2. Market Entropy
- 12.2.1 Company's Key Areas Served
- 12.2.2 Recent Developments
- 12.3. Company Market Share Analysis 2025
- 12.3.1 Top 5 Companies Market Share Analysis
- 12.3.2 Top 3 Companies Market Share Analysis
- 12.4. List of Potential Customers
- 13. Research Methodology
List of Figures
- Figure 1: Global Carbon Capture And Utilization Market Revenue Breakdown (Million, %) by Region 2025 & 2033
- Figure 2: Global Carbon Capture And Utilization Market Volume Breakdown (Billion, %) by Region 2025 & 2033
- Figure 3: Asia Pacific Carbon Capture And Utilization Market Revenue (Million), by Service 2025 & 2033
- Figure 4: Asia Pacific Carbon Capture And Utilization Market Volume (Billion), by Service 2025 & 2033
- Figure 5: Asia Pacific Carbon Capture And Utilization Market Revenue Share (%), by Service 2025 & 2033
- Figure 6: Asia Pacific Carbon Capture And Utilization Market Volume Share (%), by Service 2025 & 2033
- Figure 7: Asia Pacific Carbon Capture And Utilization Market Revenue (Million), by Technology 2025 & 2033
- Figure 8: Asia Pacific Carbon Capture And Utilization Market Volume (Billion), by Technology 2025 & 2033
- Figure 9: Asia Pacific Carbon Capture And Utilization Market Revenue Share (%), by Technology 2025 & 2033
- Figure 10: Asia Pacific Carbon Capture And Utilization Market Volume Share (%), by Technology 2025 & 2033
- Figure 11: Asia Pacific Carbon Capture And Utilization Market Revenue (Million), by End User 2025 & 2033
- Figure 12: Asia Pacific Carbon Capture And Utilization Market Volume (Billion), by End User 2025 & 2033
- Figure 13: Asia Pacific Carbon Capture And Utilization Market Revenue Share (%), by End User 2025 & 2033
- Figure 14: Asia Pacific Carbon Capture And Utilization Market Volume Share (%), by End User 2025 & 2033
- Figure 15: Asia Pacific Carbon Capture And Utilization Market Revenue (Million), by Country 2025 & 2033
- Figure 16: Asia Pacific Carbon Capture And Utilization Market Volume (Billion), by Country 2025 & 2033
- Figure 17: Asia Pacific Carbon Capture And Utilization Market Revenue Share (%), by Country 2025 & 2033
- Figure 18: Asia Pacific Carbon Capture And Utilization Market Volume Share (%), by Country 2025 & 2033
- Figure 19: North America Carbon Capture And Utilization Market Revenue (Million), by Service 2025 & 2033
- Figure 20: North America Carbon Capture And Utilization Market Volume (Billion), by Service 2025 & 2033
- Figure 21: North America Carbon Capture And Utilization Market Revenue Share (%), by Service 2025 & 2033
- Figure 22: North America Carbon Capture And Utilization Market Volume Share (%), by Service 2025 & 2033
- Figure 23: North America Carbon Capture And Utilization Market Revenue (Million), by Technology 2025 & 2033
- Figure 24: North America Carbon Capture And Utilization Market Volume (Billion), by Technology 2025 & 2033
- Figure 25: North America Carbon Capture And Utilization Market Revenue Share (%), by Technology 2025 & 2033
- Figure 26: North America Carbon Capture And Utilization Market Volume Share (%), by Technology 2025 & 2033
- Figure 27: North America Carbon Capture And Utilization Market Revenue (Million), by End User 2025 & 2033
- Figure 28: North America Carbon Capture And Utilization Market Volume (Billion), by End User 2025 & 2033
- Figure 29: North America Carbon Capture And Utilization Market Revenue Share (%), by End User 2025 & 2033
- Figure 30: North America Carbon Capture And Utilization Market Volume Share (%), by End User 2025 & 2033
- Figure 31: North America Carbon Capture And Utilization Market Revenue (Million), by Country 2025 & 2033
- Figure 32: North America Carbon Capture And Utilization Market Volume (Billion), by Country 2025 & 2033
- Figure 33: North America Carbon Capture And Utilization Market Revenue Share (%), by Country 2025 & 2033
- Figure 34: North America Carbon Capture And Utilization Market Volume Share (%), by Country 2025 & 2033
- Figure 35: Europe Carbon Capture And Utilization Market Revenue (Million), by Service 2025 & 2033
- Figure 36: Europe Carbon Capture And Utilization Market Volume (Billion), by Service 2025 & 2033
- Figure 37: Europe Carbon Capture And Utilization Market Revenue Share (%), by Service 2025 & 2033
- Figure 38: Europe Carbon Capture And Utilization Market Volume Share (%), by Service 2025 & 2033
- Figure 39: Europe Carbon Capture And Utilization Market Revenue (Million), by Technology 2025 & 2033
- Figure 40: Europe Carbon Capture And Utilization Market Volume (Billion), by Technology 2025 & 2033
- Figure 41: Europe Carbon Capture And Utilization Market Revenue Share (%), by Technology 2025 & 2033
- Figure 42: Europe Carbon Capture And Utilization Market Volume Share (%), by Technology 2025 & 2033
- Figure 43: Europe Carbon Capture And Utilization Market Revenue (Million), by End User 2025 & 2033
- Figure 44: Europe Carbon Capture And Utilization Market Volume (Billion), by End User 2025 & 2033
- Figure 45: Europe Carbon Capture And Utilization Market Revenue Share (%), by End User 2025 & 2033
- Figure 46: Europe Carbon Capture And Utilization Market Volume Share (%), by End User 2025 & 2033
- Figure 47: Europe Carbon Capture And Utilization Market Revenue (Million), by Country 2025 & 2033
- Figure 48: Europe Carbon Capture And Utilization Market Volume (Billion), by Country 2025 & 2033
- Figure 49: Europe Carbon Capture And Utilization Market Revenue Share (%), by Country 2025 & 2033
- Figure 50: Europe Carbon Capture And Utilization Market Volume Share (%), by Country 2025 & 2033
- Figure 51: South America Carbon Capture And Utilization Market Revenue (Million), by Service 2025 & 2033
- Figure 52: South America Carbon Capture And Utilization Market Volume (Billion), by Service 2025 & 2033
- Figure 53: South America Carbon Capture And Utilization Market Revenue Share (%), by Service 2025 & 2033
- Figure 54: South America Carbon Capture And Utilization Market Volume Share (%), by Service 2025 & 2033
- Figure 55: South America Carbon Capture And Utilization Market Revenue (Million), by Technology 2025 & 2033
- Figure 56: South America Carbon Capture And Utilization Market Volume (Billion), by Technology 2025 & 2033
- Figure 57: South America Carbon Capture And Utilization Market Revenue Share (%), by Technology 2025 & 2033
- Figure 58: South America Carbon Capture And Utilization Market Volume Share (%), by Technology 2025 & 2033
- Figure 59: South America Carbon Capture And Utilization Market Revenue (Million), by End User 2025 & 2033
- Figure 60: South America Carbon Capture And Utilization Market Volume (Billion), by End User 2025 & 2033
- Figure 61: South America Carbon Capture And Utilization Market Revenue Share (%), by End User 2025 & 2033
- Figure 62: South America Carbon Capture And Utilization Market Volume Share (%), by End User 2025 & 2033
- Figure 63: South America Carbon Capture And Utilization Market Revenue (Million), by Country 2025 & 2033
- Figure 64: South America Carbon Capture And Utilization Market Volume (Billion), by Country 2025 & 2033
- Figure 65: South America Carbon Capture And Utilization Market Revenue Share (%), by Country 2025 & 2033
- Figure 66: South America Carbon Capture And Utilization Market Volume Share (%), by Country 2025 & 2033
- Figure 67: Middle East and Africa Carbon Capture And Utilization Market Revenue (Million), by Service 2025 & 2033
- Figure 68: Middle East and Africa Carbon Capture And Utilization Market Volume (Billion), by Service 2025 & 2033
- Figure 69: Middle East and Africa Carbon Capture And Utilization Market Revenue Share (%), by Service 2025 & 2033
- Figure 70: Middle East and Africa Carbon Capture And Utilization Market Volume Share (%), by Service 2025 & 2033
- Figure 71: Middle East and Africa Carbon Capture And Utilization Market Revenue (Million), by Technology 2025 & 2033
- Figure 72: Middle East and Africa Carbon Capture And Utilization Market Volume (Billion), by Technology 2025 & 2033
- Figure 73: Middle East and Africa Carbon Capture And Utilization Market Revenue Share (%), by Technology 2025 & 2033
- Figure 74: Middle East and Africa Carbon Capture And Utilization Market Volume Share (%), by Technology 2025 & 2033
- Figure 75: Middle East and Africa Carbon Capture And Utilization Market Revenue (Million), by End User 2025 & 2033
- Figure 76: Middle East and Africa Carbon Capture And Utilization Market Volume (Billion), by End User 2025 & 2033
- Figure 77: Middle East and Africa Carbon Capture And Utilization Market Revenue Share (%), by End User 2025 & 2033
- Figure 78: Middle East and Africa Carbon Capture And Utilization Market Volume Share (%), by End User 2025 & 2033
- Figure 79: Middle East and Africa Carbon Capture And Utilization Market Revenue (Million), by Country 2025 & 2033
- Figure 80: Middle East and Africa Carbon Capture And Utilization Market Volume (Billion), by Country 2025 & 2033
- Figure 81: Middle East and Africa Carbon Capture And Utilization Market Revenue Share (%), by Country 2025 & 2033
- Figure 82: Middle East and Africa Carbon Capture And Utilization Market Volume Share (%), by Country 2025 & 2033
List of Tables
- Table 1: Global Carbon Capture And Utilization Market Revenue Million Forecast, by Service 2020 & 2033
- Table 2: Global Carbon Capture And Utilization Market Volume Billion Forecast, by Service 2020 & 2033
- Table 3: Global Carbon Capture And Utilization Market Revenue Million Forecast, by Technology 2020 & 2033
- Table 4: Global Carbon Capture And Utilization Market Volume Billion Forecast, by Technology 2020 & 2033
- Table 5: Global Carbon Capture And Utilization Market Revenue Million Forecast, by End User 2020 & 2033
- Table 6: Global Carbon Capture And Utilization Market Volume Billion Forecast, by End User 2020 & 2033
- Table 7: Global Carbon Capture And Utilization Market Revenue Million Forecast, by Region 2020 & 2033
- Table 8: Global Carbon Capture And Utilization Market Volume Billion Forecast, by Region 2020 & 2033
- Table 9: Global Carbon Capture And Utilization Market Revenue Million Forecast, by Service 2020 & 2033
- Table 10: Global Carbon Capture And Utilization Market Volume Billion Forecast, by Service 2020 & 2033
- Table 11: Global Carbon Capture And Utilization Market Revenue Million Forecast, by Technology 2020 & 2033
- Table 12: Global Carbon Capture And Utilization Market Volume Billion Forecast, by Technology 2020 & 2033
- Table 13: Global Carbon Capture And Utilization Market Revenue Million Forecast, by End User 2020 & 2033
- Table 14: Global Carbon Capture And Utilization Market Volume Billion Forecast, by End User 2020 & 2033
- Table 15: Global Carbon Capture And Utilization Market Revenue Million Forecast, by Country 2020 & 2033
- Table 16: Global Carbon Capture And Utilization Market Volume Billion Forecast, by Country 2020 & 2033
- Table 17: India Carbon Capture And Utilization Market Revenue (Million) Forecast, by Application 2020 & 2033
- Table 18: India Carbon Capture And Utilization Market Volume (Billion) Forecast, by Application 2020 & 2033
- Table 19: China Carbon Capture And Utilization Market Revenue (Million) Forecast, by Application 2020 & 2033
- Table 20: China Carbon Capture And Utilization Market Volume (Billion) Forecast, by Application 2020 & 2033
- Table 21: Japan Carbon Capture And Utilization Market Revenue (Million) Forecast, by Application 2020 & 2033
- Table 22: Japan Carbon Capture And Utilization Market Volume (Billion) Forecast, by Application 2020 & 2033
- Table 23: Australia Carbon Capture And Utilization Market Revenue (Million) Forecast, by Application 2020 & 2033
- Table 24: Australia Carbon Capture And Utilization Market Volume (Billion) Forecast, by Application 2020 & 2033
- Table 25: Rest of Asia Pacific Carbon Capture And Utilization Market Revenue (Million) Forecast, by Application 2020 & 2033
- Table 26: Rest of Asia Pacific Carbon Capture And Utilization Market Volume (Billion) Forecast, by Application 2020 & 2033
- Table 27: Global Carbon Capture And Utilization Market Revenue Million Forecast, by Service 2020 & 2033
- Table 28: Global Carbon Capture And Utilization Market Volume Billion Forecast, by Service 2020 & 2033
- Table 29: Global Carbon Capture And Utilization Market Revenue Million Forecast, by Technology 2020 & 2033
- Table 30: Global Carbon Capture And Utilization Market Volume Billion Forecast, by Technology 2020 & 2033
- Table 31: Global Carbon Capture And Utilization Market Revenue Million Forecast, by End User 2020 & 2033
- Table 32: Global Carbon Capture And Utilization Market Volume Billion Forecast, by End User 2020 & 2033
- Table 33: Global Carbon Capture And Utilization Market Revenue Million Forecast, by Country 2020 & 2033
- Table 34: Global Carbon Capture And Utilization Market Volume Billion Forecast, by Country 2020 & 2033
- Table 35: United States Carbon Capture And Utilization Market Revenue (Million) Forecast, by Application 2020 & 2033
- Table 36: United States Carbon Capture And Utilization Market Volume (Billion) Forecast, by Application 2020 & 2033
- Table 37: Canada Carbon Capture And Utilization Market Revenue (Million) Forecast, by Application 2020 & 2033
- Table 38: Canada Carbon Capture And Utilization Market Volume (Billion) Forecast, by Application 2020 & 2033
- Table 39: Rest of North America Carbon Capture And Utilization Market Revenue (Million) Forecast, by Application 2020 & 2033
- Table 40: Rest of North America Carbon Capture And Utilization Market Volume (Billion) Forecast, by Application 2020 & 2033
- Table 41: Global Carbon Capture And Utilization Market Revenue Million Forecast, by Service 2020 & 2033
- Table 42: Global Carbon Capture And Utilization Market Volume Billion Forecast, by Service 2020 & 2033
- Table 43: Global Carbon Capture And Utilization Market Revenue Million Forecast, by Technology 2020 & 2033
- Table 44: Global Carbon Capture And Utilization Market Volume Billion Forecast, by Technology 2020 & 2033
- Table 45: Global Carbon Capture And Utilization Market Revenue Million Forecast, by End User 2020 & 2033
- Table 46: Global Carbon Capture And Utilization Market Volume Billion Forecast, by End User 2020 & 2033
- Table 47: Global Carbon Capture And Utilization Market Revenue Million Forecast, by Country 2020 & 2033
- Table 48: Global Carbon Capture And Utilization Market Volume Billion Forecast, by Country 2020 & 2033
- Table 49: Germany Carbon Capture And Utilization Market Revenue (Million) Forecast, by Application 2020 & 2033
- Table 50: Germany Carbon Capture And Utilization Market Volume (Billion) Forecast, by Application 2020 & 2033
- Table 51: United Kingdom Carbon Capture And Utilization Market Revenue (Million) Forecast, by Application 2020 & 2033
- Table 52: United Kingdom Carbon Capture And Utilization Market Volume (Billion) Forecast, by Application 2020 & 2033
- Table 53: France Carbon Capture And Utilization Market Revenue (Million) Forecast, by Application 2020 & 2033
- Table 54: France Carbon Capture And Utilization Market Volume (Billion) Forecast, by Application 2020 & 2033
- Table 55: Russia Carbon Capture And Utilization Market Revenue (Million) Forecast, by Application 2020 & 2033
- Table 56: Russia Carbon Capture And Utilization Market Volume (Billion) Forecast, by Application 2020 & 2033
- Table 57: Rest of Europe Carbon Capture And Utilization Market Revenue (Million) Forecast, by Application 2020 & 2033
- Table 58: Rest of Europe Carbon Capture And Utilization Market Volume (Billion) Forecast, by Application 2020 & 2033
- Table 59: Global Carbon Capture And Utilization Market Revenue Million Forecast, by Service 2020 & 2033
- Table 60: Global Carbon Capture And Utilization Market Volume Billion Forecast, by Service 2020 & 2033
- Table 61: Global Carbon Capture And Utilization Market Revenue Million Forecast, by Technology 2020 & 2033
- Table 62: Global Carbon Capture And Utilization Market Volume Billion Forecast, by Technology 2020 & 2033
- Table 63: Global Carbon Capture And Utilization Market Revenue Million Forecast, by End User 2020 & 2033
- Table 64: Global Carbon Capture And Utilization Market Volume Billion Forecast, by End User 2020 & 2033
- Table 65: Global Carbon Capture And Utilization Market Revenue Million Forecast, by Country 2020 & 2033
- Table 66: Global Carbon Capture And Utilization Market Volume Billion Forecast, by Country 2020 & 2033
- Table 67: Brazil Carbon Capture And Utilization Market Revenue (Million) Forecast, by Application 2020 & 2033
- Table 68: Brazil Carbon Capture And Utilization Market Volume (Billion) Forecast, by Application 2020 & 2033
- Table 69: Argentina Carbon Capture And Utilization Market Revenue (Million) Forecast, by Application 2020 & 2033
- Table 70: Argentina Carbon Capture And Utilization Market Volume (Billion) Forecast, by Application 2020 & 2033
- Table 71: Rest of South America Carbon Capture And Utilization Market Revenue (Million) Forecast, by Application 2020 & 2033
- Table 72: Rest of South America Carbon Capture And Utilization Market Volume (Billion) Forecast, by Application 2020 & 2033
- Table 73: Global Carbon Capture And Utilization Market Revenue Million Forecast, by Service 2020 & 2033
- Table 74: Global Carbon Capture And Utilization Market Volume Billion Forecast, by Service 2020 & 2033
- Table 75: Global Carbon Capture And Utilization Market Revenue Million Forecast, by Technology 2020 & 2033
- Table 76: Global Carbon Capture And Utilization Market Volume Billion Forecast, by Technology 2020 & 2033
- Table 77: Global Carbon Capture And Utilization Market Revenue Million Forecast, by End User 2020 & 2033
- Table 78: Global Carbon Capture And Utilization Market Volume Billion Forecast, by End User 2020 & 2033
- Table 79: Global Carbon Capture And Utilization Market Revenue Million Forecast, by Country 2020 & 2033
- Table 80: Global Carbon Capture And Utilization Market Volume Billion Forecast, by Country 2020 & 2033
- Table 81: United Arab Emirates Carbon Capture And Utilization Market Revenue (Million) Forecast, by Application 2020 & 2033
- Table 82: United Arab Emirates Carbon Capture And Utilization Market Volume (Billion) Forecast, by Application 2020 & 2033
- Table 83: South Africa Carbon Capture And Utilization Market Revenue (Million) Forecast, by Application 2020 & 2033
- Table 84: South Africa Carbon Capture And Utilization Market Volume (Billion) Forecast, by Application 2020 & 2033
- Table 85: Rest of Middle East and Africa Carbon Capture And Utilization Market Revenue (Million) Forecast, by Application 2020 & 2033
- Table 86: Rest of Middle East and Africa Carbon Capture And Utilization Market Volume (Billion) Forecast, by Application 2020 & 2033
Frequently Asked Questions
1. What is the projected Compound Annual Growth Rate (CAGR) of the Carbon Capture And Utilization Market?
The projected CAGR is approximately 6.12%.
2. Which companies are prominent players in the Carbon Capture And Utilization Market?
Key companies in the market include ExxonMobil Corporation, Royal Dutch Shell PLC, Chevron Corporation, TotalEnergies SE, BP plc, Equinor ASA, Mitsubishi Heavy Industries Ltd, Air Products and Chemicals Inc, Aker Solutions ASA, Schlumberger Limited.
3. What are the main segments of the Carbon Capture And Utilization Market?
The market segments include Service, Technology, End User.
4. Can you provide details about the market size?
The market size is estimated to be USD 2.45 Million as of 2022.
5. What are some drivers contributing to market growth?
Environmental Regulations and Climate Change Goal; Growing Focuse on Reducing Co2 Emission.
6. What are the notable trends driving market growth?
Oil & Gas Industry was the Major End User in Market.
7. Are there any restraints impacting market growth?
Environmental Regulations and Climate Change Goal; Growing Focuse on Reducing Co2 Emission.
8. Can you provide examples of recent developments in the market?
April 2024: TotalEnergies, a prominent global energy firm, and Vanguard Renewables, a leading US player in converting organic farm waste into renewable natural gas (RNG), inked a deal. The agreement establishes a 50-50 joint venture, intending to develop, construct, and manage Farm Powered RNG initiatives across the United States. Vanguard Renewables, incidentally, is a portfolio company under BlackRock's Diversified Infrastructure business.February 2023: Aker Solutions confirmed signing the contract for the Draugen project with OKEA. The project is expected to reduce emissions by up to 200,000 tons of CO2 per year.
9. What pricing options are available for accessing the report?
Pricing options include single-user, multi-user, and enterprise licenses priced at USD 4750, USD 5250, and USD 8750 respectively.
10. Is the market size provided in terms of value or volume?
The market size is provided in terms of value, measured in Million and volume, measured in Billion.
11. Are there any specific market keywords associated with the report?
Yes, the market keyword associated with the report is "Carbon Capture And Utilization Market," which aids in identifying and referencing the specific market segment covered.
12. How do I determine which pricing option suits my needs best?
The pricing options vary based on user requirements and access needs. Individual users may opt for single-user licenses, while businesses requiring broader access may choose multi-user or enterprise licenses for cost-effective access to the report.
13. Are there any additional resources or data provided in the Carbon Capture And Utilization Market report?
While the report offers comprehensive insights, it's advisable to review the specific contents or supplementary materials provided to ascertain if additional resources or data are available.
14. How can I stay updated on further developments or reports in the Carbon Capture And Utilization Market?
To stay informed about further developments, trends, and reports in the Carbon Capture And Utilization Market, consider subscribing to industry newsletters, following relevant companies and organizations, or regularly checking reputable industry news sources and publications.
Methodology
Step 1 - Identification of Relevant Samples Size from Population Database


Step 2 - Approaches for Defining Global Market Size (Value, Volume* & Price*)

Note*: In applicable scenarios
Step 3 - Data Sources
Primary Research
- Web Analytics
- Survey Reports
- Research Institute
- Latest Research Reports
- Opinion Leaders
Secondary Research
- Annual Reports
- White Paper
- Latest Press Release
- Industry Association
- Paid Database
- Investor Presentations

Step 4 - Data Triangulation
Involves using different sources of information in order to increase the validity of a study
These sources are likely to be stakeholders in a program - participants, other researchers, program staff, other community members, and so on.
Then we put all data in single framework & apply various statistical tools to find out the dynamic on the market.
During the analysis stage, feedback from the stakeholder groups would be compared to determine areas of agreement as well as areas of divergence