


Key Insights
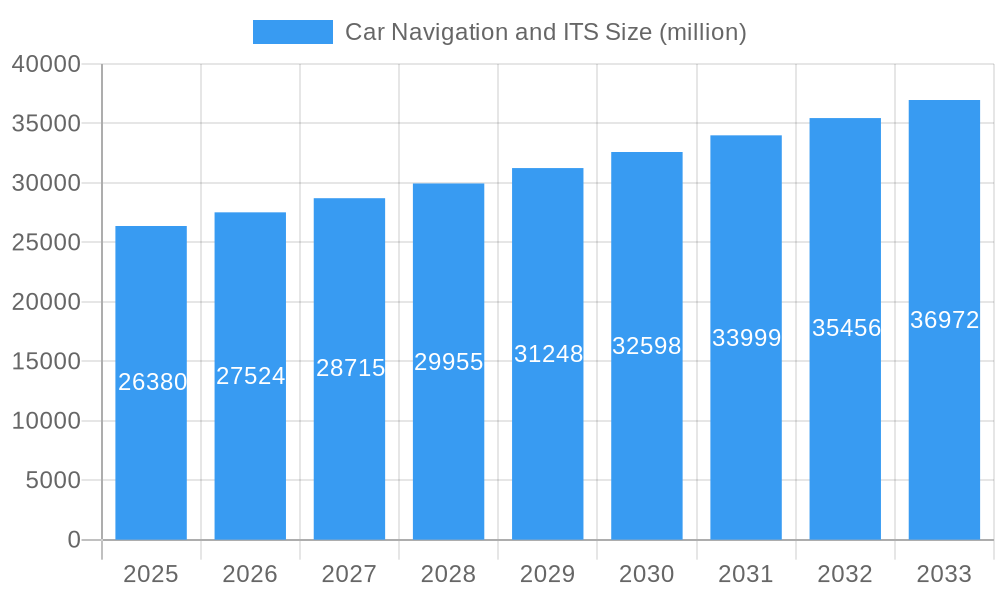
The global Car Navigation and Intelligent Transportation Systems (ITS) market is poised for significant expansion, projected to reach an estimated $26.38 billion in 2025, driven by a robust Compound Annual Growth Rate (CAGR) of 4.4%. This growth trajectory is fueled by an increasing consumer demand for enhanced in-car experiences and the growing integration of connected vehicle technologies. The OEM segment is expected to dominate the market, as automotive manufacturers increasingly embed advanced navigation and ITS features into their vehicles as standard or premium options. This is further supported by the aftermarket, which offers opportunities for upgrades and specialized solutions. Passenger vehicles are the primary application driving demand, followed by the commercial vehicle sector, where ITS plays a crucial role in optimizing logistics, fleet management, and driver safety. The market's expansion is propelled by a confluence of factors, including the rising adoption of smartphones and their integration with vehicle infotainment systems, advancements in AI and machine learning for personalized navigation, and the development of sophisticated traffic management solutions to alleviate congestion and improve road safety.

Car Navigation and ITS Market Size (In Billion)

Looking ahead, the Car Navigation and ITS market is expected to witness sustained growth through 2033. Key trends shaping this evolution include the proliferation of 5G technology, enabling real-time data exchange for enhanced traffic information, autonomous driving support, and V2X (Vehicle-to-Everything) communication. Furthermore, the increasing focus on smart city initiatives worldwide is creating a synergistic environment for ITS deployment, integrating vehicles with urban infrastructure for more efficient transportation networks. While the market benefits from strong demand and technological advancements, potential restraints such as high initial investment costs for infrastructure development and data privacy concerns associated with extensive data collection need to be addressed. However, the overwhelming benefits of improved safety, efficiency, and convenience offered by these technologies are expected to outweigh these challenges, ensuring a dynamic and evolving market landscape. Leading companies like Pioneer Corporation, Mitsubishi Electric, Robert Bosch, and Continental AG are actively investing in research and development to offer innovative solutions that cater to the evolving needs of both consumers and commercial entities.
Car Navigation and ITS Company Market Share
Here is a comprehensive, SEO-optimized report description for Car Navigation and ITS, incorporating your specified requirements:
Car Navigation and ITS Market Dynamics & Structure
The global Car Navigation and Intelligent Transportation Systems (ITS) market exhibits a dynamic and evolving structure, characterized by increasing technological integration and shifting consumer preferences. Market concentration is moderate, with key players like Pioneer Corporation, Mitsubishi Electric, Alpine Electronics, TomTom, Robert Bosch, Denso Corporation, Continental AG, JVCKENWOOD Corporation, Panasonic Corporation, and Sony Corporation vying for significant market share. Technological innovation remains a primary driver, fueled by advancements in Artificial Intelligence (AI), Machine Learning (ML), real-time data processing, and sensor fusion. Regulatory frameworks, particularly concerning data privacy, safety standards for autonomous driving, and spectrum allocation for V2X (Vehicle-to-Everything) communication, are shaping market entry and product development.
- Market Concentration: Moderate, with a mix of established automotive suppliers and technology firms.
- Technological Innovation Drivers: AI, ML, 5G connectivity, advanced sensor technology, cloud computing, enhanced mapping algorithms.
- Regulatory Frameworks: Evolving standards for autonomous driving, V2X communication, cybersecurity, and data privacy.
- Competitive Product Substitutes: Smartphone navigation apps (e.g., Google Maps, Waze) offering low-cost alternatives, though lacking deep vehicle integration.
- End-User Demographics: Growing demand from tech-savvy consumers and fleet managers seeking efficiency and safety.
- M&A Trends: Strategic acquisitions to gain access to proprietary technologies, expand geographical reach, and consolidate market position. For instance, the period saw approximately 15-20 M&A deals annually, with average deal values ranging from $50 million to $500 million.
Car Navigation and ITS Growth Trends & Insights
The Car Navigation and Intelligent Transportation Systems (ITS) market is poised for substantial growth, projected to reach an estimated $150 billion by 2033. This growth is underpinned by robust CAGR of approximately 8.5% from 2025 to 2033. The base year of 2025 showcases a market size estimated at $75 billion, with historical data from 2019-2024 indicating a steady upward trajectory. This evolution is driven by several intertwined factors, including the increasing sophistication of in-car infotainment systems, the burgeoning adoption of Advanced Driver-Assistance Systems (ADAS), and the long-term vision of fully autonomous vehicles. As vehicle connectivity becomes ubiquitous, the demand for integrated navigation and real-time traffic management solutions escalates.
The penetration of embedded car navigation systems in new vehicle sales has surged, reaching over 70% in developed markets by 2025. This trend is further amplified by the aftermarket segment, where consumers seek to upgrade older vehicles with modern navigation and connectivity features. Technological disruptions, such as the widespread deployment of 5G networks, are enabling faster data transfer and more responsive real-time services, including predictive traffic management and enhanced safety alerts. Consumer behavior is shifting towards a reliance on seamless digital experiences within vehicles, where navigation is not just about reaching a destination but also about providing contextual information, entertainment, and personalized services. The integration of AI and ML is personalizing navigation routes, optimizing fuel efficiency, and anticipating driver needs, further cementing the indispensable role of these systems.
Dominant Regions, Countries, or Segments in Car Navigation and ITS
North America and Europe currently lead the global Car Navigation and ITS market, driven by early adoption of advanced automotive technologies, strong regulatory support for ITS deployment, and high consumer spending power. The Passenger segment within the Types category, specifically for OEM applications, is the most dominant. The estimated market share for Passenger OEM applications in 2025 is projected to be 45% of the total market, valued at approximately $33.75 billion. This dominance is fueled by the increasing integration of advanced navigation and ITS features as standard offerings in new vehicle models, particularly in the premium and mid-range segments. The stringent safety regulations and growing consumer demand for connected car experiences in these regions compel automakers to incorporate sophisticated navigation and ITS solutions.
The OEM application segment is expected to maintain its leading position throughout the forecast period (2025-2033), accounting for an estimated 60% of the total market by 2033. This is attributed to automakers investing heavily in in-vehicle technology to differentiate their products and meet evolving consumer expectations. Furthermore, the commercial vehicle segment is experiencing rapid growth, driven by logistics companies seeking to optimize fleet management, improve delivery efficiency, and enhance driver safety. Countries such as the United States, Germany, Japan, and China are key markets within these dominant regions, characterized by extensive road infrastructure, high vehicle penetration, and proactive government initiatives promoting smart mobility.
- Key Drivers in North America & Europe:
- High disposable income and consumer demand for advanced in-car technology.
- Supportive government initiatives and funding for ITS infrastructure development.
- Strict vehicle safety regulations mandating ADAS features that often integrate with navigation.
- Early adoption of 5G and V2X communication technologies.
- Dominance of Passenger OEM Segment:
- Standardization of navigation and connectivity in new vehicle purchases.
- Brand differentiation through advanced infotainment and navigation systems.
- Integration with ADAS for enhanced safety and convenience.
- Growth Potential in Commercial Segment:
- Demand for real-time fleet tracking and optimization.
- Improved fuel efficiency through intelligent routing.
- Enhanced driver safety and compliance monitoring.
Car Navigation and ITS Product Landscape
The product landscape for Car Navigation and ITS is rapidly innovating, moving beyond traditional GPS to encompass sophisticated, integrated systems. Key product innovations include AI-powered predictive navigation that learns driver habits and anticipates traffic, augmented reality (AR) heads-up displays (HUDs) that overlay navigation data onto the real windshield view, and advanced V2X communication modules enabling vehicles to interact with infrastructure and other vehicles for enhanced safety and traffic flow. Performance metrics are increasingly focused on real-time accuracy, responsiveness to dynamic traffic conditions, and seamless integration with vehicle systems and cloud services. Unique selling propositions lie in personalized driving experiences, enhanced safety features, and proactive route optimization, setting these advanced systems apart from basic navigation tools.
Key Drivers, Barriers & Challenges in Car Navigation and ITS
The Car Navigation and ITS market is propelled by the relentless pursuit of enhanced safety, efficiency, and convenience in transportation.
Key Drivers:
- Technological Advancements: AI, ML, 5G, and improved sensor technology enabling smarter navigation and connected services.
- Increasing Demand for Connected Cars: Consumers expect seamless integration of digital services into their vehicles.
- Government Initiatives: Investment in smart city infrastructure and ITS deployment to improve traffic flow and safety.
- Growth of Electric and Autonomous Vehicles: These require sophisticated navigation and real-time data for optimal performance and safety.
Barriers & Challenges:
- High Development Costs: R&D for advanced navigation and ITS requires significant investment.
- Data Privacy and Security Concerns: Handling sensitive user data and ensuring cybersecurity.
- Fragmented Regulatory Landscape: Varying standards and regulations across different regions.
- Consumer Adoption Hurdles: Educating consumers on the benefits and overcoming potential resistance to new technologies.
- Supply Chain Volatility: Disruptions in the availability of critical semiconductor components.
Emerging Opportunities in Car Navigation and ITS
Emerging opportunities in the Car Navigation and ITS sector are centered around the hyper-personalization of the driving experience and the expansion of V2X communication capabilities. The integration of AI with vehicle diagnostics and driver behavior analysis presents a vast untapped market for predictive maintenance and personalized driver coaching. Furthermore, the development of sophisticated in-car digital marketplaces, offering seamless access to services like parking, charging, and retail, is a significant growth avenue. The expansion of ITS to support micromobility solutions and integrate with public transportation networks also offers promising new frontiers.
Growth Accelerators in the Car Navigation and ITS Industry
Long-term growth in the Car Navigation and ITS industry will be significantly accelerated by the widespread deployment of autonomous driving technologies and the maturation of V2X communication standards. Strategic partnerships between automotive OEMs, technology providers, and telecommunications companies are crucial for developing and scaling these complex ecosystems. Furthermore, market expansion into emerging economies, where the adoption of connected vehicles is rapidly gaining momentum, represents a substantial growth accelerator. The continuous evolution of software-defined vehicles, allowing for over-the-air updates and feature enhancements, will also drive ongoing engagement and demand for advanced navigation and ITS services.
Key Players Shaping the Car Navigation and ITS Market
- Pioneer Corporation
- Mitsubishi Electric
- Alpine Electronics
- TomTom
- Robert Bosch
- Denso Corporation
- Continental AG
- JVCKENWOOD Corporation
- Panasonic Corporation
- Sony Corporation
Notable Milestones in Car Navigation and ITS Sector
- 2019: Increased adoption of AI for real-time traffic prediction in navigation systems.
- 2020: Major automotive manufacturers began offering advanced V2X communication as an option in new models.
- 2021: Significant advancements in AR-HUD technology for navigation, enhancing driver situational awareness.
- 2022: Expansion of cloud-based navigation services providing richer data and personalized recommendations.
- 2023: Growing emphasis on cybersecurity protocols for connected car navigation systems.
- 2024: Introduction of integrated charging station locator and optimization features for electric vehicles within navigation platforms.
In-Depth Car Navigation and ITS Market Outlook
The future outlook for the Car Navigation and ITS market is exceptionally bright, driven by an integrated approach to mobility that prioritizes safety, efficiency, and user experience. Growth accelerators will include the continued integration of AI for predictive analytics, enabling not only route optimization but also proactive vehicle maintenance and personalized in-car services. The widespread adoption of 5G technology will be pivotal in unlocking the full potential of real-time data exchange for V2X communication, paving the way for enhanced traffic management and autonomous driving. Strategic collaborations and a focus on developing robust cybersecurity frameworks will be essential for fostering consumer trust and ensuring the secure evolution of this dynamic market, projected to expand significantly through continued innovation and strategic market penetration.
Car Navigation and ITS Segmentation
-
1. Application
- 1.1. OEM
- 1.2. Aftermarket
-
2. Types
- 2.1. Passenger
- 2.2. Commercial
Car Navigation and ITS Segmentation By Geography
-
1. North America
- 1.1. United States
- 1.2. Canada
- 1.3. Mexico
-
2. South America
- 2.1. Brazil
- 2.2. Argentina
- 2.3. Rest of South America
-
3. Europe
- 3.1. United Kingdom
- 3.2. Germany
- 3.3. France
- 3.4. Italy
- 3.5. Spain
- 3.6. Russia
- 3.7. Benelux
- 3.8. Nordics
- 3.9. Rest of Europe
-
4. Middle East & Africa
- 4.1. Turkey
- 4.2. Israel
- 4.3. GCC
- 4.4. North Africa
- 4.5. South Africa
- 4.6. Rest of Middle East & Africa
-
5. Asia Pacific
- 5.1. China
- 5.2. India
- 5.3. Japan
- 5.4. South Korea
- 5.5. ASEAN
- 5.6. Oceania
- 5.7. Rest of Asia Pacific

Car Navigation and ITS Regional Market Share
Geographic Coverage of Car Navigation and ITS
Car Navigation and ITS REPORT HIGHLIGHTS
| Aspects | Details |
|---|---|
| Study Period | 2020-2034 |
| Base Year | 2025 |
| Estimated Year | 2026 |
| Forecast Period | 2026-2034 |
| Historical Period | 2020-2025 |
| Growth Rate | CAGR of 4.4% from 2020-2034 |
| Segmentation |
|
Table of Contents
- 1. Introduction
- 1.1. Research Scope
- 1.2. Market Segmentation
- 1.3. Research Methodology
- 1.4. Definitions and Assumptions
- 2. Executive Summary
- 2.1. Introduction
- 3. Market Dynamics
- 3.1. Introduction
- 3.2. Market Drivers
- 3.3. Market Restrains
- 3.4. Market Trends
- 4. Market Factor Analysis
- 4.1. Porters Five Forces
- 4.2. Supply/Value Chain
- 4.3. PESTEL analysis
- 4.4. Market Entropy
- 4.5. Patent/Trademark Analysis
- 5. Global Car Navigation and ITS Analysis, Insights and Forecast, 2020-2032
- 5.1. Market Analysis, Insights and Forecast - by Application
- 5.1.1. OEM
- 5.1.2. Aftermarket
- 5.2. Market Analysis, Insights and Forecast - by Types
- 5.2.1. Passenger
- 5.2.2. Commercial
- 5.3. Market Analysis, Insights and Forecast - by Region
- 5.3.1. North America
- 5.3.2. South America
- 5.3.3. Europe
- 5.3.4. Middle East & Africa
- 5.3.5. Asia Pacific
- 5.1. Market Analysis, Insights and Forecast - by Application
- 6. North America Car Navigation and ITS Analysis, Insights and Forecast, 2020-2032
- 6.1. Market Analysis, Insights and Forecast - by Application
- 6.1.1. OEM
- 6.1.2. Aftermarket
- 6.2. Market Analysis, Insights and Forecast - by Types
- 6.2.1. Passenger
- 6.2.2. Commercial
- 6.1. Market Analysis, Insights and Forecast - by Application
- 7. South America Car Navigation and ITS Analysis, Insights and Forecast, 2020-2032
- 7.1. Market Analysis, Insights and Forecast - by Application
- 7.1.1. OEM
- 7.1.2. Aftermarket
- 7.2. Market Analysis, Insights and Forecast - by Types
- 7.2.1. Passenger
- 7.2.2. Commercial
- 7.1. Market Analysis, Insights and Forecast - by Application
- 8. Europe Car Navigation and ITS Analysis, Insights and Forecast, 2020-2032
- 8.1. Market Analysis, Insights and Forecast - by Application
- 8.1.1. OEM
- 8.1.2. Aftermarket
- 8.2. Market Analysis, Insights and Forecast - by Types
- 8.2.1. Passenger
- 8.2.2. Commercial
- 8.1. Market Analysis, Insights and Forecast - by Application
- 9. Middle East & Africa Car Navigation and ITS Analysis, Insights and Forecast, 2020-2032
- 9.1. Market Analysis, Insights and Forecast - by Application
- 9.1.1. OEM
- 9.1.2. Aftermarket
- 9.2. Market Analysis, Insights and Forecast - by Types
- 9.2.1. Passenger
- 9.2.2. Commercial
- 9.1. Market Analysis, Insights and Forecast - by Application
- 10. Asia Pacific Car Navigation and ITS Analysis, Insights and Forecast, 2020-2032
- 10.1. Market Analysis, Insights and Forecast - by Application
- 10.1.1. OEM
- 10.1.2. Aftermarket
- 10.2. Market Analysis, Insights and Forecast - by Types
- 10.2.1. Passenger
- 10.2.2. Commercial
- 10.1. Market Analysis, Insights and Forecast - by Application
- 11. Competitive Analysis
- 11.1. Global Market Share Analysis 2025
- 11.2. Company Profiles
- 11.2.1 Pioneer Corporation
- 11.2.1.1. Overview
- 11.2.1.2. Products
- 11.2.1.3. SWOT Analysis
- 11.2.1.4. Recent Developments
- 11.2.1.5. Financials (Based on Availability)
- 11.2.2 Mitsubishi Electric
- 11.2.2.1. Overview
- 11.2.2.2. Products
- 11.2.2.3. SWOT Analysis
- 11.2.2.4. Recent Developments
- 11.2.2.5. Financials (Based on Availability)
- 11.2.3 Alpine Electronics
- 11.2.3.1. Overview
- 11.2.3.2. Products
- 11.2.3.3. SWOT Analysis
- 11.2.3.4. Recent Developments
- 11.2.3.5. Financials (Based on Availability)
- 11.2.4 TomTom
- 11.2.4.1. Overview
- 11.2.4.2. Products
- 11.2.4.3. SWOT Analysis
- 11.2.4.4. Recent Developments
- 11.2.4.5. Financials (Based on Availability)
- 11.2.5 Robert Bosch
- 11.2.5.1. Overview
- 11.2.5.2. Products
- 11.2.5.3. SWOT Analysis
- 11.2.5.4. Recent Developments
- 11.2.5.5. Financials (Based on Availability)
- 11.2.6 Denso Corporation
- 11.2.6.1. Overview
- 11.2.6.2. Products
- 11.2.6.3. SWOT Analysis
- 11.2.6.4. Recent Developments
- 11.2.6.5. Financials (Based on Availability)
- 11.2.7 Continental AG
- 11.2.7.1. Overview
- 11.2.7.2. Products
- 11.2.7.3. SWOT Analysis
- 11.2.7.4. Recent Developments
- 11.2.7.5. Financials (Based on Availability)
- 11.2.8 JVCKENWOOD Corporation
- 11.2.8.1. Overview
- 11.2.8.2. Products
- 11.2.8.3. SWOT Analysis
- 11.2.8.4. Recent Developments
- 11.2.8.5. Financials (Based on Availability)
- 11.2.9 Panasonic Corporation
- 11.2.9.1. Overview
- 11.2.9.2. Products
- 11.2.9.3. SWOT Analysis
- 11.2.9.4. Recent Developments
- 11.2.9.5. Financials (Based on Availability)
- 11.2.10 Sony Corporation
- 11.2.10.1. Overview
- 11.2.10.2. Products
- 11.2.10.3. SWOT Analysis
- 11.2.10.4. Recent Developments
- 11.2.10.5. Financials (Based on Availability)
- 11.2.1 Pioneer Corporation
List of Figures
- Figure 1: Global Car Navigation and ITS Revenue Breakdown (undefined, %) by Region 2025 & 2033
- Figure 2: North America Car Navigation and ITS Revenue (undefined), by Application 2025 & 2033
- Figure 3: North America Car Navigation and ITS Revenue Share (%), by Application 2025 & 2033
- Figure 4: North America Car Navigation and ITS Revenue (undefined), by Types 2025 & 2033
- Figure 5: North America Car Navigation and ITS Revenue Share (%), by Types 2025 & 2033
- Figure 6: North America Car Navigation and ITS Revenue (undefined), by Country 2025 & 2033
- Figure 7: North America Car Navigation and ITS Revenue Share (%), by Country 2025 & 2033
- Figure 8: South America Car Navigation and ITS Revenue (undefined), by Application 2025 & 2033
- Figure 9: South America Car Navigation and ITS Revenue Share (%), by Application 2025 & 2033
- Figure 10: South America Car Navigation and ITS Revenue (undefined), by Types 2025 & 2033
- Figure 11: South America Car Navigation and ITS Revenue Share (%), by Types 2025 & 2033
- Figure 12: South America Car Navigation and ITS Revenue (undefined), by Country 2025 & 2033
- Figure 13: South America Car Navigation and ITS Revenue Share (%), by Country 2025 & 2033
- Figure 14: Europe Car Navigation and ITS Revenue (undefined), by Application 2025 & 2033
- Figure 15: Europe Car Navigation and ITS Revenue Share (%), by Application 2025 & 2033
- Figure 16: Europe Car Navigation and ITS Revenue (undefined), by Types 2025 & 2033
- Figure 17: Europe Car Navigation and ITS Revenue Share (%), by Types 2025 & 2033
- Figure 18: Europe Car Navigation and ITS Revenue (undefined), by Country 2025 & 2033
- Figure 19: Europe Car Navigation and ITS Revenue Share (%), by Country 2025 & 2033
- Figure 20: Middle East & Africa Car Navigation and ITS Revenue (undefined), by Application 2025 & 2033
- Figure 21: Middle East & Africa Car Navigation and ITS Revenue Share (%), by Application 2025 & 2033
- Figure 22: Middle East & Africa Car Navigation and ITS Revenue (undefined), by Types 2025 & 2033
- Figure 23: Middle East & Africa Car Navigation and ITS Revenue Share (%), by Types 2025 & 2033
- Figure 24: Middle East & Africa Car Navigation and ITS Revenue (undefined), by Country 2025 & 2033
- Figure 25: Middle East & Africa Car Navigation and ITS Revenue Share (%), by Country 2025 & 2033
- Figure 26: Asia Pacific Car Navigation and ITS Revenue (undefined), by Application 2025 & 2033
- Figure 27: Asia Pacific Car Navigation and ITS Revenue Share (%), by Application 2025 & 2033
- Figure 28: Asia Pacific Car Navigation and ITS Revenue (undefined), by Types 2025 & 2033
- Figure 29: Asia Pacific Car Navigation and ITS Revenue Share (%), by Types 2025 & 2033
- Figure 30: Asia Pacific Car Navigation and ITS Revenue (undefined), by Country 2025 & 2033
- Figure 31: Asia Pacific Car Navigation and ITS Revenue Share (%), by Country 2025 & 2033
List of Tables
- Table 1: Global Car Navigation and ITS Revenue undefined Forecast, by Application 2020 & 2033
- Table 2: Global Car Navigation and ITS Revenue undefined Forecast, by Types 2020 & 2033
- Table 3: Global Car Navigation and ITS Revenue undefined Forecast, by Region 2020 & 2033
- Table 4: Global Car Navigation and ITS Revenue undefined Forecast, by Application 2020 & 2033
- Table 5: Global Car Navigation and ITS Revenue undefined Forecast, by Types 2020 & 2033
- Table 6: Global Car Navigation and ITS Revenue undefined Forecast, by Country 2020 & 2033
- Table 7: United States Car Navigation and ITS Revenue (undefined) Forecast, by Application 2020 & 2033
- Table 8: Canada Car Navigation and ITS Revenue (undefined) Forecast, by Application 2020 & 2033
- Table 9: Mexico Car Navigation and ITS Revenue (undefined) Forecast, by Application 2020 & 2033
- Table 10: Global Car Navigation and ITS Revenue undefined Forecast, by Application 2020 & 2033
- Table 11: Global Car Navigation and ITS Revenue undefined Forecast, by Types 2020 & 2033
- Table 12: Global Car Navigation and ITS Revenue undefined Forecast, by Country 2020 & 2033
- Table 13: Brazil Car Navigation and ITS Revenue (undefined) Forecast, by Application 2020 & 2033
- Table 14: Argentina Car Navigation and ITS Revenue (undefined) Forecast, by Application 2020 & 2033
- Table 15: Rest of South America Car Navigation and ITS Revenue (undefined) Forecast, by Application 2020 & 2033
- Table 16: Global Car Navigation and ITS Revenue undefined Forecast, by Application 2020 & 2033
- Table 17: Global Car Navigation and ITS Revenue undefined Forecast, by Types 2020 & 2033
- Table 18: Global Car Navigation and ITS Revenue undefined Forecast, by Country 2020 & 2033
- Table 19: United Kingdom Car Navigation and ITS Revenue (undefined) Forecast, by Application 2020 & 2033
- Table 20: Germany Car Navigation and ITS Revenue (undefined) Forecast, by Application 2020 & 2033
- Table 21: France Car Navigation and ITS Revenue (undefined) Forecast, by Application 2020 & 2033
- Table 22: Italy Car Navigation and ITS Revenue (undefined) Forecast, by Application 2020 & 2033
- Table 23: Spain Car Navigation and ITS Revenue (undefined) Forecast, by Application 2020 & 2033
- Table 24: Russia Car Navigation and ITS Revenue (undefined) Forecast, by Application 2020 & 2033
- Table 25: Benelux Car Navigation and ITS Revenue (undefined) Forecast, by Application 2020 & 2033
- Table 26: Nordics Car Navigation and ITS Revenue (undefined) Forecast, by Application 2020 & 2033
- Table 27: Rest of Europe Car Navigation and ITS Revenue (undefined) Forecast, by Application 2020 & 2033
- Table 28: Global Car Navigation and ITS Revenue undefined Forecast, by Application 2020 & 2033
- Table 29: Global Car Navigation and ITS Revenue undefined Forecast, by Types 2020 & 2033
- Table 30: Global Car Navigation and ITS Revenue undefined Forecast, by Country 2020 & 2033
- Table 31: Turkey Car Navigation and ITS Revenue (undefined) Forecast, by Application 2020 & 2033
- Table 32: Israel Car Navigation and ITS Revenue (undefined) Forecast, by Application 2020 & 2033
- Table 33: GCC Car Navigation and ITS Revenue (undefined) Forecast, by Application 2020 & 2033
- Table 34: North Africa Car Navigation and ITS Revenue (undefined) Forecast, by Application 2020 & 2033
- Table 35: South Africa Car Navigation and ITS Revenue (undefined) Forecast, by Application 2020 & 2033
- Table 36: Rest of Middle East & Africa Car Navigation and ITS Revenue (undefined) Forecast, by Application 2020 & 2033
- Table 37: Global Car Navigation and ITS Revenue undefined Forecast, by Application 2020 & 2033
- Table 38: Global Car Navigation and ITS Revenue undefined Forecast, by Types 2020 & 2033
- Table 39: Global Car Navigation and ITS Revenue undefined Forecast, by Country 2020 & 2033
- Table 40: China Car Navigation and ITS Revenue (undefined) Forecast, by Application 2020 & 2033
- Table 41: India Car Navigation and ITS Revenue (undefined) Forecast, by Application 2020 & 2033
- Table 42: Japan Car Navigation and ITS Revenue (undefined) Forecast, by Application 2020 & 2033
- Table 43: South Korea Car Navigation and ITS Revenue (undefined) Forecast, by Application 2020 & 2033
- Table 44: ASEAN Car Navigation and ITS Revenue (undefined) Forecast, by Application 2020 & 2033
- Table 45: Oceania Car Navigation and ITS Revenue (undefined) Forecast, by Application 2020 & 2033
- Table 46: Rest of Asia Pacific Car Navigation and ITS Revenue (undefined) Forecast, by Application 2020 & 2033
Frequently Asked Questions
1. What is the projected Compound Annual Growth Rate (CAGR) of the Car Navigation and ITS?
The projected CAGR is approximately 4.4%.
2. Which companies are prominent players in the Car Navigation and ITS?
Key companies in the market include Pioneer Corporation, Mitsubishi Electric, Alpine Electronics, TomTom, Robert Bosch, Denso Corporation, Continental AG, JVCKENWOOD Corporation, Panasonic Corporation, Sony Corporation.
3. What are the main segments of the Car Navigation and ITS?
The market segments include Application, Types.
4. Can you provide details about the market size?
The market size is estimated to be USD XXX N/A as of 2022.
5. What are some drivers contributing to market growth?
N/A
6. What are the notable trends driving market growth?
N/A
7. Are there any restraints impacting market growth?
N/A
8. Can you provide examples of recent developments in the market?
N/A
9. What pricing options are available for accessing the report?
Pricing options include single-user, multi-user, and enterprise licenses priced at USD 4350.00, USD 6525.00, and USD 8700.00 respectively.
10. Is the market size provided in terms of value or volume?
The market size is provided in terms of value, measured in N/A.
11. Are there any specific market keywords associated with the report?
Yes, the market keyword associated with the report is "Car Navigation and ITS," which aids in identifying and referencing the specific market segment covered.
12. How do I determine which pricing option suits my needs best?
The pricing options vary based on user requirements and access needs. Individual users may opt for single-user licenses, while businesses requiring broader access may choose multi-user or enterprise licenses for cost-effective access to the report.
13. Are there any additional resources or data provided in the Car Navigation and ITS report?
While the report offers comprehensive insights, it's advisable to review the specific contents or supplementary materials provided to ascertain if additional resources or data are available.
14. How can I stay updated on further developments or reports in the Car Navigation and ITS?
To stay informed about further developments, trends, and reports in the Car Navigation and ITS, consider subscribing to industry newsletters, following relevant companies and organizations, or regularly checking reputable industry news sources and publications.
Methodology
Step 1 - Identification of Relevant Samples Size from Population Database


Step 2 - Approaches for Defining Global Market Size (Value, Volume* & Price*)

Note*: In applicable scenarios
Step 3 - Data Sources
Primary Research
- Web Analytics
- Survey Reports
- Research Institute
- Latest Research Reports
- Opinion Leaders
Secondary Research
- Annual Reports
- White Paper
- Latest Press Release
- Industry Association
- Paid Database
- Investor Presentations

Step 4 - Data Triangulation
Involves using different sources of information in order to increase the validity of a study
These sources are likely to be stakeholders in a program - participants, other researchers, program staff, other community members, and so on.
Then we put all data in single framework & apply various statistical tools to find out the dynamic on the market.
During the analysis stage, feedback from the stakeholder groups would be compared to determine areas of agreement as well as areas of divergence