
Key Insights
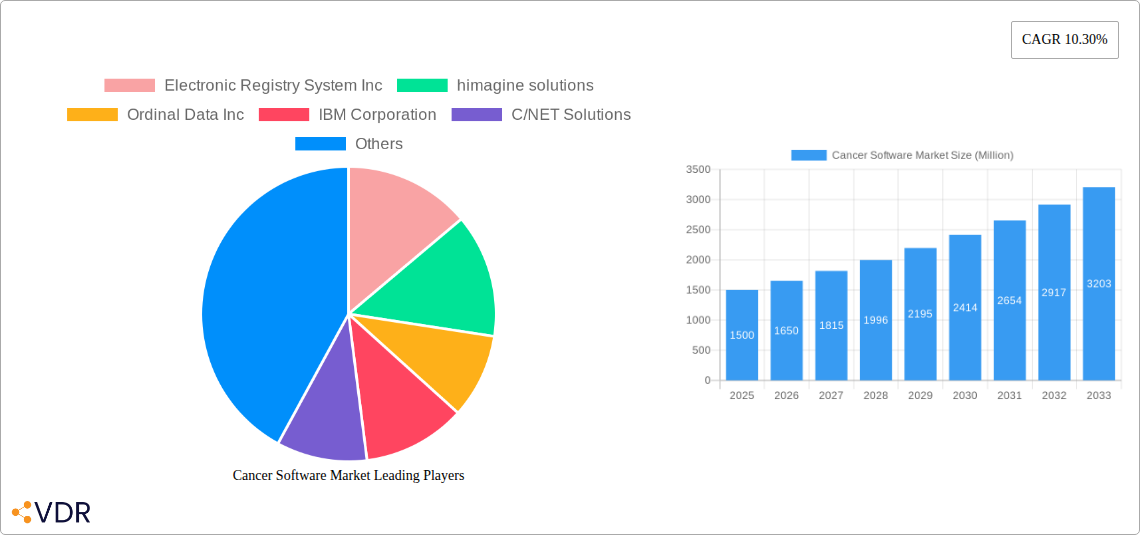
The global cancer software market is experiencing robust growth, driven by the increasing prevalence of cancer, advancements in oncology research leading to more sophisticated treatment strategies, and the rising adoption of electronic health records (EHRs). The market's Compound Annual Growth Rate (CAGR) of 10.30% from 2019 to 2024 suggests a significant expansion, and this momentum is expected to continue through 2033. Key factors contributing to this growth include the need for efficient data management and analysis in oncology, the increasing demand for personalized medicine, and the growing focus on improving patient outcomes through better treatment planning and monitoring. The cloud-based deployment model is gaining traction due to its scalability, accessibility, and cost-effectiveness compared to on-premise solutions. Furthermore, the integration of artificial intelligence (AI) and machine learning (ML) algorithms in cancer software is revolutionizing diagnosis, treatment planning, and research, further fueling market expansion. The market is segmented by deployment model (on-premise and cloud-based), database type (commercial and public), and end-use (government & third-party payers, private payers, hospitals & medical practices, and others). North America currently holds a significant market share, driven by robust healthcare infrastructure and technological advancements, but the Asia-Pacific region is projected to witness substantial growth due to increasing healthcare spending and rising cancer incidence. Competition is intense, with established players like IBM and McKesson alongside specialized firms like Electronic Registry System Inc. and imagine solutions vying for market share. The ongoing innovation in cancer research and the increasing demand for effective cancer management solutions will continue to shape this dynamic market.
The future of the cancer software market hinges on several factors. Continued investment in research and development of advanced AI and ML capabilities will be critical in enhancing the diagnostic accuracy, treatment efficacy, and personalized medicine approaches offered by these software solutions. Regulations concerning data privacy and security will play a crucial role in shaping market adoption, especially in the cloud-based segment. The integration of cancer software with existing EHR systems will also be key to streamlining workflows and improving overall healthcare efficiency. Finally, the increasing focus on value-based care models will necessitate the development of software solutions that demonstrate a clear return on investment by improving patient outcomes and reducing healthcare costs. Companies focusing on developing user-friendly, interoperable, and cost-effective solutions that address the specific needs of various stakeholders will be best positioned for success in this growing and evolving market.
Cancer Software Market: A Comprehensive Report (2019-2033)
This in-depth report provides a comprehensive analysis of the Cancer Software Market, encompassing market dynamics, growth trends, regional dominance, product landscape, key players, and future outlook. The study period spans from 2019 to 2033, with 2025 serving as the base and estimated year. The report meticulously segments the market by deployment model (On-Premise, Cloud-based), database type (Commercial Database, Public Database), and end-use (Government & Third Party, Private Payers, Hospital & Medical Practice, Others), offering granular insights into each segment's contribution to overall market growth. The total market size is projected to reach xx Million by 2033.
Cancer Software Market Dynamics & Structure
The Cancer Software Market is characterized by a moderately concentrated landscape, with key players vying for market share through technological innovation and strategic partnerships. The market's growth is fueled by the rising prevalence of cancer, increasing demand for efficient cancer management solutions, and advancements in data analytics and artificial intelligence. However, regulatory hurdles, data privacy concerns, and high implementation costs pose significant challenges. Mergers and acquisitions (M&A) activity is expected to remain robust, with larger players acquiring smaller companies to expand their product portfolios and geographical reach.
- Market Concentration: Moderately concentrated, with the top 5 players holding approximately xx% of the market share in 2024.
- Technological Innovation: AI-powered diagnostics, predictive analytics, and personalized medicine are driving innovation.
- Regulatory Framework: Stringent data privacy regulations (e.g., HIPAA, GDPR) influence market dynamics.
- Competitive Product Substitutes: Limited direct substitutes, but alternative cancer treatment approaches impact demand.
- End-User Demographics: Growth driven by increased adoption in hospitals, medical practices, and research institutions.
- M&A Trends: Significant M&A activity observed in recent years, with an estimated xx deals in 2024, primarily focusing on expanding product offerings and market reach.
Cancer Software Market Growth Trends & Insights
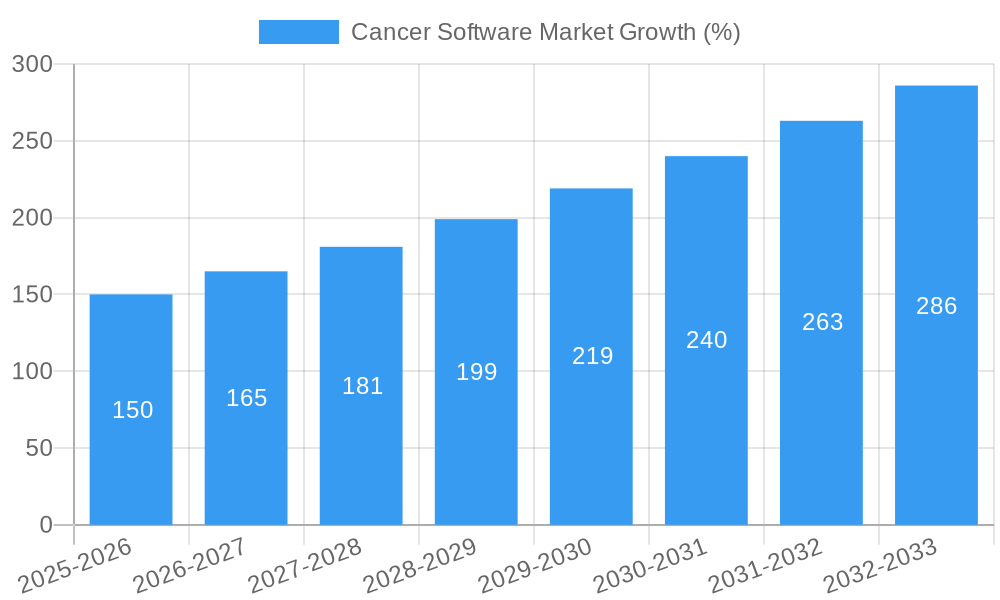
The Cancer Software Market is experiencing robust growth, driven by several factors. Technological advancements, such as the integration of AI and machine learning, are significantly improving diagnostic accuracy, treatment planning, and patient monitoring. Increasing adoption of cloud-based solutions enhances accessibility and scalability. The market is witnessing a shift towards personalized cancer care, with software solutions playing a crucial role in tailoring treatment plans to individual patient needs. Furthermore, supportive government initiatives and increased funding for cancer research are bolstering market expansion. The CAGR for the forecast period (2025-2033) is estimated to be xx%, with market penetration expected to reach xx% by 2033.
Dominant Regions, Countries, or Segments in Cancer Software Market
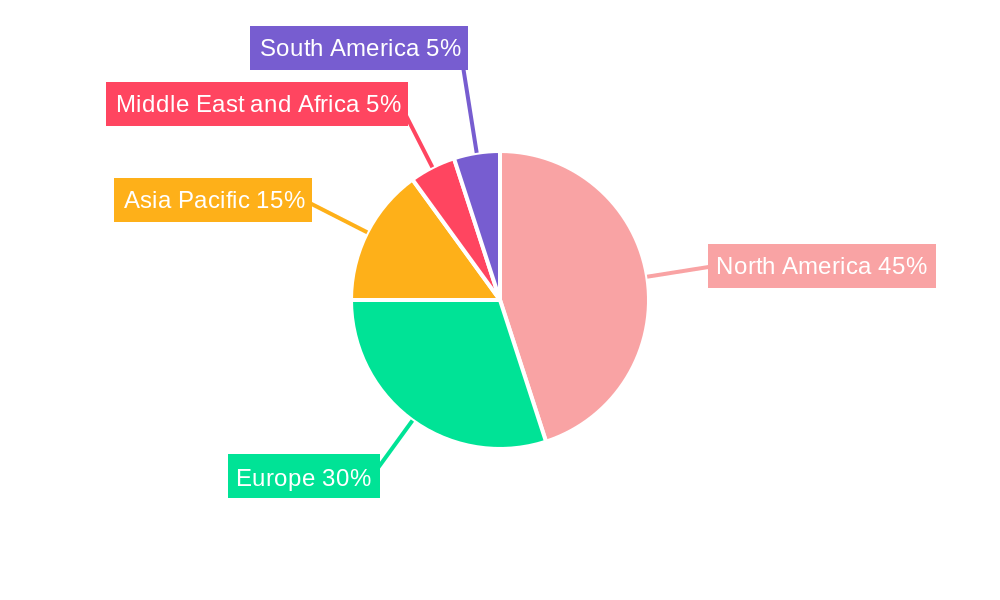
North America currently dominates the Cancer Software Market, driven by high healthcare expenditure, advanced healthcare infrastructure, and early adoption of innovative technologies. Within this region, the United States holds the largest market share. The cloud-based deployment model is experiencing the fastest growth, followed by the Hospital & Medical Practice segment in terms of end-use.
- North America: High healthcare expenditure, advanced infrastructure, and early adoption of new technologies drive market leadership.
- Europe: Stringent regulatory frameworks and increasing healthcare investments contribute to steady growth.
- Asia-Pacific: Rapidly expanding healthcare sector and rising prevalence of cancer fuel market growth, though at a slower pace than North America.
- Cloud-based Deployment Model: Offers scalability, accessibility, and cost-effectiveness, leading to rapid adoption.
- Hospital & Medical Practice End-Use: High demand for efficient cancer management solutions in healthcare settings.
Cancer Software Market Product Landscape
Cancer software solutions encompass a range of products, from Electronic Health Records (EHR) systems tailored for oncology to specialized software for radiation therapy planning, clinical trials management, and patient monitoring. These solutions incorporate advanced analytics, AI, and machine learning capabilities to enhance diagnostic accuracy, personalize treatment, and improve patient outcomes. Unique selling propositions often focus on ease of use, data security, integration capabilities, and the provision of actionable insights.
Key Drivers, Barriers & Challenges in Cancer Software Market
Key Drivers:
- Rising cancer prevalence globally
- Increasing demand for personalized cancer care
- Advancements in AI and machine learning for cancer diagnostics and treatment
- Government initiatives and funding for cancer research
- Growing adoption of cloud-based solutions
Key Barriers & Challenges:
- High implementation and maintenance costs
- Data privacy and security concerns
- Stringent regulatory requirements
- Integration challenges with existing healthcare IT infrastructure
- Limited awareness and adoption in certain regions
Emerging Opportunities in Cancer Software Market
- Expanding applications in telemedicine and remote patient monitoring
- Integration with wearable sensors for real-time patient data collection
- Development of AI-powered tools for early cancer detection
- Growing demand for software solutions in clinical trials management
- Penetration into underserved markets in developing countries
Growth Accelerators in the Cancer Software Market Industry
Strategic partnerships between technology companies and healthcare providers are driving market growth. Technological innovations, particularly in AI and machine learning, are leading to the development of more sophisticated and efficient cancer software solutions. Expanding awareness of the benefits of cancer software among healthcare professionals and patients is also contributing to market expansion.
Key Players Shaping the Cancer Software Market Market
- Electronic Registry System Inc
- imagine solutions
- Ordinal Data Inc
- IBM Corporation
- C/NET Solutions
- Rocky Mountain Cancer Data Systems
- Conduent Inc
- NeuralFrame Inc
- Onco Inc
- Elekta
- McKesson Corporation
- Siemens Healthineers
*List Not Exhaustive
Notable Milestones in Cancer Software Market Sector
- May 2022: Kaiku Health and Roche partnered for digital patient monitoring and management (DPMM), aiming to improve personalized cancer care globally.
- March 2022: Elekta's ProKnow software solution received multiple licenses from the NHSSC, enhancing radiotherapy data analysis across England's radiation oncology facilities.
In-Depth Cancer Software Market Market Outlook
The Cancer Software Market is poised for continued growth, driven by technological advancements, increased adoption rates, and expanding applications. Strategic partnerships, investments in R&D, and the expansion into new markets present significant opportunities for market players. The focus on personalized medicine and the integration of AI and machine learning will shape the future of cancer software, leading to more accurate diagnostics, effective treatment planning, and improved patient outcomes. The market is expected to witness a considerable expansion in the coming years, presenting lucrative investment prospects for stakeholders.
Cancer Software Market Segmentation
-
1. Deployment Model
- 1.1. On-Premise
- 1.2. Cloud-based
-
2. Database Type
- 2.1. Commercial Database
- 2.2. Public Database
-
3. End Use
- 3.1. Government & Third Party
- 3.2. Private Payers
- 3.3. Hospital & Medical Practice
- 3.4. Others
Cancer Software Market Segmentation By Geography
-
1. North America
- 1.1. United States
- 1.2. Canada
- 1.3. Mexico
-
2. Europe
- 2.1. Germany
- 2.2. United Kingdom
- 2.3. France
- 2.4. Italy
- 2.5. Spain
- 2.6. Rest of Europe
-
3. Asia Pacific
- 3.1. China
- 3.2. Japan
- 3.3. India
- 3.4. Australia
- 3.5. South Korea
- 3.6. Rest of Asia Pacific
-
4. Middle East and Africa
- 4.1. GCC
- 4.2. South Africa
- 4.3. Rest of Middle East and Africa
-
5. South America
- 5.1. Brazil
- 5.2. Argentina
- 5.3. Rest of South America
Cancer Software Market REPORT HIGHLIGHTS
| Aspects | Details |
|---|---|
| Study Period | 2019-2033 |
| Base Year | 2024 |
| Estimated Year | 2025 |
| Forecast Period | 2025-2033 |
| Historical Period | 2019-2024 |
| Growth Rate | CAGR of 10.30% from 2019-2033 |
| Segmentation |
|
Table of Contents
- 1. Introduction
- 1.1. Research Scope
- 1.2. Market Segmentation
- 1.3. Research Methodology
- 1.4. Definitions and Assumptions
- 2. Executive Summary
- 2.1. Introduction
- 3. Market Dynamics
- 3.1. Introduction
- 3.2. Market Drivers
- 3.2.1. Increasing Prevalence of Cancer; Improving Quality of Care and Reducing Healthcare Costs
- 3.3. Market Restrains
- 3.3.1. Privacy and Security Concerns for Patient Data
- 3.4. Market Trends
- 3.4.1. Hospital & Medical Practice are Expected to Hold a Significant Market Share Over the Forecast Period
- 4. Market Factor Analysis
- 4.1. Porters Five Forces
- 4.2. Supply/Value Chain
- 4.3. PESTEL analysis
- 4.4. Market Entropy
- 4.5. Patent/Trademark Analysis
- 5. Global Cancer Software Market Analysis, Insights and Forecast, 2019-2031
- 5.1. Market Analysis, Insights and Forecast - by Deployment Model
- 5.1.1. On-Premise
- 5.1.2. Cloud-based
- 5.2. Market Analysis, Insights and Forecast - by Database Type
- 5.2.1. Commercial Database
- 5.2.2. Public Database
- 5.3. Market Analysis, Insights and Forecast - by End Use
- 5.3.1. Government & Third Party
- 5.3.2. Private Payers
- 5.3.3. Hospital & Medical Practice
- 5.3.4. Others
- 5.4. Market Analysis, Insights and Forecast - by Region
- 5.4.1. North America
- 5.4.2. Europe
- 5.4.3. Asia Pacific
- 5.4.4. Middle East and Africa
- 5.4.5. South America
- 5.1. Market Analysis, Insights and Forecast - by Deployment Model
- 6. North America Cancer Software Market Analysis, Insights and Forecast, 2019-2031
- 6.1. Market Analysis, Insights and Forecast - by Deployment Model
- 6.1.1. On-Premise
- 6.1.2. Cloud-based
- 6.2. Market Analysis, Insights and Forecast - by Database Type
- 6.2.1. Commercial Database
- 6.2.2. Public Database
- 6.3. Market Analysis, Insights and Forecast - by End Use
- 6.3.1. Government & Third Party
- 6.3.2. Private Payers
- 6.3.3. Hospital & Medical Practice
- 6.3.4. Others
- 6.1. Market Analysis, Insights and Forecast - by Deployment Model
- 7. Europe Cancer Software Market Analysis, Insights and Forecast, 2019-2031
- 7.1. Market Analysis, Insights and Forecast - by Deployment Model
- 7.1.1. On-Premise
- 7.1.2. Cloud-based
- 7.2. Market Analysis, Insights and Forecast - by Database Type
- 7.2.1. Commercial Database
- 7.2.2. Public Database
- 7.3. Market Analysis, Insights and Forecast - by End Use
- 7.3.1. Government & Third Party
- 7.3.2. Private Payers
- 7.3.3. Hospital & Medical Practice
- 7.3.4. Others
- 7.1. Market Analysis, Insights and Forecast - by Deployment Model
- 8. Asia Pacific Cancer Software Market Analysis, Insights and Forecast, 2019-2031
- 8.1. Market Analysis, Insights and Forecast - by Deployment Model
- 8.1.1. On-Premise
- 8.1.2. Cloud-based
- 8.2. Market Analysis, Insights and Forecast - by Database Type
- 8.2.1. Commercial Database
- 8.2.2. Public Database
- 8.3. Market Analysis, Insights and Forecast - by End Use
- 8.3.1. Government & Third Party
- 8.3.2. Private Payers
- 8.3.3. Hospital & Medical Practice
- 8.3.4. Others
- 8.1. Market Analysis, Insights and Forecast - by Deployment Model
- 9. Middle East and Africa Cancer Software Market Analysis, Insights and Forecast, 2019-2031
- 9.1. Market Analysis, Insights and Forecast - by Deployment Model
- 9.1.1. On-Premise
- 9.1.2. Cloud-based
- 9.2. Market Analysis, Insights and Forecast - by Database Type
- 9.2.1. Commercial Database
- 9.2.2. Public Database
- 9.3. Market Analysis, Insights and Forecast - by End Use
- 9.3.1. Government & Third Party
- 9.3.2. Private Payers
- 9.3.3. Hospital & Medical Practice
- 9.3.4. Others
- 9.1. Market Analysis, Insights and Forecast - by Deployment Model
- 10. South America Cancer Software Market Analysis, Insights and Forecast, 2019-2031
- 10.1. Market Analysis, Insights and Forecast - by Deployment Model
- 10.1.1. On-Premise
- 10.1.2. Cloud-based
- 10.2. Market Analysis, Insights and Forecast - by Database Type
- 10.2.1. Commercial Database
- 10.2.2. Public Database
- 10.3. Market Analysis, Insights and Forecast - by End Use
- 10.3.1. Government & Third Party
- 10.3.2. Private Payers
- 10.3.3. Hospital & Medical Practice
- 10.3.4. Others
- 10.1. Market Analysis, Insights and Forecast - by Deployment Model
- 11. North America Cancer Software Market Analysis, Insights and Forecast, 2019-2031
- 11.1. Market Analysis, Insights and Forecast - By Country/Sub-region
- 11.1.1 United States
- 11.1.2 Canada
- 11.1.3 Mexico
- 12. Europe Cancer Software Market Analysis, Insights and Forecast, 2019-2031
- 12.1. Market Analysis, Insights and Forecast - By Country/Sub-region
- 12.1.1 Germany
- 12.1.2 United Kingdom
- 12.1.3 France
- 12.1.4 Italy
- 12.1.5 Spain
- 12.1.6 Rest of Europe
- 13. Asia Pacific Cancer Software Market Analysis, Insights and Forecast, 2019-2031
- 13.1. Market Analysis, Insights and Forecast - By Country/Sub-region
- 13.1.1 China
- 13.1.2 Japan
- 13.1.3 India
- 13.1.4 Australia
- 13.1.5 South Korea
- 13.1.6 Rest of Asia Pacific
- 14. Middle East and Africa Cancer Software Market Analysis, Insights and Forecast, 2019-2031
- 14.1. Market Analysis, Insights and Forecast - By Country/Sub-region
- 14.1.1 GCC
- 14.1.2 South Africa
- 14.1.3 Rest of Middle East and Africa
- 15. South America Cancer Software Market Analysis, Insights and Forecast, 2019-2031
- 15.1. Market Analysis, Insights and Forecast - By Country/Sub-region
- 15.1.1 Brazil
- 15.1.2 Argentina
- 15.1.3 Rest of South America
- 16. Competitive Analysis
- 16.1. Global Market Share Analysis 2024
- 16.2. Company Profiles
- 16.2.1 Electronic Registry System Inc
- 16.2.1.1. Overview
- 16.2.1.2. Products
- 16.2.1.3. SWOT Analysis
- 16.2.1.4. Recent Developments
- 16.2.1.5. Financials (Based on Availability)
- 16.2.2 himagine solutions
- 16.2.2.1. Overview
- 16.2.2.2. Products
- 16.2.2.3. SWOT Analysis
- 16.2.2.4. Recent Developments
- 16.2.2.5. Financials (Based on Availability)
- 16.2.3 Ordinal Data Inc
- 16.2.3.1. Overview
- 16.2.3.2. Products
- 16.2.3.3. SWOT Analysis
- 16.2.3.4. Recent Developments
- 16.2.3.5. Financials (Based on Availability)
- 16.2.4 IBM Corporation
- 16.2.4.1. Overview
- 16.2.4.2. Products
- 16.2.4.3. SWOT Analysis
- 16.2.4.4. Recent Developments
- 16.2.4.5. Financials (Based on Availability)
- 16.2.5 C/NET Solutions
- 16.2.5.1. Overview
- 16.2.5.2. Products
- 16.2.5.3. SWOT Analysis
- 16.2.5.4. Recent Developments
- 16.2.5.5. Financials (Based on Availability)
- 16.2.6 Rocky Mountain Cancer Data Systems
- 16.2.6.1. Overview
- 16.2.6.2. Products
- 16.2.6.3. SWOT Analysis
- 16.2.6.4. Recent Developments
- 16.2.6.5. Financials (Based on Availability)
- 16.2.7 Conduent Inc
- 16.2.7.1. Overview
- 16.2.7.2. Products
- 16.2.7.3. SWOT Analysis
- 16.2.7.4. Recent Developments
- 16.2.7.5. Financials (Based on Availability)
- 16.2.8 NeuralFrame Inc
- 16.2.8.1. Overview
- 16.2.8.2. Products
- 16.2.8.3. SWOT Analysis
- 16.2.8.4. Recent Developments
- 16.2.8.5. Financials (Based on Availability)
- 16.2.9 Onco Inc
- 16.2.9.1. Overview
- 16.2.9.2. Products
- 16.2.9.3. SWOT Analysis
- 16.2.9.4. Recent Developments
- 16.2.9.5. Financials (Based on Availability)
- 16.2.10 Elekta
- 16.2.10.1. Overview
- 16.2.10.2. Products
- 16.2.10.3. SWOT Analysis
- 16.2.10.4. Recent Developments
- 16.2.10.5. Financials (Based on Availability)
- 16.2.11 McKesson Corporation
- 16.2.11.1. Overview
- 16.2.11.2. Products
- 16.2.11.3. SWOT Analysis
- 16.2.11.4. Recent Developments
- 16.2.11.5. Financials (Based on Availability)
- 16.2.12 Siemens Healthineers*List Not Exhaustive
- 16.2.12.1. Overview
- 16.2.12.2. Products
- 16.2.12.3. SWOT Analysis
- 16.2.12.4. Recent Developments
- 16.2.12.5. Financials (Based on Availability)
- 16.2.1 Electronic Registry System Inc
List of Figures
- Figure 1: Global Cancer Software Market Revenue Breakdown (Million, %) by Region 2024 & 2032
- Figure 2: North America Cancer Software Market Revenue (Million), by Country 2024 & 2032
- Figure 3: North America Cancer Software Market Revenue Share (%), by Country 2024 & 2032
- Figure 4: Europe Cancer Software Market Revenue (Million), by Country 2024 & 2032
- Figure 5: Europe Cancer Software Market Revenue Share (%), by Country 2024 & 2032
- Figure 6: Asia Pacific Cancer Software Market Revenue (Million), by Country 2024 & 2032
- Figure 7: Asia Pacific Cancer Software Market Revenue Share (%), by Country 2024 & 2032
- Figure 8: Middle East and Africa Cancer Software Market Revenue (Million), by Country 2024 & 2032
- Figure 9: Middle East and Africa Cancer Software Market Revenue Share (%), by Country 2024 & 2032
- Figure 10: South America Cancer Software Market Revenue (Million), by Country 2024 & 2032
- Figure 11: South America Cancer Software Market Revenue Share (%), by Country 2024 & 2032
- Figure 12: North America Cancer Software Market Revenue (Million), by Deployment Model 2024 & 2032
- Figure 13: North America Cancer Software Market Revenue Share (%), by Deployment Model 2024 & 2032
- Figure 14: North America Cancer Software Market Revenue (Million), by Database Type 2024 & 2032
- Figure 15: North America Cancer Software Market Revenue Share (%), by Database Type 2024 & 2032
- Figure 16: North America Cancer Software Market Revenue (Million), by End Use 2024 & 2032
- Figure 17: North America Cancer Software Market Revenue Share (%), by End Use 2024 & 2032
- Figure 18: North America Cancer Software Market Revenue (Million), by Country 2024 & 2032
- Figure 19: North America Cancer Software Market Revenue Share (%), by Country 2024 & 2032
- Figure 20: Europe Cancer Software Market Revenue (Million), by Deployment Model 2024 & 2032
- Figure 21: Europe Cancer Software Market Revenue Share (%), by Deployment Model 2024 & 2032
- Figure 22: Europe Cancer Software Market Revenue (Million), by Database Type 2024 & 2032
- Figure 23: Europe Cancer Software Market Revenue Share (%), by Database Type 2024 & 2032
- Figure 24: Europe Cancer Software Market Revenue (Million), by End Use 2024 & 2032
- Figure 25: Europe Cancer Software Market Revenue Share (%), by End Use 2024 & 2032
- Figure 26: Europe Cancer Software Market Revenue (Million), by Country 2024 & 2032
- Figure 27: Europe Cancer Software Market Revenue Share (%), by Country 2024 & 2032
- Figure 28: Asia Pacific Cancer Software Market Revenue (Million), by Deployment Model 2024 & 2032
- Figure 29: Asia Pacific Cancer Software Market Revenue Share (%), by Deployment Model 2024 & 2032
- Figure 30: Asia Pacific Cancer Software Market Revenue (Million), by Database Type 2024 & 2032
- Figure 31: Asia Pacific Cancer Software Market Revenue Share (%), by Database Type 2024 & 2032
- Figure 32: Asia Pacific Cancer Software Market Revenue (Million), by End Use 2024 & 2032
- Figure 33: Asia Pacific Cancer Software Market Revenue Share (%), by End Use 2024 & 2032
- Figure 34: Asia Pacific Cancer Software Market Revenue (Million), by Country 2024 & 2032
- Figure 35: Asia Pacific Cancer Software Market Revenue Share (%), by Country 2024 & 2032
- Figure 36: Middle East and Africa Cancer Software Market Revenue (Million), by Deployment Model 2024 & 2032
- Figure 37: Middle East and Africa Cancer Software Market Revenue Share (%), by Deployment Model 2024 & 2032
- Figure 38: Middle East and Africa Cancer Software Market Revenue (Million), by Database Type 2024 & 2032
- Figure 39: Middle East and Africa Cancer Software Market Revenue Share (%), by Database Type 2024 & 2032
- Figure 40: Middle East and Africa Cancer Software Market Revenue (Million), by End Use 2024 & 2032
- Figure 41: Middle East and Africa Cancer Software Market Revenue Share (%), by End Use 2024 & 2032
- Figure 42: Middle East and Africa Cancer Software Market Revenue (Million), by Country 2024 & 2032
- Figure 43: Middle East and Africa Cancer Software Market Revenue Share (%), by Country 2024 & 2032
- Figure 44: South America Cancer Software Market Revenue (Million), by Deployment Model 2024 & 2032
- Figure 45: South America Cancer Software Market Revenue Share (%), by Deployment Model 2024 & 2032
- Figure 46: South America Cancer Software Market Revenue (Million), by Database Type 2024 & 2032
- Figure 47: South America Cancer Software Market Revenue Share (%), by Database Type 2024 & 2032
- Figure 48: South America Cancer Software Market Revenue (Million), by End Use 2024 & 2032
- Figure 49: South America Cancer Software Market Revenue Share (%), by End Use 2024 & 2032
- Figure 50: South America Cancer Software Market Revenue (Million), by Country 2024 & 2032
- Figure 51: South America Cancer Software Market Revenue Share (%), by Country 2024 & 2032
List of Tables
- Table 1: Global Cancer Software Market Revenue Million Forecast, by Region 2019 & 2032
- Table 2: Global Cancer Software Market Revenue Million Forecast, by Deployment Model 2019 & 2032
- Table 3: Global Cancer Software Market Revenue Million Forecast, by Database Type 2019 & 2032
- Table 4: Global Cancer Software Market Revenue Million Forecast, by End Use 2019 & 2032
- Table 5: Global Cancer Software Market Revenue Million Forecast, by Region 2019 & 2032
- Table 6: Global Cancer Software Market Revenue Million Forecast, by Country 2019 & 2032
- Table 7: United States Cancer Software Market Revenue (Million) Forecast, by Application 2019 & 2032
- Table 8: Canada Cancer Software Market Revenue (Million) Forecast, by Application 2019 & 2032
- Table 9: Mexico Cancer Software Market Revenue (Million) Forecast, by Application 2019 & 2032
- Table 10: Global Cancer Software Market Revenue Million Forecast, by Country 2019 & 2032
- Table 11: Germany Cancer Software Market Revenue (Million) Forecast, by Application 2019 & 2032
- Table 12: United Kingdom Cancer Software Market Revenue (Million) Forecast, by Application 2019 & 2032
- Table 13: France Cancer Software Market Revenue (Million) Forecast, by Application 2019 & 2032
- Table 14: Italy Cancer Software Market Revenue (Million) Forecast, by Application 2019 & 2032
- Table 15: Spain Cancer Software Market Revenue (Million) Forecast, by Application 2019 & 2032
- Table 16: Rest of Europe Cancer Software Market Revenue (Million) Forecast, by Application 2019 & 2032
- Table 17: Global Cancer Software Market Revenue Million Forecast, by Country 2019 & 2032
- Table 18: China Cancer Software Market Revenue (Million) Forecast, by Application 2019 & 2032
- Table 19: Japan Cancer Software Market Revenue (Million) Forecast, by Application 2019 & 2032
- Table 20: India Cancer Software Market Revenue (Million) Forecast, by Application 2019 & 2032
- Table 21: Australia Cancer Software Market Revenue (Million) Forecast, by Application 2019 & 2032
- Table 22: South Korea Cancer Software Market Revenue (Million) Forecast, by Application 2019 & 2032
- Table 23: Rest of Asia Pacific Cancer Software Market Revenue (Million) Forecast, by Application 2019 & 2032
- Table 24: Global Cancer Software Market Revenue Million Forecast, by Country 2019 & 2032
- Table 25: GCC Cancer Software Market Revenue (Million) Forecast, by Application 2019 & 2032
- Table 26: South Africa Cancer Software Market Revenue (Million) Forecast, by Application 2019 & 2032
- Table 27: Rest of Middle East and Africa Cancer Software Market Revenue (Million) Forecast, by Application 2019 & 2032
- Table 28: Global Cancer Software Market Revenue Million Forecast, by Country 2019 & 2032
- Table 29: Brazil Cancer Software Market Revenue (Million) Forecast, by Application 2019 & 2032
- Table 30: Argentina Cancer Software Market Revenue (Million) Forecast, by Application 2019 & 2032
- Table 31: Rest of South America Cancer Software Market Revenue (Million) Forecast, by Application 2019 & 2032
- Table 32: Global Cancer Software Market Revenue Million Forecast, by Deployment Model 2019 & 2032
- Table 33: Global Cancer Software Market Revenue Million Forecast, by Database Type 2019 & 2032
- Table 34: Global Cancer Software Market Revenue Million Forecast, by End Use 2019 & 2032
- Table 35: Global Cancer Software Market Revenue Million Forecast, by Country 2019 & 2032
- Table 36: United States Cancer Software Market Revenue (Million) Forecast, by Application 2019 & 2032
- Table 37: Canada Cancer Software Market Revenue (Million) Forecast, by Application 2019 & 2032
- Table 38: Mexico Cancer Software Market Revenue (Million) Forecast, by Application 2019 & 2032
- Table 39: Global Cancer Software Market Revenue Million Forecast, by Deployment Model 2019 & 2032
- Table 40: Global Cancer Software Market Revenue Million Forecast, by Database Type 2019 & 2032
- Table 41: Global Cancer Software Market Revenue Million Forecast, by End Use 2019 & 2032
- Table 42: Global Cancer Software Market Revenue Million Forecast, by Country 2019 & 2032
- Table 43: Germany Cancer Software Market Revenue (Million) Forecast, by Application 2019 & 2032
- Table 44: United Kingdom Cancer Software Market Revenue (Million) Forecast, by Application 2019 & 2032
- Table 45: France Cancer Software Market Revenue (Million) Forecast, by Application 2019 & 2032
- Table 46: Italy Cancer Software Market Revenue (Million) Forecast, by Application 2019 & 2032
- Table 47: Spain Cancer Software Market Revenue (Million) Forecast, by Application 2019 & 2032
- Table 48: Rest of Europe Cancer Software Market Revenue (Million) Forecast, by Application 2019 & 2032
- Table 49: Global Cancer Software Market Revenue Million Forecast, by Deployment Model 2019 & 2032
- Table 50: Global Cancer Software Market Revenue Million Forecast, by Database Type 2019 & 2032
- Table 51: Global Cancer Software Market Revenue Million Forecast, by End Use 2019 & 2032
- Table 52: Global Cancer Software Market Revenue Million Forecast, by Country 2019 & 2032
- Table 53: China Cancer Software Market Revenue (Million) Forecast, by Application 2019 & 2032
- Table 54: Japan Cancer Software Market Revenue (Million) Forecast, by Application 2019 & 2032
- Table 55: India Cancer Software Market Revenue (Million) Forecast, by Application 2019 & 2032
- Table 56: Australia Cancer Software Market Revenue (Million) Forecast, by Application 2019 & 2032
- Table 57: South Korea Cancer Software Market Revenue (Million) Forecast, by Application 2019 & 2032
- Table 58: Rest of Asia Pacific Cancer Software Market Revenue (Million) Forecast, by Application 2019 & 2032
- Table 59: Global Cancer Software Market Revenue Million Forecast, by Deployment Model 2019 & 2032
- Table 60: Global Cancer Software Market Revenue Million Forecast, by Database Type 2019 & 2032
- Table 61: Global Cancer Software Market Revenue Million Forecast, by End Use 2019 & 2032
- Table 62: Global Cancer Software Market Revenue Million Forecast, by Country 2019 & 2032
- Table 63: GCC Cancer Software Market Revenue (Million) Forecast, by Application 2019 & 2032
- Table 64: South Africa Cancer Software Market Revenue (Million) Forecast, by Application 2019 & 2032
- Table 65: Rest of Middle East and Africa Cancer Software Market Revenue (Million) Forecast, by Application 2019 & 2032
- Table 66: Global Cancer Software Market Revenue Million Forecast, by Deployment Model 2019 & 2032
- Table 67: Global Cancer Software Market Revenue Million Forecast, by Database Type 2019 & 2032
- Table 68: Global Cancer Software Market Revenue Million Forecast, by End Use 2019 & 2032
- Table 69: Global Cancer Software Market Revenue Million Forecast, by Country 2019 & 2032
- Table 70: Brazil Cancer Software Market Revenue (Million) Forecast, by Application 2019 & 2032
- Table 71: Argentina Cancer Software Market Revenue (Million) Forecast, by Application 2019 & 2032
- Table 72: Rest of South America Cancer Software Market Revenue (Million) Forecast, by Application 2019 & 2032
Frequently Asked Questions
1. What is the projected Compound Annual Growth Rate (CAGR) of the Cancer Software Market?
The projected CAGR is approximately 10.30%.
2. Which companies are prominent players in the Cancer Software Market?
Key companies in the market include Electronic Registry System Inc, himagine solutions, Ordinal Data Inc, IBM Corporation, C/NET Solutions, Rocky Mountain Cancer Data Systems, Conduent Inc, NeuralFrame Inc, Onco Inc, Elekta, McKesson Corporation, Siemens Healthineers*List Not Exhaustive.
3. What are the main segments of the Cancer Software Market?
The market segments include Deployment Model, Database Type, End Use.
4. Can you provide details about the market size?
The market size is estimated to be USD XX Million as of 2022.
5. What are some drivers contributing to market growth?
Increasing Prevalence of Cancer; Improving Quality of Care and Reducing Healthcare Costs.
6. What are the notable trends driving market growth?
Hospital & Medical Practice are Expected to Hold a Significant Market Share Over the Forecast Period.
7. Are there any restraints impacting market growth?
Privacy and Security Concerns for Patient Data.
8. Can you provide examples of recent developments in the market?
In May 2022, Kaiku Health and Roche entered into a strategic partnership in digital patient monitoring and management (DPMM). Kaiku Health and Roche aim to deploy digital tools to provide real-time symptom management by patients and Health Care Providers (HCPs), improve patient support, and provide personalized cancer care to cancer clinics and patients globally.
9. What pricing options are available for accessing the report?
Pricing options include single-user, multi-user, and enterprise licenses priced at USD 4750, USD 5250, and USD 8750 respectively.
10. Is the market size provided in terms of value or volume?
The market size is provided in terms of value, measured in Million.
11. Are there any specific market keywords associated with the report?
Yes, the market keyword associated with the report is "Cancer Software Market," which aids in identifying and referencing the specific market segment covered.
12. How do I determine which pricing option suits my needs best?
The pricing options vary based on user requirements and access needs. Individual users may opt for single-user licenses, while businesses requiring broader access may choose multi-user or enterprise licenses for cost-effective access to the report.
13. Are there any additional resources or data provided in the Cancer Software Market report?
While the report offers comprehensive insights, it's advisable to review the specific contents or supplementary materials provided to ascertain if additional resources or data are available.
14. How can I stay updated on further developments or reports in the Cancer Software Market?
To stay informed about further developments, trends, and reports in the Cancer Software Market, consider subscribing to industry newsletters, following relevant companies and organizations, or regularly checking reputable industry news sources and publications.
Methodology
Step 1 - Identification of Relevant Samples Size from Population Database


Step 2 - Approaches for Defining Global Market Size (Value, Volume* & Price*)

Note*: In applicable scenarios
Step 3 - Data Sources
Primary Research
- Web Analytics
- Survey Reports
- Research Institute
- Latest Research Reports
- Opinion Leaders
Secondary Research
- Annual Reports
- White Paper
- Latest Press Release
- Industry Association
- Paid Database
- Investor Presentations

Step 4 - Data Triangulation
Involves using different sources of information in order to increase the validity of a study
These sources are likely to be stakeholders in a program - participants, other researchers, program staff, other community members, and so on.
Then we put all data in single framework & apply various statistical tools to find out the dynamic on the market.
During the analysis stage, feedback from the stakeholder groups would be compared to determine areas of agreement as well as areas of divergence


