

Key Insights
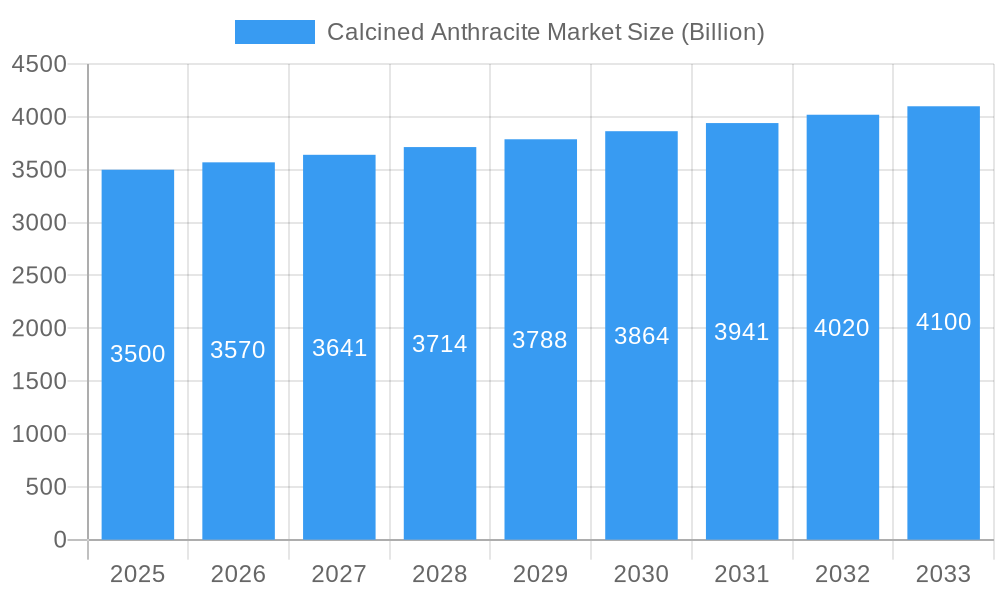
The global calcined anthracite market, valued at $3.5 billion in 2025, is projected to exhibit a Compound Annual Growth Rate (CAGR) of 1.9% from 2025 to 2033. This relatively moderate growth reflects a mature market with established applications, primarily driven by the steel industry's continued reliance on calcined anthracite for processes like pulverized coal injection (PCI) in blast furnaces and basic oxygen steelmaking (BOS). The increasing adoption of electric arc furnaces (EAFs), while presenting a potential market shift, is partially offset by the ongoing demand for calcined anthracite in other applications, such as electrodes and filter media. Growth will be influenced by factors such as fluctuations in steel production, the price volatility of alternative carbon sources, and stringent environmental regulations impacting industrial emissions. Regional variations are expected, with Asia-Pacific, particularly China, anticipated to retain a significant market share due to its substantial steel production capacity. North America and Europe will demonstrate steady growth, driven by ongoing industrial activity and infrastructural projects. However, potential restraints include the exploration and adoption of alternative, more sustainable carbon sources and technological advancements potentially reducing the need for calcined anthracite in some steelmaking processes.
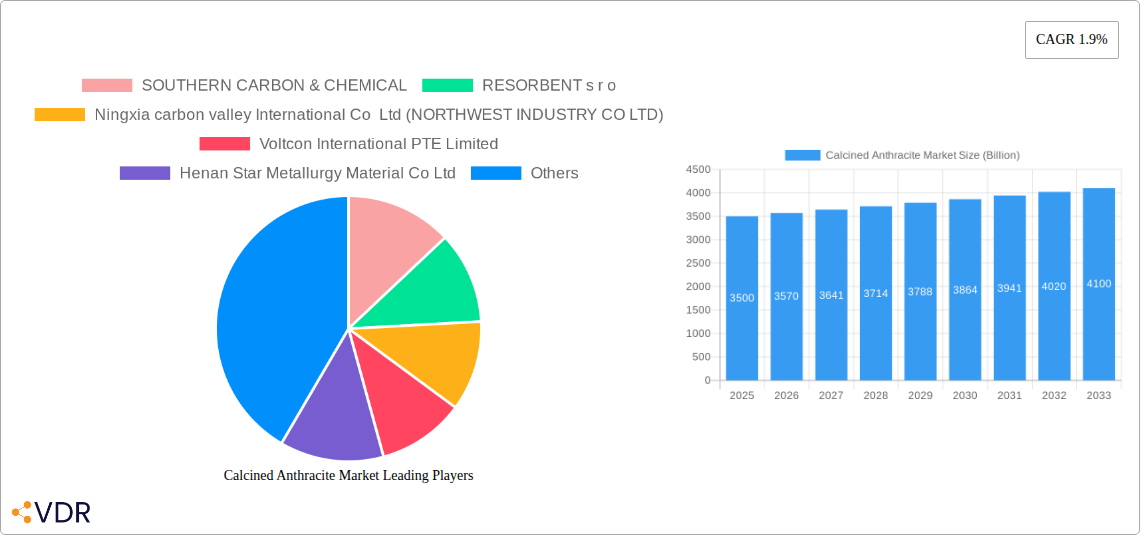
Calcined Anthracite Market Market Size (In Billion)
The segmentation of the market reveals a key dynamic. While gas-based calcination remains prevalent, electrical calcination is likely gaining traction due to its potential for greater control and reduced emissions. The application segment highlights the market's dependence on the steel industry, with PCI and BOS remaining dominant. Diversification into other applications, such as electrodes and filter media, will be crucial for sustained market growth and reducing reliance on the cyclical nature of the steel industry. Major players in the market, including Southern Carbon & Chemical, Resorbent s r o, and Ningxia carbon valley International Co Ltd, are likely to focus on technological advancements, strategic partnerships, and geographic expansion to maintain competitiveness and capture market share in this evolving landscape. The forecast period of 2025-2033 necessitates close monitoring of global steel production trends, technological innovations in carbon-based materials, and environmental regulatory changes to accurately predict market performance.
Calcined Anthracite Market Company Market Share
Calcined Anthracite Market: A Comprehensive Report (2019-2033)
This comprehensive report provides an in-depth analysis of the global Calcined Anthracite market, encompassing market dynamics, growth trends, regional dominance, product landscape, and key players. With a study period spanning 2019-2033, a base year of 2025, and a forecast period of 2025-2033, this report is an invaluable resource for industry professionals, investors, and strategic decision-makers seeking to navigate this evolving market. The report analyzes the parent market of Anthracite Coal and the child market of Calcined Anthracite for a complete understanding of market dynamics. The global Calcined Anthracite market is projected to reach XX Billion by 2033.
Calcined Anthracite Market Market Dynamics & Structure
The Calcined Anthracite market is characterized by a moderately consolidated structure, with key players holding significant market share. Technological innovation, primarily in calcination methods (gas vs. electrical), plays a crucial role in shaping market dynamics. Stringent environmental regulations are influencing production methods and driving the adoption of cleaner technologies. Competition from alternative materials, such as graphite, is also a significant factor. The market is primarily driven by the steel industry, with Pulverized Coal Injection (PCI), Basic Oxygen Steel Making (BOS), and Electric Arc Furnace applications dominating demand. Mergers and acquisitions (M&A) activity has been relatively low in recent years (XX deals in the past 5 years), but strategic partnerships are becoming more prevalent.
- Market Concentration: Moderately consolidated; top 5 players hold approximately XX% market share.
- Technological Innovation: Focus on improving energy efficiency and reducing emissions in calcination processes.
- Regulatory Framework: Stringent environmental regulations driving the adoption of cleaner technologies.
- Competitive Substitutes: Graphite and other carbon-based materials pose a competitive threat.
- End-User Demographics: Steel industry (PCI, BOS, EAF) dominates demand.
- M&A Trends: Limited M&A activity, but strategic partnerships are increasing.
Calcined Anthracite Market Growth Trends & Insights
The Calcined Anthracite market is poised for robust expansion, building upon a period of sustained growth in the historical timeframe (2019-2024), marked by a Compound Annual Growth Rate (CAGR) of approximately XX%. This upward trajectory is fundamentally driven by the escalating global demand for steel, particularly in burgeoning economies where industrialization is at its peak. Calcined anthracite's superior performance characteristics over conventional alternatives have led to its increasing integration across diverse steelmaking processes. Furthermore, the market is being propelled by significant technological advancements, including the development and implementation of more energy-efficient and environmentally sound calcination technologies. Evolving consumer preferences for premium steel products and the imperative to adhere to increasingly stringent environmental regulations are also acting as significant catalysts. Projections indicate that this healthy growth momentum will persist throughout the forecast period (2025-2033), with an anticipated CAGR of XX%. Consequently, the market is expected to reach a substantial valuation of XX Billion by 2033. A key avenue for future growth lies in increasing market penetration within emerging regions, which currently represent largely untapped potential.
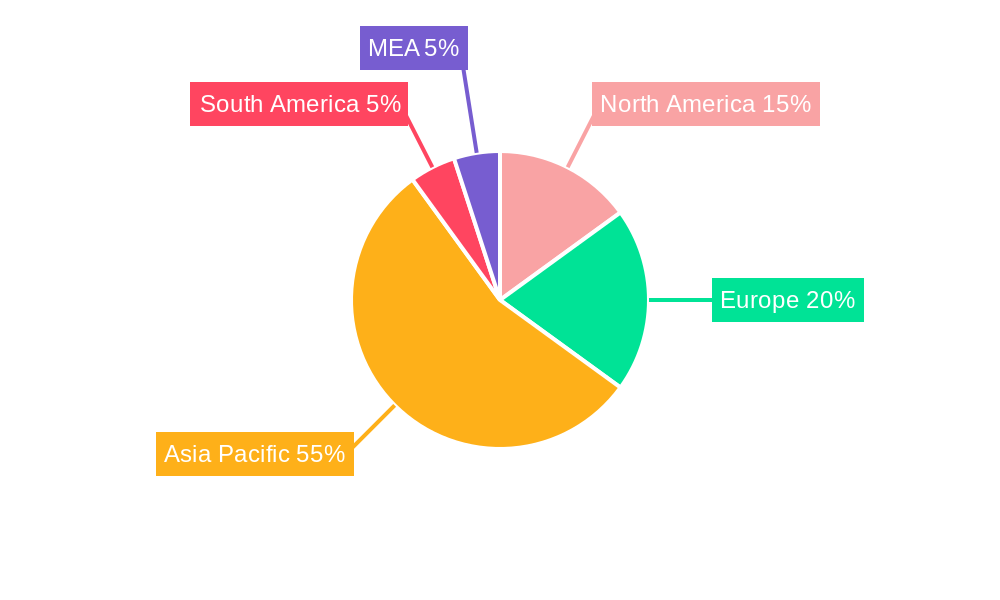
Dominant Regions, Countries, or Segments in Calcined Anthracite Market
The Asia-Pacific region currently dominates the Calcined Anthracite market, driven by robust steel production in countries like China, India, and South Korea. The high demand for steel in infrastructure development and industrialization fuels the consumption of calcined anthracite. Within calcination types, Gas calcination holds a larger market share due to its lower cost and established infrastructure, although Electrical calcination is gaining traction due to its environmental benefits. In terms of application, Pulverized Coal Injection (PCI) for blast furnaces accounts for the largest segment, followed by Basic Oxygen Steel Making (BOS).
- Key Drivers in Asia-Pacific: Rapid industrialization, growing infrastructure development, and rising steel production.
- Dominance Factors: High steel production capacity, cost-competitive production, and established supply chains.
- Growth Potential: Untapped markets in Southeast Asia and other emerging economies.
Calcined Anthracite Market Product Landscape
The calcined anthracite market is characterized by a diverse product landscape, primarily segmented by critical attributes such as particle size distribution, purity levels, and ash content. Ongoing innovation is sharply focused on refining these parameters to optimize performance and cater to the nuanced requirements of various applications. Transformative advancements in calcination methodologies are yielding calcined anthracite products of unparalleled quality and consistency, exhibiting enhanced reactivity and significantly reduced levels of impurities. The inherent value proposition of calcined anthracite is anchored in its exceptionally high carbon content, minimal ash presence, and superior reactivity, solidifying its position as an indispensable material in advanced steelmaking operations.
Key Drivers, Barriers & Challenges in Calcined Anthracite Market
Key Drivers: Increasing steel production globally, particularly in emerging economies; stringent environmental regulations promoting cleaner production methods; technological advancements in calcination processes; increasing demand for high-quality steel.
Key Challenges: Fluctuations in raw material prices (anthracite coal); competition from alternative materials; environmental regulations impacting production costs; supply chain disruptions due to geopolitical factors; potential for price volatility due to market concentration.
Emerging Opportunities in Calcined Anthracite Market
Significant untapped potential exists within the calcined anthracite market. Key emerging opportunities include: the strategic expansion into previously underserved and developing economies; the pioneering development of novel applications extending beyond traditional steelmaking, such as in high-performance filter media, advanced electrode manufacturing, and specialized carbon additives; and a concentrated focus on adopting and promoting sustainable, eco-friendly production methodologies. Continued investment in research and development aimed at elevating the quality and performance spectrum of calcined anthracite is anticipated to unlock entirely new market segments and innovative applications, driving future market evolution.
Growth Accelerators in the Calcined Anthracite Market Industry
The long-term growth trajectory of the calcined anthracite market is set to be powerfully accelerated by several key factors. Technological breakthroughs in calcination processes are expected to yield significant improvements in energy efficiency and a demonstrable reduction in environmental emissions. Cultivating strategic alliances and collaborations between calcined anthracite manufacturers and leading steel producers will be instrumental in facilitating broader market penetration and access. Furthermore, supportive government policies that champion sustainable industrial practices, coupled with substantial investments in critical infrastructure development, will play a pivotal role in fostering a conducive environment for sustained market expansion.
Key Players Shaping the Calcined Anthracite Market Market
- SOUTHERN CARBON & CHEMICAL
- RESORBENT s r o
- Ningxia carbon valley International Co Ltd (NORTHWEST INDUSTRY CO LTD)
- Voltcon International PTE Limited
- Henan Star Metallurgy Material Co Ltd
- Black Diamond
- JH CARBON
- Kingstone Group
- Aluminium Rheinfelden GmbH
Notable Milestones in Calcined Anthracite Market Sector
- 2021: [Company Name] revolutionizes the industry with the introduction of a groundbreaking, highly efficient gas calcination technology, enhancing production capabilities and sustainability.
- 2022: A significant strategic alliance was forged between [Company Name] and [Company Name], aimed at establishing a robust presence and expanding market reach within the dynamic Southeast Asian region.
- 2023: The implementation of stringent new environmental regulations in [Region] has spurred a notable increase in the adoption of advanced and cleaner calcination technologies across the sector.
In-Depth Calcined Anthracite Market Market Outlook
The Calcined Anthracite market is poised for continued growth, driven by factors such as increasing steel production, technological advancements, and government support for sustainable industrial practices. Strategic partnerships and investments in research and development will be key to unlocking future market potential. Expanding into new applications and untapped markets will create further growth opportunities. The market presents attractive opportunities for companies that can offer high-quality products, efficient production processes, and a commitment to sustainability.
Calcined Anthracite Market Segmentation
-
1. Calcination Type
- 1.1. Gas
- 1.2. Electrical
-
2. Application
- 2.1. Pulverized Coal Injection (Blast furnace)
- 2.2. Basic Oxygen Steel Making (BOS)
- 2.3. Electric Arc Furnace
- 2.4. Others (Electrodes, Filter Medium, etc.,)
Calcined Anthracite Market Segmentation By Geography
-
1. Asia Pacific
- 1.1. China
- 1.2. India
- 1.3. Japan
- 1.4. South Korea
- 1.5. Rest of Asia Pacific
-
2. North America
- 2.1. United States
- 2.2. Canada
- 2.3. Mexico
-
3. Europe
- 3.1. Germany
- 3.2. United Kingdom
- 3.3. Italy
- 3.4. France
- 3.5. Rest of Europe
-
4. South America
- 4.1. Brazil
- 4.2. Argentina
- 4.3. Rest of South America
-
5. Middle East and Africa
- 5.1. Saudi Arabia
- 5.2. South Africa
- 5.3. Rest of Middle East and Africa
Calcined Anthracite Market Regional Market Share
Geographic Coverage of Calcined Anthracite Market
Calcined Anthracite Market REPORT HIGHLIGHTS
| Aspects | Details |
|---|---|
| Study Period | 2020-2034 |
| Base Year | 2025 |
| Estimated Year | 2026 |
| Forecast Period | 2026-2034 |
| Historical Period | 2020-2025 |
| Growth Rate | CAGR of 1.9% from 2020-2034 |
| Segmentation |
|
Table of Contents
- 1. Introduction
- 1.1. Research Scope
- 1.2. Market Segmentation
- 1.3. Research Objective
- 1.4. Definitions and Assumptions
- 2. Executive Summary
- 2.1. Market Snapshot
- 3. Market Dynamics
- 3.1. Market Drivers
- 3.2. Market Restrains
- 3.3. Market Trends
- 3.4. Market Opportunities
- 4. Market Factor Analysis
- 4.1. Porters Five Forces
- 4.1.1. Bargaining Power of Suppliers
- 4.1.2. Bargaining Power of Buyers
- 4.1.3. Threat of New Entrants
- 4.1.4. Threat of Substitutes
- 4.1.5. Competitive Rivalry
- 4.2. PESTEL analysis
- 4.3. BCG Analysis
- 4.3.1. Stars (High Growth, High Market Share)
- 4.3.2. Cash Cows (Low Growth, High Market Share)
- 4.3.3. Question Mark (High Growth, Low Market Share)
- 4.3.4. Dogs (Low Growth, Low Market Share)
- 4.4. Ansoff Matrix Analysis
- 4.5. Supply Chain Analysis
- 4.6. Regulatory Landscape
- 4.7. Current Market Potential and Opportunity Assessment (TAM–SAM–SOM Framework)
- 4.8. VDR Analyst Note
- 4.1. Porters Five Forces
- 5. Market Analysis, Insights and Forecast 2021-2033
- 5.1. Market Analysis, Insights and Forecast - by Calcination Type
- 5.1.1. Gas
- 5.1.2. Electrical
- 5.2. Market Analysis, Insights and Forecast - by Application
- 5.2.1. Pulverized Coal Injection (Blast furnace)
- 5.2.2. Basic Oxygen Steel Making (BOS)
- 5.2.3. Electric Arc Furnace
- 5.2.4. Others (Electrodes, Filter Medium, etc.,)
- 5.3. Market Analysis, Insights and Forecast - by Region
- 5.3.1. Asia Pacific
- 5.3.2. North America
- 5.3.3. Europe
- 5.3.4. South America
- 5.3.5. Middle East and Africa
- 5.1. Market Analysis, Insights and Forecast - by Calcination Type
- 6. Global Calcined Anthracite Market Analysis, Insights and Forecast, 2021-2033
- 6.1. Market Analysis, Insights and Forecast - by Calcination Type
- 6.1.1. Gas
- 6.1.2. Electrical
- 6.2. Market Analysis, Insights and Forecast - by Application
- 6.2.1. Pulverized Coal Injection (Blast furnace)
- 6.2.2. Basic Oxygen Steel Making (BOS)
- 6.2.3. Electric Arc Furnace
- 6.2.4. Others (Electrodes, Filter Medium, etc.,)
- 6.1. Market Analysis, Insights and Forecast - by Calcination Type
- 7. Asia Pacific Calcined Anthracite Market Analysis, Insights and Forecast, 2021-2033
- 7.1. Market Analysis, Insights and Forecast - by Calcination Type
- 7.1.1. Gas
- 7.1.2. Electrical
- 7.2. Market Analysis, Insights and Forecast - by Application
- 7.2.1. Pulverized Coal Injection (Blast furnace)
- 7.2.2. Basic Oxygen Steel Making (BOS)
- 7.2.3. Electric Arc Furnace
- 7.2.4. Others (Electrodes, Filter Medium, etc.,)
- 7.1. Market Analysis, Insights and Forecast - by Calcination Type
- 8. North America Calcined Anthracite Market Analysis, Insights and Forecast, 2021-2033
- 8.1. Market Analysis, Insights and Forecast - by Calcination Type
- 8.1.1. Gas
- 8.1.2. Electrical
- 8.2. Market Analysis, Insights and Forecast - by Application
- 8.2.1. Pulverized Coal Injection (Blast furnace)
- 8.2.2. Basic Oxygen Steel Making (BOS)
- 8.2.3. Electric Arc Furnace
- 8.2.4. Others (Electrodes, Filter Medium, etc.,)
- 8.1. Market Analysis, Insights and Forecast - by Calcination Type
- 9. Europe Calcined Anthracite Market Analysis, Insights and Forecast, 2021-2033
- 9.1. Market Analysis, Insights and Forecast - by Calcination Type
- 9.1.1. Gas
- 9.1.2. Electrical
- 9.2. Market Analysis, Insights and Forecast - by Application
- 9.2.1. Pulverized Coal Injection (Blast furnace)
- 9.2.2. Basic Oxygen Steel Making (BOS)
- 9.2.3. Electric Arc Furnace
- 9.2.4. Others (Electrodes, Filter Medium, etc.,)
- 9.1. Market Analysis, Insights and Forecast - by Calcination Type
- 10. South America Calcined Anthracite Market Analysis, Insights and Forecast, 2021-2033
- 10.1. Market Analysis, Insights and Forecast - by Calcination Type
- 10.1.1. Gas
- 10.1.2. Electrical
- 10.2. Market Analysis, Insights and Forecast - by Application
- 10.2.1. Pulverized Coal Injection (Blast furnace)
- 10.2.2. Basic Oxygen Steel Making (BOS)
- 10.2.3. Electric Arc Furnace
- 10.2.4. Others (Electrodes, Filter Medium, etc.,)
- 10.1. Market Analysis, Insights and Forecast - by Calcination Type
- 11. Middle East and Africa Calcined Anthracite Market Analysis, Insights and Forecast, 2021-2033
- 11.1. Market Analysis, Insights and Forecast - by Calcination Type
- 11.1.1. Gas
- 11.1.2. Electrical
- 11.2. Market Analysis, Insights and Forecast - by Application
- 11.2.1. Pulverized Coal Injection (Blast furnace)
- 11.2.2. Basic Oxygen Steel Making (BOS)
- 11.2.3. Electric Arc Furnace
- 11.2.4. Others (Electrodes, Filter Medium, etc.,)
- 11.1. Market Analysis, Insights and Forecast - by Calcination Type
- 12. Competitive Analysis
- 12.1. Company Profiles
- 12.1.1 SOUTHERN CARBON & CHEMICAL
- 12.1.1.1. Company Overview
- 12.1.1.2. Products
- 12.1.1.3. Company Financials
- 12.1.1.4. SWOT Analysis
- 12.1.2 RESORBENT s r o
- 12.1.2.1. Company Overview
- 12.1.2.2. Products
- 12.1.2.3. Company Financials
- 12.1.2.4. SWOT Analysis
- 12.1.3 Ningxia carbon valley International Co Ltd (NORTHWEST INDUSTRY CO LTD)
- 12.1.3.1. Company Overview
- 12.1.3.2. Products
- 12.1.3.3. Company Financials
- 12.1.3.4. SWOT Analysis
- 12.1.4 Voltcon International PTE Limited
- 12.1.4.1. Company Overview
- 12.1.4.2. Products
- 12.1.4.3. Company Financials
- 12.1.4.4. SWOT Analysis
- 12.1.5 Henan Star Metallurgy Material Co Ltd
- 12.1.5.1. Company Overview
- 12.1.5.2. Products
- 12.1.5.3. Company Financials
- 12.1.5.4. SWOT Analysis
- 12.1.6 Black Diamond
- 12.1.6.1. Company Overview
- 12.1.6.2. Products
- 12.1.6.3. Company Financials
- 12.1.6.4. SWOT Analysis
- 12.1.7 JH CARBON
- 12.1.7.1. Company Overview
- 12.1.7.2. Products
- 12.1.7.3. Company Financials
- 12.1.7.4. SWOT Analysis
- 12.1.8 Kingstone Group
- 12.1.8.1. Company Overview
- 12.1.8.2. Products
- 12.1.8.3. Company Financials
- 12.1.8.4. SWOT Analysis
- 12.1.9 Aluminium Rheinfelden GmbH
- 12.1.9.1. Company Overview
- 12.1.9.2. Products
- 12.1.9.3. Company Financials
- 12.1.9.4. SWOT Analysis
- 12.1.1 SOUTHERN CARBON & CHEMICAL
- 12.2. Market Entropy
- 12.2.1 Company's Key Areas Served
- 12.2.2 Recent Developments
- 12.3. Company Market Share Analysis 2025
- 12.3.1 Top 5 Companies Market Share Analysis
- 12.3.2 Top 3 Companies Market Share Analysis
- 12.4. List of Potential Customers
- 13. Research Methodology
List of Figures
- Figure 1: Global Calcined Anthracite Market Revenue Breakdown (Billion, %) by Region 2025 & 2033
- Figure 2: Global Calcined Anthracite Market Volume Breakdown (K Tons, %) by Region 2025 & 2033
- Figure 3: Asia Pacific Calcined Anthracite Market Revenue (Billion), by Calcination Type 2025 & 2033
- Figure 4: Asia Pacific Calcined Anthracite Market Volume (K Tons), by Calcination Type 2025 & 2033
- Figure 5: Asia Pacific Calcined Anthracite Market Revenue Share (%), by Calcination Type 2025 & 2033
- Figure 6: Asia Pacific Calcined Anthracite Market Volume Share (%), by Calcination Type 2025 & 2033
- Figure 7: Asia Pacific Calcined Anthracite Market Revenue (Billion), by Application 2025 & 2033
- Figure 8: Asia Pacific Calcined Anthracite Market Volume (K Tons), by Application 2025 & 2033
- Figure 9: Asia Pacific Calcined Anthracite Market Revenue Share (%), by Application 2025 & 2033
- Figure 10: Asia Pacific Calcined Anthracite Market Volume Share (%), by Application 2025 & 2033
- Figure 11: Asia Pacific Calcined Anthracite Market Revenue (Billion), by Country 2025 & 2033
- Figure 12: Asia Pacific Calcined Anthracite Market Volume (K Tons), by Country 2025 & 2033
- Figure 13: Asia Pacific Calcined Anthracite Market Revenue Share (%), by Country 2025 & 2033
- Figure 14: Asia Pacific Calcined Anthracite Market Volume Share (%), by Country 2025 & 2033
- Figure 15: North America Calcined Anthracite Market Revenue (Billion), by Calcination Type 2025 & 2033
- Figure 16: North America Calcined Anthracite Market Volume (K Tons), by Calcination Type 2025 & 2033
- Figure 17: North America Calcined Anthracite Market Revenue Share (%), by Calcination Type 2025 & 2033
- Figure 18: North America Calcined Anthracite Market Volume Share (%), by Calcination Type 2025 & 2033
- Figure 19: North America Calcined Anthracite Market Revenue (Billion), by Application 2025 & 2033
- Figure 20: North America Calcined Anthracite Market Volume (K Tons), by Application 2025 & 2033
- Figure 21: North America Calcined Anthracite Market Revenue Share (%), by Application 2025 & 2033
- Figure 22: North America Calcined Anthracite Market Volume Share (%), by Application 2025 & 2033
- Figure 23: North America Calcined Anthracite Market Revenue (Billion), by Country 2025 & 2033
- Figure 24: North America Calcined Anthracite Market Volume (K Tons), by Country 2025 & 2033
- Figure 25: North America Calcined Anthracite Market Revenue Share (%), by Country 2025 & 2033
- Figure 26: North America Calcined Anthracite Market Volume Share (%), by Country 2025 & 2033
- Figure 27: Europe Calcined Anthracite Market Revenue (Billion), by Calcination Type 2025 & 2033
- Figure 28: Europe Calcined Anthracite Market Volume (K Tons), by Calcination Type 2025 & 2033
- Figure 29: Europe Calcined Anthracite Market Revenue Share (%), by Calcination Type 2025 & 2033
- Figure 30: Europe Calcined Anthracite Market Volume Share (%), by Calcination Type 2025 & 2033
- Figure 31: Europe Calcined Anthracite Market Revenue (Billion), by Application 2025 & 2033
- Figure 32: Europe Calcined Anthracite Market Volume (K Tons), by Application 2025 & 2033
- Figure 33: Europe Calcined Anthracite Market Revenue Share (%), by Application 2025 & 2033
- Figure 34: Europe Calcined Anthracite Market Volume Share (%), by Application 2025 & 2033
- Figure 35: Europe Calcined Anthracite Market Revenue (Billion), by Country 2025 & 2033
- Figure 36: Europe Calcined Anthracite Market Volume (K Tons), by Country 2025 & 2033
- Figure 37: Europe Calcined Anthracite Market Revenue Share (%), by Country 2025 & 2033
- Figure 38: Europe Calcined Anthracite Market Volume Share (%), by Country 2025 & 2033
- Figure 39: South America Calcined Anthracite Market Revenue (Billion), by Calcination Type 2025 & 2033
- Figure 40: South America Calcined Anthracite Market Volume (K Tons), by Calcination Type 2025 & 2033
- Figure 41: South America Calcined Anthracite Market Revenue Share (%), by Calcination Type 2025 & 2033
- Figure 42: South America Calcined Anthracite Market Volume Share (%), by Calcination Type 2025 & 2033
- Figure 43: South America Calcined Anthracite Market Revenue (Billion), by Application 2025 & 2033
- Figure 44: South America Calcined Anthracite Market Volume (K Tons), by Application 2025 & 2033
- Figure 45: South America Calcined Anthracite Market Revenue Share (%), by Application 2025 & 2033
- Figure 46: South America Calcined Anthracite Market Volume Share (%), by Application 2025 & 2033
- Figure 47: South America Calcined Anthracite Market Revenue (Billion), by Country 2025 & 2033
- Figure 48: South America Calcined Anthracite Market Volume (K Tons), by Country 2025 & 2033
- Figure 49: South America Calcined Anthracite Market Revenue Share (%), by Country 2025 & 2033
- Figure 50: South America Calcined Anthracite Market Volume Share (%), by Country 2025 & 2033
- Figure 51: Middle East and Africa Calcined Anthracite Market Revenue (Billion), by Calcination Type 2025 & 2033
- Figure 52: Middle East and Africa Calcined Anthracite Market Volume (K Tons), by Calcination Type 2025 & 2033
- Figure 53: Middle East and Africa Calcined Anthracite Market Revenue Share (%), by Calcination Type 2025 & 2033
- Figure 54: Middle East and Africa Calcined Anthracite Market Volume Share (%), by Calcination Type 2025 & 2033
- Figure 55: Middle East and Africa Calcined Anthracite Market Revenue (Billion), by Application 2025 & 2033
- Figure 56: Middle East and Africa Calcined Anthracite Market Volume (K Tons), by Application 2025 & 2033
- Figure 57: Middle East and Africa Calcined Anthracite Market Revenue Share (%), by Application 2025 & 2033
- Figure 58: Middle East and Africa Calcined Anthracite Market Volume Share (%), by Application 2025 & 2033
- Figure 59: Middle East and Africa Calcined Anthracite Market Revenue (Billion), by Country 2025 & 2033
- Figure 60: Middle East and Africa Calcined Anthracite Market Volume (K Tons), by Country 2025 & 2033
- Figure 61: Middle East and Africa Calcined Anthracite Market Revenue Share (%), by Country 2025 & 2033
- Figure 62: Middle East and Africa Calcined Anthracite Market Volume Share (%), by Country 2025 & 2033
List of Tables
- Table 1: Global Calcined Anthracite Market Revenue Billion Forecast, by Calcination Type 2020 & 2033
- Table 2: Global Calcined Anthracite Market Volume K Tons Forecast, by Calcination Type 2020 & 2033
- Table 3: Global Calcined Anthracite Market Revenue Billion Forecast, by Application 2020 & 2033
- Table 4: Global Calcined Anthracite Market Volume K Tons Forecast, by Application 2020 & 2033
- Table 5: Global Calcined Anthracite Market Revenue Billion Forecast, by Region 2020 & 2033
- Table 6: Global Calcined Anthracite Market Volume K Tons Forecast, by Region 2020 & 2033
- Table 7: Global Calcined Anthracite Market Revenue Billion Forecast, by Calcination Type 2020 & 2033
- Table 8: Global Calcined Anthracite Market Volume K Tons Forecast, by Calcination Type 2020 & 2033
- Table 9: Global Calcined Anthracite Market Revenue Billion Forecast, by Application 2020 & 2033
- Table 10: Global Calcined Anthracite Market Volume K Tons Forecast, by Application 2020 & 2033
- Table 11: Global Calcined Anthracite Market Revenue Billion Forecast, by Country 2020 & 2033
- Table 12: Global Calcined Anthracite Market Volume K Tons Forecast, by Country 2020 & 2033
- Table 13: China Calcined Anthracite Market Revenue (Billion) Forecast, by Application 2020 & 2033
- Table 14: China Calcined Anthracite Market Volume (K Tons) Forecast, by Application 2020 & 2033
- Table 15: India Calcined Anthracite Market Revenue (Billion) Forecast, by Application 2020 & 2033
- Table 16: India Calcined Anthracite Market Volume (K Tons) Forecast, by Application 2020 & 2033
- Table 17: Japan Calcined Anthracite Market Revenue (Billion) Forecast, by Application 2020 & 2033
- Table 18: Japan Calcined Anthracite Market Volume (K Tons) Forecast, by Application 2020 & 2033
- Table 19: South Korea Calcined Anthracite Market Revenue (Billion) Forecast, by Application 2020 & 2033
- Table 20: South Korea Calcined Anthracite Market Volume (K Tons) Forecast, by Application 2020 & 2033
- Table 21: Rest of Asia Pacific Calcined Anthracite Market Revenue (Billion) Forecast, by Application 2020 & 2033
- Table 22: Rest of Asia Pacific Calcined Anthracite Market Volume (K Tons) Forecast, by Application 2020 & 2033
- Table 23: Global Calcined Anthracite Market Revenue Billion Forecast, by Calcination Type 2020 & 2033
- Table 24: Global Calcined Anthracite Market Volume K Tons Forecast, by Calcination Type 2020 & 2033
- Table 25: Global Calcined Anthracite Market Revenue Billion Forecast, by Application 2020 & 2033
- Table 26: Global Calcined Anthracite Market Volume K Tons Forecast, by Application 2020 & 2033
- Table 27: Global Calcined Anthracite Market Revenue Billion Forecast, by Country 2020 & 2033
- Table 28: Global Calcined Anthracite Market Volume K Tons Forecast, by Country 2020 & 2033
- Table 29: United States Calcined Anthracite Market Revenue (Billion) Forecast, by Application 2020 & 2033
- Table 30: United States Calcined Anthracite Market Volume (K Tons) Forecast, by Application 2020 & 2033
- Table 31: Canada Calcined Anthracite Market Revenue (Billion) Forecast, by Application 2020 & 2033
- Table 32: Canada Calcined Anthracite Market Volume (K Tons) Forecast, by Application 2020 & 2033
- Table 33: Mexico Calcined Anthracite Market Revenue (Billion) Forecast, by Application 2020 & 2033
- Table 34: Mexico Calcined Anthracite Market Volume (K Tons) Forecast, by Application 2020 & 2033
- Table 35: Global Calcined Anthracite Market Revenue Billion Forecast, by Calcination Type 2020 & 2033
- Table 36: Global Calcined Anthracite Market Volume K Tons Forecast, by Calcination Type 2020 & 2033
- Table 37: Global Calcined Anthracite Market Revenue Billion Forecast, by Application 2020 & 2033
- Table 38: Global Calcined Anthracite Market Volume K Tons Forecast, by Application 2020 & 2033
- Table 39: Global Calcined Anthracite Market Revenue Billion Forecast, by Country 2020 & 2033
- Table 40: Global Calcined Anthracite Market Volume K Tons Forecast, by Country 2020 & 2033
- Table 41: Germany Calcined Anthracite Market Revenue (Billion) Forecast, by Application 2020 & 2033
- Table 42: Germany Calcined Anthracite Market Volume (K Tons) Forecast, by Application 2020 & 2033
- Table 43: United Kingdom Calcined Anthracite Market Revenue (Billion) Forecast, by Application 2020 & 2033
- Table 44: United Kingdom Calcined Anthracite Market Volume (K Tons) Forecast, by Application 2020 & 2033
- Table 45: Italy Calcined Anthracite Market Revenue (Billion) Forecast, by Application 2020 & 2033
- Table 46: Italy Calcined Anthracite Market Volume (K Tons) Forecast, by Application 2020 & 2033
- Table 47: France Calcined Anthracite Market Revenue (Billion) Forecast, by Application 2020 & 2033
- Table 48: France Calcined Anthracite Market Volume (K Tons) Forecast, by Application 2020 & 2033
- Table 49: Rest of Europe Calcined Anthracite Market Revenue (Billion) Forecast, by Application 2020 & 2033
- Table 50: Rest of Europe Calcined Anthracite Market Volume (K Tons) Forecast, by Application 2020 & 2033
- Table 51: Global Calcined Anthracite Market Revenue Billion Forecast, by Calcination Type 2020 & 2033
- Table 52: Global Calcined Anthracite Market Volume K Tons Forecast, by Calcination Type 2020 & 2033
- Table 53: Global Calcined Anthracite Market Revenue Billion Forecast, by Application 2020 & 2033
- Table 54: Global Calcined Anthracite Market Volume K Tons Forecast, by Application 2020 & 2033
- Table 55: Global Calcined Anthracite Market Revenue Billion Forecast, by Country 2020 & 2033
- Table 56: Global Calcined Anthracite Market Volume K Tons Forecast, by Country 2020 & 2033
- Table 57: Brazil Calcined Anthracite Market Revenue (Billion) Forecast, by Application 2020 & 2033
- Table 58: Brazil Calcined Anthracite Market Volume (K Tons) Forecast, by Application 2020 & 2033
- Table 59: Argentina Calcined Anthracite Market Revenue (Billion) Forecast, by Application 2020 & 2033
- Table 60: Argentina Calcined Anthracite Market Volume (K Tons) Forecast, by Application 2020 & 2033
- Table 61: Rest of South America Calcined Anthracite Market Revenue (Billion) Forecast, by Application 2020 & 2033
- Table 62: Rest of South America Calcined Anthracite Market Volume (K Tons) Forecast, by Application 2020 & 2033
- Table 63: Global Calcined Anthracite Market Revenue Billion Forecast, by Calcination Type 2020 & 2033
- Table 64: Global Calcined Anthracite Market Volume K Tons Forecast, by Calcination Type 2020 & 2033
- Table 65: Global Calcined Anthracite Market Revenue Billion Forecast, by Application 2020 & 2033
- Table 66: Global Calcined Anthracite Market Volume K Tons Forecast, by Application 2020 & 2033
- Table 67: Global Calcined Anthracite Market Revenue Billion Forecast, by Country 2020 & 2033
- Table 68: Global Calcined Anthracite Market Volume K Tons Forecast, by Country 2020 & 2033
- Table 69: Saudi Arabia Calcined Anthracite Market Revenue (Billion) Forecast, by Application 2020 & 2033
- Table 70: Saudi Arabia Calcined Anthracite Market Volume (K Tons) Forecast, by Application 2020 & 2033
- Table 71: South Africa Calcined Anthracite Market Revenue (Billion) Forecast, by Application 2020 & 2033
- Table 72: South Africa Calcined Anthracite Market Volume (K Tons) Forecast, by Application 2020 & 2033
- Table 73: Rest of Middle East and Africa Calcined Anthracite Market Revenue (Billion) Forecast, by Application 2020 & 2033
- Table 74: Rest of Middle East and Africa Calcined Anthracite Market Volume (K Tons) Forecast, by Application 2020 & 2033
Frequently Asked Questions
1. What is the projected Compound Annual Growth Rate (CAGR) of the Calcined Anthracite Market?
The projected CAGR is approximately 1.9%.
2. Which companies are prominent players in the Calcined Anthracite Market?
Key companies in the market include SOUTHERN CARBON & CHEMICAL, RESORBENT s r o, Ningxia carbon valley International Co Ltd (NORTHWEST INDUSTRY CO LTD), Voltcon International PTE Limited, Henan Star Metallurgy Material Co Ltd, Black Diamond, JH CARBON, Kingstone Group, Aluminium Rheinfelden GmbH.
3. What are the main segments of the Calcined Anthracite Market?
The market segments include Calcination Type, Application.
4. Can you provide details about the market size?
The market size is estimated to be USD 3.50 Billion as of 2022.
5. What are some drivers contributing to market growth?
; Growing Demand form Steel Manufacturing Industries; Other Drivers.
6. What are the notable trends driving market growth?
Growing Demand from Steel Manufacturing Industries.
7. Are there any restraints impacting market growth?
; Depletion & Volatile Process of Raw Materials; Unfavorable Conditions Arising Due to the COVID-19 Outbreak.
8. Can you provide examples of recent developments in the market?
N/A
9. What pricing options are available for accessing the report?
Pricing options include single-user, multi-user, and enterprise licenses priced at USD 4750, USD 5250, and USD 8750 respectively.
10. Is the market size provided in terms of value or volume?
The market size is provided in terms of value, measured in Billion and volume, measured in K Tons.
11. Are there any specific market keywords associated with the report?
Yes, the market keyword associated with the report is "Calcined Anthracite Market," which aids in identifying and referencing the specific market segment covered.
12. How do I determine which pricing option suits my needs best?
The pricing options vary based on user requirements and access needs. Individual users may opt for single-user licenses, while businesses requiring broader access may choose multi-user or enterprise licenses for cost-effective access to the report.
13. Are there any additional resources or data provided in the Calcined Anthracite Market report?
While the report offers comprehensive insights, it's advisable to review the specific contents or supplementary materials provided to ascertain if additional resources or data are available.
14. How can I stay updated on further developments or reports in the Calcined Anthracite Market?
To stay informed about further developments, trends, and reports in the Calcined Anthracite Market, consider subscribing to industry newsletters, following relevant companies and organizations, or regularly checking reputable industry news sources and publications.
Methodology
Step 1 - Identification of Relevant Samples Size from Population Database


Step 2 - Approaches for Defining Global Market Size (Value, Volume* & Price*)

Note*: In applicable scenarios
Step 3 - Data Sources
Primary Research
- Web Analytics
- Survey Reports
- Research Institute
- Latest Research Reports
- Opinion Leaders
Secondary Research
- Annual Reports
- White Paper
- Latest Press Release
- Industry Association
- Paid Database
- Investor Presentations

Step 4 - Data Triangulation
Involves using different sources of information in order to increase the validity of a study
These sources are likely to be stakeholders in a program - participants, other researchers, program staff, other community members, and so on.
Then we put all data in single framework & apply various statistical tools to find out the dynamic on the market.
During the analysis stage, feedback from the stakeholder groups would be compared to determine areas of agreement as well as areas of divergence