
Key Insights
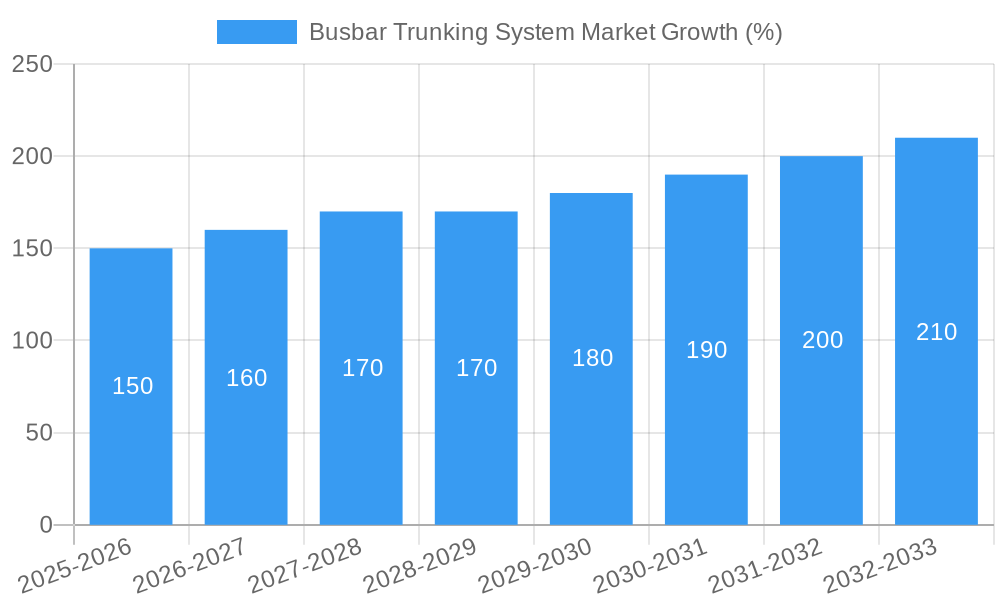
The global busbar trunking system market is experiencing robust growth, fueled by a compound annual growth rate (CAGR) exceeding 5% from 2019 to 2033. This expansion is driven by the increasing demand for efficient and reliable power distribution solutions across various sectors, including commercial, industrial, and transportation. The rising adoption of renewable energy sources and the electrification of transportation further contribute to this market's positive trajectory. Aluminum and copper remain the dominant materials in busbar trunking systems, owing to their superior conductivity and durability. However, the market is witnessing a growing preference for systems with higher power ratings, especially in industrial settings requiring large power capacities, leading to increased adoption of medium and high voltage systems. The trend towards modular and flexible designs caters to evolving infrastructural needs and ease of installation. While the initial investment cost for busbar trunking systems can be higher compared to traditional wiring methods, the long-term benefits of improved safety, reduced maintenance, and enhanced efficiency offset this cost. Geographic expansion is also a major factor; regions like Asia Pacific, driven by rapid industrialization and infrastructure development in countries like China and India, show significant market potential. Conversely, stringent regulatory compliance requirements and fluctuations in raw material prices present challenges to market growth.
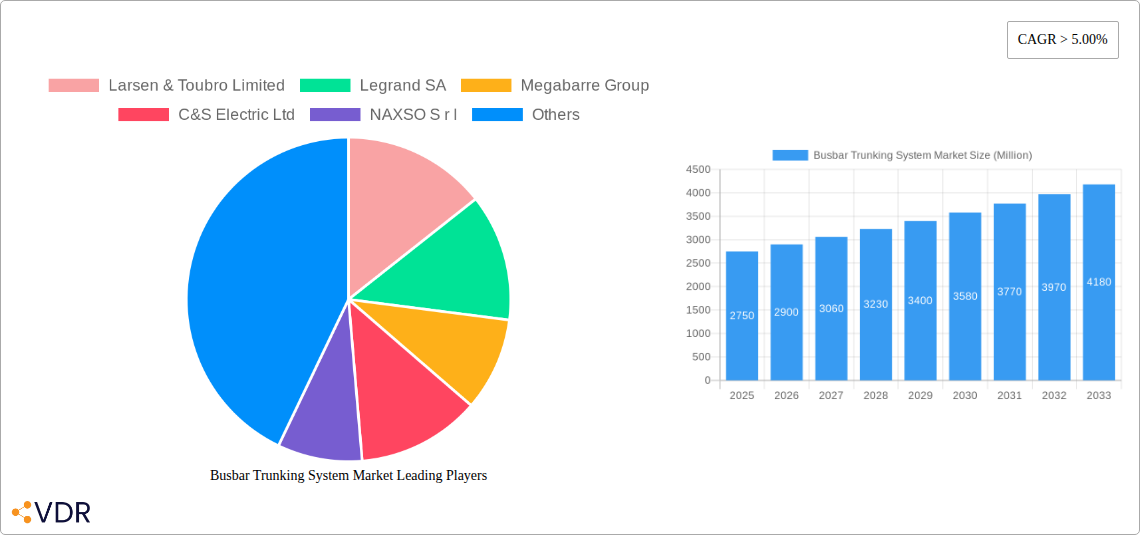
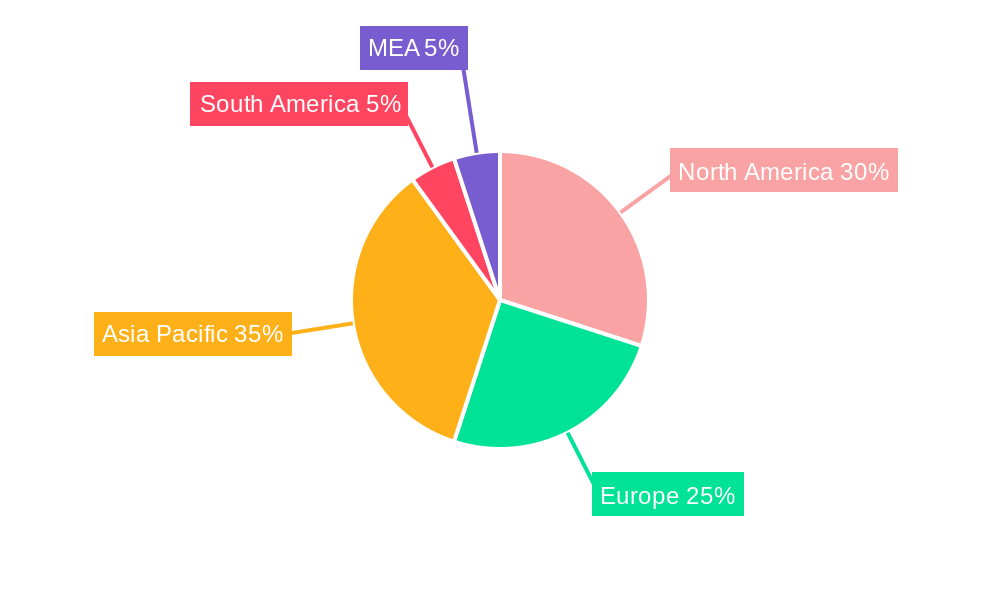
The market segmentation reveals a diversified landscape. The aluminum segment holds a larger market share than copper due to its cost-effectiveness, though copper maintains its presence due to superior conductivity in specific high-demand applications. Within power ratings, the low-voltage segment currently dominates, driven by widespread residential and commercial applications. However, significant growth is anticipated in the medium and high-voltage segments, particularly within industrial and transportation sectors. Regarding end-users, the industrial sector leads, showcasing a substantial need for reliable power delivery in manufacturing facilities and industrial complexes. Key players like Larsen & Toubro, Legrand, Siemens, and Schneider Electric are driving innovation and market competition through product development and strategic expansions. The North American and European markets currently hold significant shares, but emerging economies in Asia-Pacific and other regions present substantial growth opportunities over the forecast period. Considering the projected CAGR and market dynamics, a conservative estimate of the 2025 market size could range between $2.5 billion to $3.0 billion (assuming a starting market size of approximately $1.5 billion in 2019). This projection accounts for factors like fluctuating economic conditions and shifts in market preference.
Busbar Trunking System Market: A Comprehensive Report (2019-2033)
This comprehensive report provides a detailed analysis of the global Busbar Trunking System market, offering invaluable insights for industry professionals, investors, and strategic decision-makers. The study covers the period from 2019 to 2033, with 2025 serving as the base year. We delve into market dynamics, growth trends, regional performance, product landscapes, and competitive landscapes, offering a 360° view of this dynamic sector. The report quantifies market size in million units and predicts future growth trajectories, offering actionable intelligence for informed business strategies.
Busbar Trunking System Market Market Dynamics & Structure
The global busbar trunking system market is characterized by moderate concentration, with key players holding significant market share. Technological advancements, particularly in materials science and power electronics, are driving innovation. Stringent safety and environmental regulations shape product development and market access. The market faces competition from alternative power distribution systems, but its inherent advantages in flexibility and scalability maintain its relevance. Mergers and acquisitions (M&A) activity has been relatively consistent, with larger players consolidating their market positions and expanding their geographical reach.
- Market Concentration: Moderately concentrated, with top 5 players holding approximately xx% market share (2024).
- Technological Innovation: Focus on lightweight materials (aluminum alloys), improved insulation, and smart monitoring systems.
- Regulatory Framework: Compliance with international safety standards (IEC, UL) and environmental regulations (RoHS) influences product design.
- Competitive Substitutes: Traditional wiring systems, cable trays, and pre-fabricated power distribution units.
- End-User Demographics: Predominantly driven by commercial, industrial, and transportation sectors, with growing residential adoption.
- M&A Trends: Consolidation among major players, with an average of xx M&A deals annually (2019-2024). Deal values averaging xx million USD.
Busbar Trunking System Market Growth Trends & Insights
The busbar trunking system market experienced steady growth during the historical period (2019-2024), driven by increasing demand from the industrial and commercial sectors. The market size reached xx million units in 2024, exhibiting a CAGR of xx% during this period. Technological disruptions, including the adoption of smart grid technologies and improved energy efficiency standards, are further fueling market expansion. Shifting consumer preferences toward energy-efficient solutions and enhanced safety features are also contributing factors. The forecast period (2025-2033) projects continued growth, with a projected CAGR of xx%, driven by investments in infrastructure development and renewable energy projects globally. Market penetration in emerging economies is expected to increase significantly.
Dominant Regions, Countries, or Segments in Busbar Trunking System Market
The North American and European markets are currently leading the busbar trunking system market. The strong industrial base and robust infrastructure in these regions are major drivers. However, Asia-Pacific is expected to witness significant growth in the coming years. Within product segments, the high-voltage busbar trunking systems are witnessing higher growth, driven by increasing demand from the energy sector and large industrial facilities. The commercial and industrial end-user segments are the largest contributors to overall market growth.
- Leading Regions: North America and Europe (in terms of market share) followed by Asia-Pacific (in terms of growth).
- Key Drivers (Asia-Pacific): Rapid industrialization, expanding power grids, and government initiatives promoting infrastructure development.
- Key Drivers (North America): Robust construction sector, ongoing upgrades to existing infrastructure, stringent safety standards, and rising demand for energy efficiency.
- Dominant Segments: High-voltage busbar systems showing high growth; Commercial and Industrial end-users leading in market share.
Busbar Trunking System Market Product Landscape
Busbar trunking systems are evolving beyond basic power distribution, incorporating features like integrated lighting, data transmission capabilities, and advanced monitoring systems. Manufacturers are focusing on lightweight designs, improved safety features, and enhanced modularity to cater to diverse applications. Key selling propositions include flexibility, scalability, and reduced installation time compared to traditional wiring methods. Advancements in materials science, particularly the use of high-strength aluminum alloys and advanced insulation materials, are enhancing performance and durability.
Key Drivers, Barriers & Challenges in Busbar Trunking System Market
Key Drivers: Increased demand from data centers and industrial automation, stringent safety regulations, rising energy costs, and the need for efficient power distribution in large buildings and infrastructure projects.
Challenges: High initial investment costs, competition from alternative technologies, supply chain disruptions impacting material availability, and the complexity of installation in retrofit projects. These factors could potentially reduce market growth by an estimated xx% annually if not mitigated effectively.
Emerging Opportunities in Busbar Trunking System Market
Untapped potential exists in developing economies experiencing rapid infrastructure growth. Smart busbar trunking systems incorporating IoT and digital twin technologies represent a key opportunity. Furthermore, demand for customized solutions tailored to specific industry needs is growing, presenting opportunities for specialized manufacturers. The integration of renewable energy sources into busbar trunking systems is also a significant emerging area.
Growth Accelerators in the Busbar Trunking System Market Industry
Technological innovations, strategic alliances and partnerships, and expansion into new geographical markets are key growth catalysts. Advancements in materials science, such as the development of lighter and more efficient materials, are boosting market expansion. Strategic collaborations between manufacturers and system integrators are facilitating the adoption of advanced busbar trunking systems. Furthermore, penetration into new markets and customer segments through targeted marketing initiatives is driving market growth.
Key Players Shaping the Busbar Trunking System Market Market
- Larsen & Toubro Limited
- Legrand SA
- Megabarre Group
- C&S Electric Ltd
- NAXSO S r l
- Siemens AG
- Schneider Electric SE
- Eaton Corporation PLC
- Godrej Boyce Mfg Co
- Pogliano Busbar S r l
- General Electric Company
- Anord Mardix IBAR (EMEA) Limited
Notable Milestones in Busbar Trunking System Market Sector
- September 2021: Vertiv Holdings Company acquires E&I Engineering Ireland and Powerbar Gulf for USD 1.8 billion, signifying significant consolidation in the market. This deal highlights the growing interest in busbar trunking systems as a key component of critical digital infrastructure.
In-Depth Busbar Trunking System Market Market Outlook
The busbar trunking system market is poised for sustained growth, driven by technological advancements, increasing demand from diverse sectors, and favorable government policies in several key regions. Opportunities abound in the integration of smart technologies, expansion into emerging markets, and the development of customized solutions. Strategic partnerships and investment in research and development will be crucial for companies to maintain a competitive edge and capitalize on the significant growth potential in the forecast period.
Busbar Trunking System Market Segmentation
-
1. Material
- 1.1. Aluminum
- 1.2. Copper
-
2. Power Rating
- 2.1. Lighting
- 2.2. Low Voltage
- 2.3. Medium Voltage
- 2.4. High Voltage
-
3. End-User
- 3.1. Commercial
- 3.2. Industrial
- 3.3. Transportation
- 3.4. Residential
Busbar Trunking System Market Segmentation By Geography
- 1. North America
- 2. Europe
- 3. Asia Pacific
- 4. South America
- 5. Middle East and Africa
Busbar Trunking System Market REPORT HIGHLIGHTS
| Aspects | Details |
|---|---|
| Study Period | 2019-2033 |
| Base Year | 2024 |
| Estimated Year | 2025 |
| Forecast Period | 2025-2033 |
| Historical Period | 2019-2024 |
| Growth Rate | CAGR of > 5.00% from 2019-2033 |
| Segmentation |
|
Table of Contents
- 1. Introduction
- 1.1. Research Scope
- 1.2. Market Segmentation
- 1.3. Research Methodology
- 1.4. Definitions and Assumptions
- 2. Executive Summary
- 2.1. Introduction
- 3. Market Dynamics
- 3.1. Introduction
- 3.2. Market Drivers
- 3.2.1. 4.; Expanding Pipeline Infrastructure4.; Growing Energy Demand
- 3.3. Market Restrains
- 3.3.1. 4.; Political Instability and Militant Attacks on Pipeline Infrastructure
- 3.4. Market Trends
- 3.4.1. Industrial Sector to Dominate the Market
- 4. Market Factor Analysis
- 4.1. Porters Five Forces
- 4.2. Supply/Value Chain
- 4.3. PESTEL analysis
- 4.4. Market Entropy
- 4.5. Patent/Trademark Analysis
- 5. Global Busbar Trunking System Market Analysis, Insights and Forecast, 2019-2031
- 5.1. Market Analysis, Insights and Forecast - by Material
- 5.1.1. Aluminum
- 5.1.2. Copper
- 5.2. Market Analysis, Insights and Forecast - by Power Rating
- 5.2.1. Lighting
- 5.2.2. Low Voltage
- 5.2.3. Medium Voltage
- 5.2.4. High Voltage
- 5.3. Market Analysis, Insights and Forecast - by End-User
- 5.3.1. Commercial
- 5.3.2. Industrial
- 5.3.3. Transportation
- 5.3.4. Residential
- 5.4. Market Analysis, Insights and Forecast - by Region
- 5.4.1. North America
- 5.4.2. Europe
- 5.4.3. Asia Pacific
- 5.4.4. South America
- 5.4.5. Middle East and Africa
- 5.1. Market Analysis, Insights and Forecast - by Material
- 6. North America Busbar Trunking System Market Analysis, Insights and Forecast, 2019-2031
- 6.1. Market Analysis, Insights and Forecast - by Material
- 6.1.1. Aluminum
- 6.1.2. Copper
- 6.2. Market Analysis, Insights and Forecast - by Power Rating
- 6.2.1. Lighting
- 6.2.2. Low Voltage
- 6.2.3. Medium Voltage
- 6.2.4. High Voltage
- 6.3. Market Analysis, Insights and Forecast - by End-User
- 6.3.1. Commercial
- 6.3.2. Industrial
- 6.3.3. Transportation
- 6.3.4. Residential
- 6.1. Market Analysis, Insights and Forecast - by Material
- 7. Europe Busbar Trunking System Market Analysis, Insights and Forecast, 2019-2031
- 7.1. Market Analysis, Insights and Forecast - by Material
- 7.1.1. Aluminum
- 7.1.2. Copper
- 7.2. Market Analysis, Insights and Forecast - by Power Rating
- 7.2.1. Lighting
- 7.2.2. Low Voltage
- 7.2.3. Medium Voltage
- 7.2.4. High Voltage
- 7.3. Market Analysis, Insights and Forecast - by End-User
- 7.3.1. Commercial
- 7.3.2. Industrial
- 7.3.3. Transportation
- 7.3.4. Residential
- 7.1. Market Analysis, Insights and Forecast - by Material
- 8. Asia Pacific Busbar Trunking System Market Analysis, Insights and Forecast, 2019-2031
- 8.1. Market Analysis, Insights and Forecast - by Material
- 8.1.1. Aluminum
- 8.1.2. Copper
- 8.2. Market Analysis, Insights and Forecast - by Power Rating
- 8.2.1. Lighting
- 8.2.2. Low Voltage
- 8.2.3. Medium Voltage
- 8.2.4. High Voltage
- 8.3. Market Analysis, Insights and Forecast - by End-User
- 8.3.1. Commercial
- 8.3.2. Industrial
- 8.3.3. Transportation
- 8.3.4. Residential
- 8.1. Market Analysis, Insights and Forecast - by Material
- 9. South America Busbar Trunking System Market Analysis, Insights and Forecast, 2019-2031
- 9.1. Market Analysis, Insights and Forecast - by Material
- 9.1.1. Aluminum
- 9.1.2. Copper
- 9.2. Market Analysis, Insights and Forecast - by Power Rating
- 9.2.1. Lighting
- 9.2.2. Low Voltage
- 9.2.3. Medium Voltage
- 9.2.4. High Voltage
- 9.3. Market Analysis, Insights and Forecast - by End-User
- 9.3.1. Commercial
- 9.3.2. Industrial
- 9.3.3. Transportation
- 9.3.4. Residential
- 9.1. Market Analysis, Insights and Forecast - by Material
- 10. Middle East and Africa Busbar Trunking System Market Analysis, Insights and Forecast, 2019-2031
- 10.1. Market Analysis, Insights and Forecast - by Material
- 10.1.1. Aluminum
- 10.1.2. Copper
- 10.2. Market Analysis, Insights and Forecast - by Power Rating
- 10.2.1. Lighting
- 10.2.2. Low Voltage
- 10.2.3. Medium Voltage
- 10.2.4. High Voltage
- 10.3. Market Analysis, Insights and Forecast - by End-User
- 10.3.1. Commercial
- 10.3.2. Industrial
- 10.3.3. Transportation
- 10.3.4. Residential
- 10.1. Market Analysis, Insights and Forecast - by Material
- 11. North America Busbar Trunking System Market Analysis, Insights and Forecast, 2019-2031
- 11.1. Market Analysis, Insights and Forecast - By Country/Sub-region
- 11.1.1 United States
- 11.1.2 Canada
- 11.1.3 Mexico
- 12. Europe Busbar Trunking System Market Analysis, Insights and Forecast, 2019-2031
- 12.1. Market Analysis, Insights and Forecast - By Country/Sub-region
- 12.1.1 Germany
- 12.1.2 United Kingdom
- 12.1.3 France
- 12.1.4 Spain
- 12.1.5 Italy
- 12.1.6 Spain
- 12.1.7 Belgium
- 12.1.8 Netherland
- 12.1.9 Nordics
- 12.1.10 Rest of Europe
- 13. Asia Pacific Busbar Trunking System Market Analysis, Insights and Forecast, 2019-2031
- 13.1. Market Analysis, Insights and Forecast - By Country/Sub-region
- 13.1.1 China
- 13.1.2 Japan
- 13.1.3 India
- 13.1.4 South Korea
- 13.1.5 Southeast Asia
- 13.1.6 Australia
- 13.1.7 Indonesia
- 13.1.8 Phillipes
- 13.1.9 Singapore
- 13.1.10 Thailandc
- 13.1.11 Rest of Asia Pacific
- 14. South America Busbar Trunking System Market Analysis, Insights and Forecast, 2019-2031
- 14.1. Market Analysis, Insights and Forecast - By Country/Sub-region
- 14.1.1 Brazil
- 14.1.2 Argentina
- 14.1.3 Peru
- 14.1.4 Chile
- 14.1.5 Colombia
- 14.1.6 Ecuador
- 14.1.7 Venezuela
- 14.1.8 Rest of South America
- 15. MEA Busbar Trunking System Market Analysis, Insights and Forecast, 2019-2031
- 15.1. Market Analysis, Insights and Forecast - By Country/Sub-region
- 15.1.1 United Arab Emirates
- 15.1.2 Saudi Arabia
- 15.1.3 South Africa
- 15.1.4 Rest of Middle East and Africa
- 16. Competitive Analysis
- 16.1. Global Market Share Analysis 2024
- 16.2. Company Profiles
- 16.2.1 Larsen & Toubro Limited
- 16.2.1.1. Overview
- 16.2.1.2. Products
- 16.2.1.3. SWOT Analysis
- 16.2.1.4. Recent Developments
- 16.2.1.5. Financials (Based on Availability)
- 16.2.2 Legrand SA
- 16.2.2.1. Overview
- 16.2.2.2. Products
- 16.2.2.3. SWOT Analysis
- 16.2.2.4. Recent Developments
- 16.2.2.5. Financials (Based on Availability)
- 16.2.3 Megabarre Group
- 16.2.3.1. Overview
- 16.2.3.2. Products
- 16.2.3.3. SWOT Analysis
- 16.2.3.4. Recent Developments
- 16.2.3.5. Financials (Based on Availability)
- 16.2.4 C&S Electric Ltd
- 16.2.4.1. Overview
- 16.2.4.2. Products
- 16.2.4.3. SWOT Analysis
- 16.2.4.4. Recent Developments
- 16.2.4.5. Financials (Based on Availability)
- 16.2.5 NAXSO S r l
- 16.2.5.1. Overview
- 16.2.5.2. Products
- 16.2.5.3. SWOT Analysis
- 16.2.5.4. Recent Developments
- 16.2.5.5. Financials (Based on Availability)
- 16.2.6 Siemens AG
- 16.2.6.1. Overview
- 16.2.6.2. Products
- 16.2.6.3. SWOT Analysis
- 16.2.6.4. Recent Developments
- 16.2.6.5. Financials (Based on Availability)
- 16.2.7 Schneider Electric SE
- 16.2.7.1. Overview
- 16.2.7.2. Products
- 16.2.7.3. SWOT Analysis
- 16.2.7.4. Recent Developments
- 16.2.7.5. Financials (Based on Availability)
- 16.2.8 Eaton Corporation PLC
- 16.2.8.1. Overview
- 16.2.8.2. Products
- 16.2.8.3. SWOT Analysis
- 16.2.8.4. Recent Developments
- 16.2.8.5. Financials (Based on Availability)
- 16.2.9 Godrej Boyce Mfg Co
- 16.2.9.1. Overview
- 16.2.9.2. Products
- 16.2.9.3. SWOT Analysis
- 16.2.9.4. Recent Developments
- 16.2.9.5. Financials (Based on Availability)
- 16.2.10 Pogliano Busbar S r l
- 16.2.10.1. Overview
- 16.2.10.2. Products
- 16.2.10.3. SWOT Analysis
- 16.2.10.4. Recent Developments
- 16.2.10.5. Financials (Based on Availability)
- 16.2.11 General Electric Company
- 16.2.11.1. Overview
- 16.2.11.2. Products
- 16.2.11.3. SWOT Analysis
- 16.2.11.4. Recent Developments
- 16.2.11.5. Financials (Based on Availability)
- 16.2.12 Anord Mardix IBAR (EMEA) Limited
- 16.2.12.1. Overview
- 16.2.12.2. Products
- 16.2.12.3. SWOT Analysis
- 16.2.12.4. Recent Developments
- 16.2.12.5. Financials (Based on Availability)
- 16.2.1 Larsen & Toubro Limited
List of Figures
- Figure 1: Global Busbar Trunking System Market Revenue Breakdown (Million, %) by Region 2024 & 2032
- Figure 2: North America Busbar Trunking System Market Revenue (Million), by Country 2024 & 2032
- Figure 3: North America Busbar Trunking System Market Revenue Share (%), by Country 2024 & 2032
- Figure 4: Europe Busbar Trunking System Market Revenue (Million), by Country 2024 & 2032
- Figure 5: Europe Busbar Trunking System Market Revenue Share (%), by Country 2024 & 2032
- Figure 6: Asia Pacific Busbar Trunking System Market Revenue (Million), by Country 2024 & 2032
- Figure 7: Asia Pacific Busbar Trunking System Market Revenue Share (%), by Country 2024 & 2032
- Figure 8: South America Busbar Trunking System Market Revenue (Million), by Country 2024 & 2032
- Figure 9: South America Busbar Trunking System Market Revenue Share (%), by Country 2024 & 2032
- Figure 10: MEA Busbar Trunking System Market Revenue (Million), by Country 2024 & 2032
- Figure 11: MEA Busbar Trunking System Market Revenue Share (%), by Country 2024 & 2032
- Figure 12: North America Busbar Trunking System Market Revenue (Million), by Material 2024 & 2032
- Figure 13: North America Busbar Trunking System Market Revenue Share (%), by Material 2024 & 2032
- Figure 14: North America Busbar Trunking System Market Revenue (Million), by Power Rating 2024 & 2032
- Figure 15: North America Busbar Trunking System Market Revenue Share (%), by Power Rating 2024 & 2032
- Figure 16: North America Busbar Trunking System Market Revenue (Million), by End-User 2024 & 2032
- Figure 17: North America Busbar Trunking System Market Revenue Share (%), by End-User 2024 & 2032
- Figure 18: North America Busbar Trunking System Market Revenue (Million), by Country 2024 & 2032
- Figure 19: North America Busbar Trunking System Market Revenue Share (%), by Country 2024 & 2032
- Figure 20: Europe Busbar Trunking System Market Revenue (Million), by Material 2024 & 2032
- Figure 21: Europe Busbar Trunking System Market Revenue Share (%), by Material 2024 & 2032
- Figure 22: Europe Busbar Trunking System Market Revenue (Million), by Power Rating 2024 & 2032
- Figure 23: Europe Busbar Trunking System Market Revenue Share (%), by Power Rating 2024 & 2032
- Figure 24: Europe Busbar Trunking System Market Revenue (Million), by End-User 2024 & 2032
- Figure 25: Europe Busbar Trunking System Market Revenue Share (%), by End-User 2024 & 2032
- Figure 26: Europe Busbar Trunking System Market Revenue (Million), by Country 2024 & 2032
- Figure 27: Europe Busbar Trunking System Market Revenue Share (%), by Country 2024 & 2032
- Figure 28: Asia Pacific Busbar Trunking System Market Revenue (Million), by Material 2024 & 2032
- Figure 29: Asia Pacific Busbar Trunking System Market Revenue Share (%), by Material 2024 & 2032
- Figure 30: Asia Pacific Busbar Trunking System Market Revenue (Million), by Power Rating 2024 & 2032
- Figure 31: Asia Pacific Busbar Trunking System Market Revenue Share (%), by Power Rating 2024 & 2032
- Figure 32: Asia Pacific Busbar Trunking System Market Revenue (Million), by End-User 2024 & 2032
- Figure 33: Asia Pacific Busbar Trunking System Market Revenue Share (%), by End-User 2024 & 2032
- Figure 34: Asia Pacific Busbar Trunking System Market Revenue (Million), by Country 2024 & 2032
- Figure 35: Asia Pacific Busbar Trunking System Market Revenue Share (%), by Country 2024 & 2032
- Figure 36: South America Busbar Trunking System Market Revenue (Million), by Material 2024 & 2032
- Figure 37: South America Busbar Trunking System Market Revenue Share (%), by Material 2024 & 2032
- Figure 38: South America Busbar Trunking System Market Revenue (Million), by Power Rating 2024 & 2032
- Figure 39: South America Busbar Trunking System Market Revenue Share (%), by Power Rating 2024 & 2032
- Figure 40: South America Busbar Trunking System Market Revenue (Million), by End-User 2024 & 2032
- Figure 41: South America Busbar Trunking System Market Revenue Share (%), by End-User 2024 & 2032
- Figure 42: South America Busbar Trunking System Market Revenue (Million), by Country 2024 & 2032
- Figure 43: South America Busbar Trunking System Market Revenue Share (%), by Country 2024 & 2032
- Figure 44: Middle East and Africa Busbar Trunking System Market Revenue (Million), by Material 2024 & 2032
- Figure 45: Middle East and Africa Busbar Trunking System Market Revenue Share (%), by Material 2024 & 2032
- Figure 46: Middle East and Africa Busbar Trunking System Market Revenue (Million), by Power Rating 2024 & 2032
- Figure 47: Middle East and Africa Busbar Trunking System Market Revenue Share (%), by Power Rating 2024 & 2032
- Figure 48: Middle East and Africa Busbar Trunking System Market Revenue (Million), by End-User 2024 & 2032
- Figure 49: Middle East and Africa Busbar Trunking System Market Revenue Share (%), by End-User 2024 & 2032
- Figure 50: Middle East and Africa Busbar Trunking System Market Revenue (Million), by Country 2024 & 2032
- Figure 51: Middle East and Africa Busbar Trunking System Market Revenue Share (%), by Country 2024 & 2032
List of Tables
- Table 1: Global Busbar Trunking System Market Revenue Million Forecast, by Region 2019 & 2032
- Table 2: Global Busbar Trunking System Market Revenue Million Forecast, by Material 2019 & 2032
- Table 3: Global Busbar Trunking System Market Revenue Million Forecast, by Power Rating 2019 & 2032
- Table 4: Global Busbar Trunking System Market Revenue Million Forecast, by End-User 2019 & 2032
- Table 5: Global Busbar Trunking System Market Revenue Million Forecast, by Region 2019 & 2032
- Table 6: Global Busbar Trunking System Market Revenue Million Forecast, by Country 2019 & 2032
- Table 7: United States Busbar Trunking System Market Revenue (Million) Forecast, by Application 2019 & 2032
- Table 8: Canada Busbar Trunking System Market Revenue (Million) Forecast, by Application 2019 & 2032
- Table 9: Mexico Busbar Trunking System Market Revenue (Million) Forecast, by Application 2019 & 2032
- Table 10: Global Busbar Trunking System Market Revenue Million Forecast, by Country 2019 & 2032
- Table 11: Germany Busbar Trunking System Market Revenue (Million) Forecast, by Application 2019 & 2032
- Table 12: United Kingdom Busbar Trunking System Market Revenue (Million) Forecast, by Application 2019 & 2032
- Table 13: France Busbar Trunking System Market Revenue (Million) Forecast, by Application 2019 & 2032
- Table 14: Spain Busbar Trunking System Market Revenue (Million) Forecast, by Application 2019 & 2032
- Table 15: Italy Busbar Trunking System Market Revenue (Million) Forecast, by Application 2019 & 2032
- Table 16: Spain Busbar Trunking System Market Revenue (Million) Forecast, by Application 2019 & 2032
- Table 17: Belgium Busbar Trunking System Market Revenue (Million) Forecast, by Application 2019 & 2032
- Table 18: Netherland Busbar Trunking System Market Revenue (Million) Forecast, by Application 2019 & 2032
- Table 19: Nordics Busbar Trunking System Market Revenue (Million) Forecast, by Application 2019 & 2032
- Table 20: Rest of Europe Busbar Trunking System Market Revenue (Million) Forecast, by Application 2019 & 2032
- Table 21: Global Busbar Trunking System Market Revenue Million Forecast, by Country 2019 & 2032
- Table 22: China Busbar Trunking System Market Revenue (Million) Forecast, by Application 2019 & 2032
- Table 23: Japan Busbar Trunking System Market Revenue (Million) Forecast, by Application 2019 & 2032
- Table 24: India Busbar Trunking System Market Revenue (Million) Forecast, by Application 2019 & 2032
- Table 25: South Korea Busbar Trunking System Market Revenue (Million) Forecast, by Application 2019 & 2032
- Table 26: Southeast Asia Busbar Trunking System Market Revenue (Million) Forecast, by Application 2019 & 2032
- Table 27: Australia Busbar Trunking System Market Revenue (Million) Forecast, by Application 2019 & 2032
- Table 28: Indonesia Busbar Trunking System Market Revenue (Million) Forecast, by Application 2019 & 2032
- Table 29: Phillipes Busbar Trunking System Market Revenue (Million) Forecast, by Application 2019 & 2032
- Table 30: Singapore Busbar Trunking System Market Revenue (Million) Forecast, by Application 2019 & 2032
- Table 31: Thailandc Busbar Trunking System Market Revenue (Million) Forecast, by Application 2019 & 2032
- Table 32: Rest of Asia Pacific Busbar Trunking System Market Revenue (Million) Forecast, by Application 2019 & 2032
- Table 33: Global Busbar Trunking System Market Revenue Million Forecast, by Country 2019 & 2032
- Table 34: Brazil Busbar Trunking System Market Revenue (Million) Forecast, by Application 2019 & 2032
- Table 35: Argentina Busbar Trunking System Market Revenue (Million) Forecast, by Application 2019 & 2032
- Table 36: Peru Busbar Trunking System Market Revenue (Million) Forecast, by Application 2019 & 2032
- Table 37: Chile Busbar Trunking System Market Revenue (Million) Forecast, by Application 2019 & 2032
- Table 38: Colombia Busbar Trunking System Market Revenue (Million) Forecast, by Application 2019 & 2032
- Table 39: Ecuador Busbar Trunking System Market Revenue (Million) Forecast, by Application 2019 & 2032
- Table 40: Venezuela Busbar Trunking System Market Revenue (Million) Forecast, by Application 2019 & 2032
- Table 41: Rest of South America Busbar Trunking System Market Revenue (Million) Forecast, by Application 2019 & 2032
- Table 42: Global Busbar Trunking System Market Revenue Million Forecast, by Country 2019 & 2032
- Table 43: United Arab Emirates Busbar Trunking System Market Revenue (Million) Forecast, by Application 2019 & 2032
- Table 44: Saudi Arabia Busbar Trunking System Market Revenue (Million) Forecast, by Application 2019 & 2032
- Table 45: South Africa Busbar Trunking System Market Revenue (Million) Forecast, by Application 2019 & 2032
- Table 46: Rest of Middle East and Africa Busbar Trunking System Market Revenue (Million) Forecast, by Application 2019 & 2032
- Table 47: Global Busbar Trunking System Market Revenue Million Forecast, by Material 2019 & 2032
- Table 48: Global Busbar Trunking System Market Revenue Million Forecast, by Power Rating 2019 & 2032
- Table 49: Global Busbar Trunking System Market Revenue Million Forecast, by End-User 2019 & 2032
- Table 50: Global Busbar Trunking System Market Revenue Million Forecast, by Country 2019 & 2032
- Table 51: Global Busbar Trunking System Market Revenue Million Forecast, by Material 2019 & 2032
- Table 52: Global Busbar Trunking System Market Revenue Million Forecast, by Power Rating 2019 & 2032
- Table 53: Global Busbar Trunking System Market Revenue Million Forecast, by End-User 2019 & 2032
- Table 54: Global Busbar Trunking System Market Revenue Million Forecast, by Country 2019 & 2032
- Table 55: Global Busbar Trunking System Market Revenue Million Forecast, by Material 2019 & 2032
- Table 56: Global Busbar Trunking System Market Revenue Million Forecast, by Power Rating 2019 & 2032
- Table 57: Global Busbar Trunking System Market Revenue Million Forecast, by End-User 2019 & 2032
- Table 58: Global Busbar Trunking System Market Revenue Million Forecast, by Country 2019 & 2032
- Table 59: Global Busbar Trunking System Market Revenue Million Forecast, by Material 2019 & 2032
- Table 60: Global Busbar Trunking System Market Revenue Million Forecast, by Power Rating 2019 & 2032
- Table 61: Global Busbar Trunking System Market Revenue Million Forecast, by End-User 2019 & 2032
- Table 62: Global Busbar Trunking System Market Revenue Million Forecast, by Country 2019 & 2032
- Table 63: Global Busbar Trunking System Market Revenue Million Forecast, by Material 2019 & 2032
- Table 64: Global Busbar Trunking System Market Revenue Million Forecast, by Power Rating 2019 & 2032
- Table 65: Global Busbar Trunking System Market Revenue Million Forecast, by End-User 2019 & 2032
- Table 66: Global Busbar Trunking System Market Revenue Million Forecast, by Country 2019 & 2032
Frequently Asked Questions
1. What is the projected Compound Annual Growth Rate (CAGR) of the Busbar Trunking System Market?
The projected CAGR is approximately > 5.00%.
2. Which companies are prominent players in the Busbar Trunking System Market?
Key companies in the market include Larsen & Toubro Limited, Legrand SA, Megabarre Group, C&S Electric Ltd, NAXSO S r l, Siemens AG, Schneider Electric SE, Eaton Corporation PLC, Godrej Boyce Mfg Co, Pogliano Busbar S r l, General Electric Company, Anord Mardix IBAR (EMEA) Limited.
3. What are the main segments of the Busbar Trunking System Market?
The market segments include Material, Power Rating, End-User.
4. Can you provide details about the market size?
The market size is estimated to be USD XX Million as of 2022.
5. What are some drivers contributing to market growth?
4.; Expanding Pipeline Infrastructure4.; Growing Energy Demand.
6. What are the notable trends driving market growth?
Industrial Sector to Dominate the Market.
7. Are there any restraints impacting market growth?
4.; Political Instability and Militant Attacks on Pipeline Infrastructure.
8. Can you provide examples of recent developments in the market?
In September 2021, Vertiv Holdings Company, a global provider of critical digital infrastructure and continuity solutions, announced the acquisition of E&I Engineering Ireland and its UAE-based affiliate, Powerbar Gulf, a leading manufacturer of busbar trunking systems in the GCC, for USD 1.8 billion in upfront consideration plus the potential for up to USD 200 million in cash.
9. What pricing options are available for accessing the report?
Pricing options include single-user, multi-user, and enterprise licenses priced at USD 4750, USD 5250, and USD 8750 respectively.
10. Is the market size provided in terms of value or volume?
The market size is provided in terms of value, measured in Million.
11. Are there any specific market keywords associated with the report?
Yes, the market keyword associated with the report is "Busbar Trunking System Market," which aids in identifying and referencing the specific market segment covered.
12. How do I determine which pricing option suits my needs best?
The pricing options vary based on user requirements and access needs. Individual users may opt for single-user licenses, while businesses requiring broader access may choose multi-user or enterprise licenses for cost-effective access to the report.
13. Are there any additional resources or data provided in the Busbar Trunking System Market report?
While the report offers comprehensive insights, it's advisable to review the specific contents or supplementary materials provided to ascertain if additional resources or data are available.
14. How can I stay updated on further developments or reports in the Busbar Trunking System Market?
To stay informed about further developments, trends, and reports in the Busbar Trunking System Market, consider subscribing to industry newsletters, following relevant companies and organizations, or regularly checking reputable industry news sources and publications.
Methodology
Step 1 - Identification of Relevant Samples Size from Population Database


Step 2 - Approaches for Defining Global Market Size (Value, Volume* & Price*)

Note*: In applicable scenarios
Step 3 - Data Sources
Primary Research
- Web Analytics
- Survey Reports
- Research Institute
- Latest Research Reports
- Opinion Leaders
Secondary Research
- Annual Reports
- White Paper
- Latest Press Release
- Industry Association
- Paid Database
- Investor Presentations

Step 4 - Data Triangulation
Involves using different sources of information in order to increase the validity of a study
These sources are likely to be stakeholders in a program - participants, other researchers, program staff, other community members, and so on.
Then we put all data in single framework & apply various statistical tools to find out the dynamic on the market.
During the analysis stage, feedback from the stakeholder groups would be compared to determine areas of agreement as well as areas of divergence


