

Key Insights
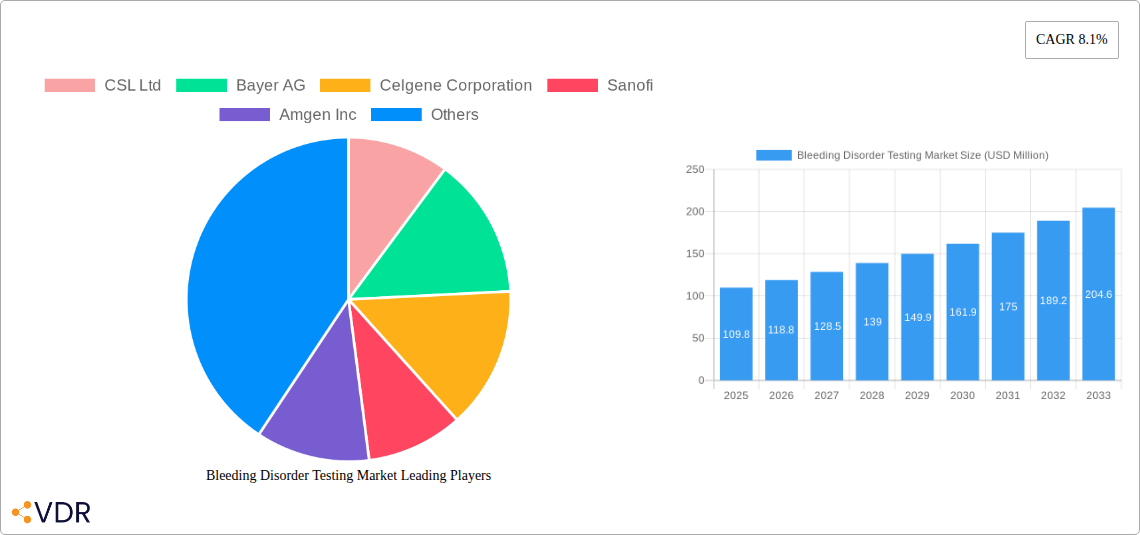
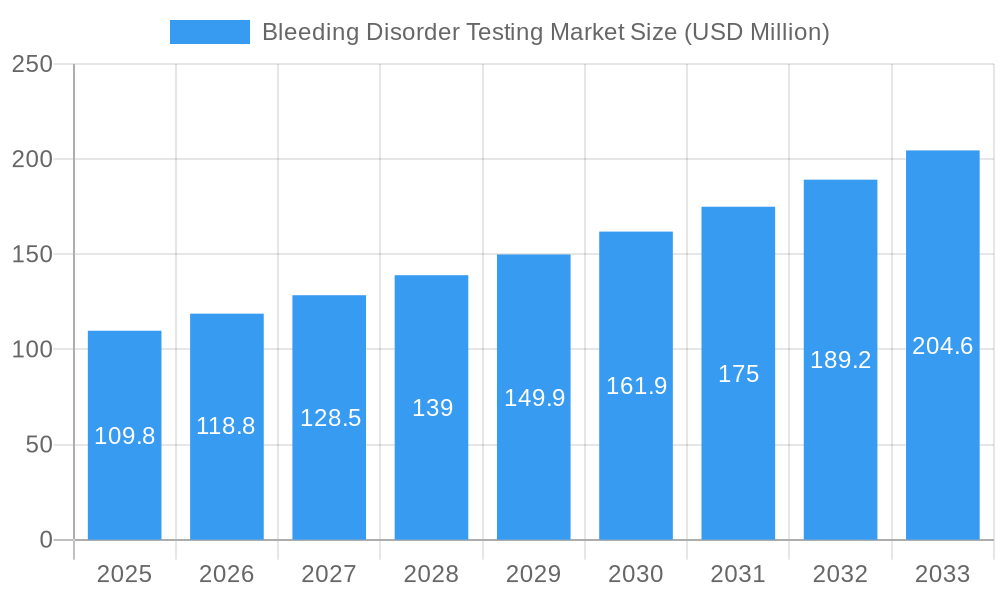
The global bleeding disorder testing market is poised for significant expansion, projected to reach $109.8 million in 2025, driven by a robust CAGR of 8.1% throughout the forecast period. This growth is primarily fueled by an increasing prevalence of various bleeding disorders, including inherited conditions like hemophilia and von Willebrand disease, as well as acquired disorders such as those linked to platelet dysfunction and myeloproliferative neoplasms. Advancements in diagnostic technologies, offering greater accuracy and speed, coupled with a rising awareness among both healthcare professionals and the general public, are further stimulating market demand. The expanding healthcare infrastructure, particularly in emerging economies, and a growing emphasis on early diagnosis and personalized treatment strategies are also significant contributors to this upward trajectory.
Bleeding Disorder Testing Market Market Size (In Million)
The market segmentation reveals diverse application areas, with genetic hematology disorders and platelet-based disorders representing key segments due to their widespread impact and continuous research efforts. The development and adoption of advanced testing methodologies, including sophisticated immunoassay, coagulation assays, and molecular diagnostic techniques, are crucial drivers. Furthermore, the integration of recombinant factors and other innovative diagnostic solutions are enhancing treatment efficacy and patient outcomes. While the market is characterized by strong growth, potential challenges may include high costs associated with certain advanced diagnostic platforms and the need for specialized training among laboratory personnel. However, the continuous innovation pipeline and strategic collaborations among key players are expected to mitigate these restraints, ensuring sustained market development.
Bleeding Disorder Testing Market Company Market Share
This in-depth report delivers a meticulous analysis of the global Bleeding Disorder Testing Market, encompassing its intricate dynamics, growth trajectory, regional dominance, product landscape, key players, and future outlook. Designed for stakeholders including diagnostic laboratories, pharmaceutical companies, research institutions, and investors, this report provides actionable insights for strategic decision-making. The study covers the historical period from 2019 to 2024, with the base year and estimated year both set at 2025, and projects a comprehensive forecast from 2025 to 2033. Values are presented in million units.
Bleeding Disorder Testing Market Market Dynamics & Structure
The Bleeding Disorder Testing Market is characterized by a moderately concentrated structure, with a few key players holding significant market share. Technological innovation is a primary driver, fueled by advancements in molecular diagnostics and immunoassay techniques, leading to more accurate and faster detection of various bleeding disorders. Regulatory frameworks, particularly those established by agencies like the FDA and EMA, play a crucial role in shaping market entry and product development, ensuring the safety and efficacy of diagnostic tests. Competitive product substitutes, while present, are largely overcome by the specificity and diagnostic accuracy of advanced testing methods. End-user demographics are shifting, with increasing awareness of rare bleeding disorders and a growing aging population contributing to higher demand. Mergers and acquisitions (M&A) trends are also observed as companies seek to expand their portfolios, gain access to new technologies, and strengthen their market position. For instance, the past few years have seen approximately 5-10 significant M&A deals annually, with deal values often ranging from tens to hundreds of millions of dollars. Barriers to innovation include the high cost of R&D, stringent regulatory approval processes, and the need for specialized expertise in hematology and molecular biology.
- Market Concentration: Moderately concentrated with key players like CSL Ltd, Bayer AG, and Takeda Pharmaceutical Company Limited (Shire Plc) holding substantial influence.
- Technological Innovation Drivers: Advances in PCR, next-generation sequencing (NGS), ELISA, and point-of-care testing (POCT).
- Regulatory Frameworks: Strict guidelines from FDA, EMA, and other regional health authorities impacting product development and market access.
- Competitive Landscape: Characterized by a mix of established diagnostic companies and emerging biotechnology firms.
- End-User Demographics: Rising prevalence of inherited bleeding disorders, increasing diagnosis rates in pediatric populations, and demand for advanced testing in elderly patients.
- M&A Trends: Strategic acquisitions to broaden product offerings and consolidate market presence.
Bleeding Disorder Testing Market Growth Trends & Insights
The Bleeding Disorder Testing Market is poised for robust growth, driven by a confluence of factors including increasing global prevalence of bleeding disorders, a growing emphasis on early diagnosis and personalized treatment, and continuous technological advancements. The market size evolution indicates a steady upward trend, with significant expansion anticipated throughout the forecast period. Adoption rates for advanced diagnostic tests, such as genetic testing for hemophilia and von Willebrand disease, are steadily increasing as healthcare providers recognize their importance in guiding treatment strategies and improving patient outcomes. Technological disruptions are primarily centered around the development of more sensitive, rapid, and cost-effective diagnostic platforms. This includes the refinement of molecular diagnostic techniques like PCR and NGS, making them more accessible for routine clinical use, and the emergence of point-of-care testing solutions that enable faster decision-making at the bedside. Consumer behavior shifts are also playing a crucial role, with patients becoming more informed and proactive in seeking diagnostic services, particularly for inherited conditions. The market penetration of comprehensive bleeding disorder testing panels is expected to rise as awareness campaigns and improved healthcare infrastructure enhance accessibility.
The CAGR for the Bleeding Disorder Testing Market is projected to be approximately 7.5% from 2025 to 2033. The market, valued at an estimated $6,500 million in 2025, is expected to reach over $11,500 million by 2033. This growth is underpinned by the increasing incidence of genetic hematology disorders and the rising demand for accurate diagnostic tools to manage these complex conditions. Furthermore, the growing acceptance of recombinant factor therapies and the subsequent need for precise monitoring and diagnosis contribute significantly to market expansion. The development of novel diagnostic assays with higher sensitivity and specificity is also a key factor driving adoption and market growth.
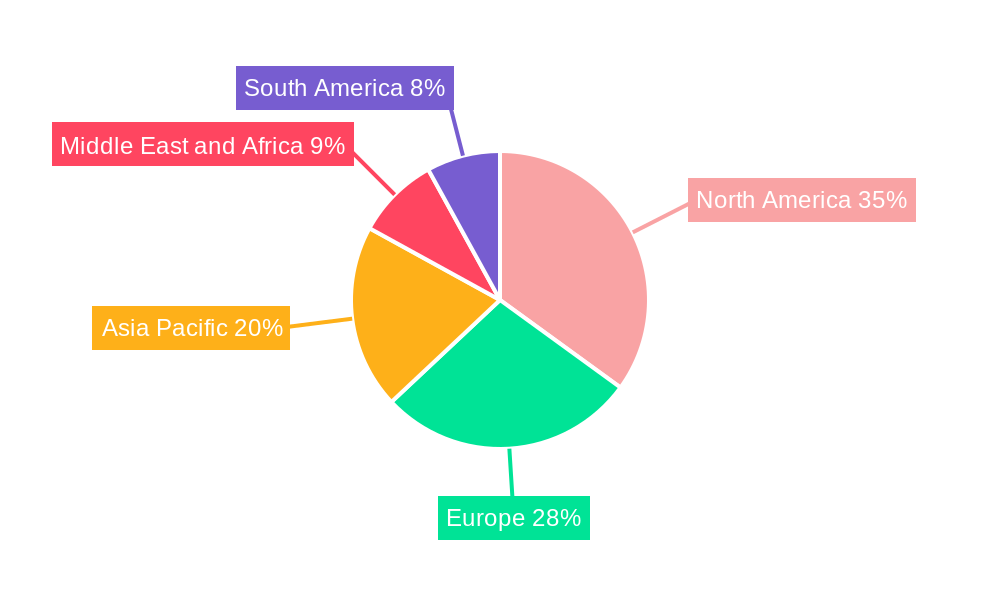
Dominant Regions, Countries, or Segments in Bleeding Disorder Testing Market
North America currently dominates the Bleeding Disorder Testing Market, driven by a sophisticated healthcare infrastructure, high patient awareness, and significant investment in R&D for hematological disorders. The United States, in particular, accounts for a substantial share of this regional dominance, owing to a high prevalence of diagnosed bleeding disorders and widespread access to advanced diagnostic technologies. The segment of Genetic Hematology Disorders within the application category is a major growth driver, reflecting the increasing focus on identifying the genetic underpinnings of conditions like hemophilia A and B, and von Willebrand disease. In terms of product type, Plasma Derived Factors continue to hold a significant market share due to their established efficacy and widespread use in treatment. However, Recombinant Factors are experiencing rapid growth, driven by advancements in biotechnology and a preference for treatments with lower risks of transmission-borne diseases.
The increasing prevalence of inherited bleeding disorders, coupled with strong reimbursement policies for diagnostic testing, further bolsters the North American market. Economic policies that support healthcare innovation and research, alongside well-established diagnostic laboratories and a skilled workforce, contribute to the region's leadership. The market share within North America for genetic hematology disorder testing is estimated to be around 35% of the total application segment.
Europe follows North America closely, with countries like Germany, the UK, and France demonstrating strong market performance. This is attributed to well-developed healthcare systems, robust regulatory support for diagnostic innovations, and a growing number of specialized hemophilia treatment centers. Asia Pacific, on the other hand, presents the fastest-growing regional market, fueled by increasing healthcare expenditure, rising awareness of bleeding disorders, and a growing focus on improving diagnostic capabilities in emerging economies. Initiatives aimed at expanding access to healthcare and diagnostic services in countries like China and India are expected to significantly contribute to market expansion in this region.
- Dominant Region: North America, driven by the United States.
- Leading Application Segment: Genetic Hematology Disorders, with a market share of approximately 35%.
- Key Driver for Application Segment: High prevalence of inherited bleeding disorders and advancements in genetic testing.
- Dominant Product Type: Plasma Derived Factors, with significant ongoing demand.
- Fastest Growing Product Type: Recombinant Factors, due to technological advancements and preference for safer alternatives.
- Emerging Market: Asia Pacific, exhibiting the highest growth potential.
Bleeding Disorder Testing Market Product Landscape
The Bleeding Disorder Testing Market product landscape is diverse, encompassing a range of sophisticated diagnostic tools and assays designed to detect and characterize various hemostatic abnormalities. Innovations focus on enhancing sensitivity, specificity, and turnaround time, catering to the complex needs of clinical hematology. Key product types include Enzyme-Linked Immunosorbent Assays (ELISA), Polymerase Chain Reaction (PCR) based tests, next-generation sequencing (NGS) panels, and chromogenic assays. These products are crucial for identifying deficiencies or dysfunctions in clotting factors, platelets, and other hemostatic components. The increasing understanding of the genetic basis of bleeding disorders has spurred the development of advanced molecular diagnostic kits, offering unparalleled accuracy in identifying disease-causing mutations. These novel products provide unique selling propositions through their ability to diagnose rare bleeding disorders with precision and facilitate personalized treatment strategies. Technological advancements are continually refining these offerings, making them more accessible and cost-effective for broader clinical application.
Key Drivers, Barriers & Challenges in Bleeding Disorder Testing Market
Key Drivers:
- Increasing prevalence of inherited bleeding disorders: Growing global incidence of conditions like hemophilia, von Willebrand disease, and rare factor deficiencies.
- Advancements in diagnostic technologies: Development of highly sensitive and specific molecular and immunoassay-based tests.
- Growing awareness and diagnosis rates: Enhanced patient and physician education leading to earlier detection.
- Demand for personalized medicine: Need for accurate genetic and factor-level diagnostics to guide targeted therapies.
- Government initiatives and funding: Increased support for rare disease research and diagnostics.
Barriers & Challenges:
- High cost of advanced diagnostic tests: Limited affordability in low and middle-income countries can hinder widespread adoption.
- Stringent regulatory approval processes: Lengthy and costly procedures for new diagnostic test approvals.
- Shortage of skilled laboratory personnel: Requirement for specialized expertise in hematology and molecular diagnostics.
- Reimbursement challenges: Inconsistent reimbursement policies across different healthcare systems.
- Complex nature of some bleeding disorders: Difficulty in diagnosing rare or mild forms of the conditions.
- Supply chain disruptions: Potential for delays in sourcing critical reagents and components for test manufacturing. The impact of these disruptions can lead to an estimated 5-10% increase in production costs and extended lead times for critical diagnostic kits.
Emerging Opportunities in Bleeding Disorder Testing Market
Emerging opportunities in the Bleeding Disorder Testing Market lie in the development and adoption of point-of-care (POCT) diagnostic solutions, which enable rapid testing at the patient's bedside, significantly reducing diagnosis time and improving patient management. The expansion of genetic testing for a wider spectrum of rare bleeding disorders, including those with complex genetic mutations, presents a significant untapped market. Furthermore, the integration of artificial intelligence (AI) and machine learning (ML) in interpreting complex diagnostic data, such as next-generation sequencing results, offers a novel avenue for enhancing diagnostic accuracy and efficiency. Growing healthcare investments in emerging economies, particularly in Asia Pacific and Latin America, create substantial opportunities for market penetration with cost-effective and accessible diagnostic solutions. The evolving consumer preference for home-based testing and remote diagnostics also opens avenues for innovative product development.
Growth Accelerators in the Bleeding Disorder Testing Market Industry
The Bleeding Disorder Testing Market is experiencing accelerated growth due to several key catalysts. Technological breakthroughs in genomic sequencing and multiplex assay development are enabling the identification of a broader range of genetic predispositions to bleeding disorders with greater precision. Strategic partnerships between diagnostic companies, pharmaceutical firms, and academic research institutions are fostering collaborative innovation and accelerating the translation of research findings into commercially viable diagnostic products. Market expansion strategies, including increased penetration into underserved geographies and the development of user-friendly diagnostic kits, are also significantly contributing to long-term growth. The growing emphasis on proactive health management and the desire for early intervention in inherited diseases are further fueling demand for comprehensive and accessible bleeding disorder testing.
Key Players Shaping the Bleeding Disorder Testing Market Market
- CSL Ltd
- Bayer AG
- Celgene Corporation
- Sanofi
- Amgen Inc
- AstraZeneca Plc
- Alexion Pharmaceuticals Inc
- Takeda Pharmaceutical Company Limited (Shire Plc)
- Novo Nordisk A/S
- Pfizer Inc
Notable Milestones in Bleeding Disorder Testing Market Sector
- 2020: Launch of novel gene therapy for Hemophilia B, driving demand for pre-treatment diagnostic screening.
- 2021: Introduction of advanced next-generation sequencing panels for rare bleeding disorders, improving diagnostic yield.
- 2022: Significant increase in M&A activity with the acquisition of smaller diagnostic startups by major players, aiming to consolidate market share.
- 2023 (Q1): Development of a new rapid immunoassay for platelet function testing, offering faster results in emergency settings.
- 2023 (Q3): Regulatory approval for a novel point-of-care diagnostic device for Hemophilia A carrier screening.
- 2024 (Ongoing): Increased investment in research for rare factor deficiencies, leading to the development of more comprehensive diagnostic assays.
In-Depth Bleeding Disorder Testing Market Market Outlook
The Bleeding Disorder Testing Market is on a trajectory of sustained growth, fueled by persistent technological innovation, a growing global awareness of hematological disorders, and an increasing demand for personalized medical interventions. The market's future potential is immense, with continued advancements in genetic diagnostics and the expansion of testing into underdeveloped regions set to drive substantial revenue streams. Strategic opportunities lie in focusing on the development of more cost-effective and accessible diagnostic solutions, particularly for rare bleeding disorders, and in leveraging digital health technologies to enhance diagnostic accessibility and patient engagement. The convergence of advanced diagnostics and targeted therapeutics will further solidify the market's importance in the healthcare ecosystem.
Bleeding Disorder Testing Market Segmentation
-
1. Product Type
- 1.1. Plasma Derived Factors
- 1.2. Recombinant Factors
- 1.3. Other Products
-
2. Application
- 2.1. Hemoglobin Diosrders
- 2.2. Platelet Based Disorders
- 2.3. Plasma Disorders
- 2.4. Myeloproliferative Disorders
- 2.5. Genetic Hematology Disorders
- 2.6. Blood Cancers
- 2.7. Other Application
Bleeding Disorder Testing Market Segmentation By Geography
-
1. North America
- 1.1. United States
- 1.2. Canada
- 1.3. Mexico
-
2. Europe
- 2.1. Germany
- 2.2. United Kingdom
- 2.3. France
- 2.4. Italy
- 2.5. Spain
- 2.6. Rest of Europe
-
3. Asia Pacific
- 3.1. China
- 3.2. Japan
- 3.3. India
- 3.4. Australia
- 3.5. South Korea
- 3.6. Rest of Asia Pacific
-
4. Middle East and Africa
- 4.1. GCC
- 4.2. South Africa
- 4.3. Rest of Middle East and Africa
-
5. South America
- 5.1. Brazil
- 5.2. Argentina
- 5.3. Rest of South America
Bleeding Disorder Testing Market Regional Market Share
Geographic Coverage of Bleeding Disorder Testing Market
Bleeding Disorder Testing Market REPORT HIGHLIGHTS
| Aspects | Details |
|---|---|
| Study Period | 2020-2034 |
| Base Year | 2025 |
| Estimated Year | 2026 |
| Forecast Period | 2026-2034 |
| Historical Period | 2020-2025 |
| Growth Rate | CAGR of 7.2% from 2020-2034 |
| Segmentation |
|
Table of Contents
- 1. Introduction
- 1.1. Research Scope
- 1.2. Market Segmentation
- 1.3. Research Objective
- 1.4. Definitions and Assumptions
- 2. Executive Summary
- 2.1. Market Snapshot
- 3. Market Dynamics
- 3.1. Market Drivers
- 3.2. Market Restrains
- 3.3. Market Trends
- 3.4. Market Opportunities
- 4. Market Factor Analysis
- 4.1. Porters Five Forces
- 4.1.1. Bargaining Power of Suppliers
- 4.1.2. Bargaining Power of Buyers
- 4.1.3. Threat of New Entrants
- 4.1.4. Threat of Substitutes
- 4.1.5. Competitive Rivalry
- 4.2. PESTEL analysis
- 4.3. BCG Analysis
- 4.3.1. Stars (High Growth, High Market Share)
- 4.3.2. Cash Cows (Low Growth, High Market Share)
- 4.3.3. Question Mark (High Growth, Low Market Share)
- 4.3.4. Dogs (Low Growth, Low Market Share)
- 4.4. Ansoff Matrix Analysis
- 4.5. Supply Chain Analysis
- 4.6. Regulatory Landscape
- 4.7. Current Market Potential and Opportunity Assessment (TAM–SAM–SOM Framework)
- 4.8. VDR Analyst Note
- 4.1. Porters Five Forces
- 5. Market Analysis, Insights and Forecast 2021-2033
- 5.1. Market Analysis, Insights and Forecast - by Product Type
- 5.1.1. Plasma Derived Factors
- 5.1.2. Recombinant Factors
- 5.1.3. Other Products
- 5.2. Market Analysis, Insights and Forecast - by Application
- 5.2.1. Hemoglobin Diosrders
- 5.2.2. Platelet Based Disorders
- 5.2.3. Plasma Disorders
- 5.2.4. Myeloproliferative Disorders
- 5.2.5. Genetic Hematology Disorders
- 5.2.6. Blood Cancers
- 5.2.7. Other Application
- 5.3. Market Analysis, Insights and Forecast - by Region
- 5.3.1. North America
- 5.3.2. Europe
- 5.3.3. Asia Pacific
- 5.3.4. Middle East and Africa
- 5.3.5. South America
- 5.1. Market Analysis, Insights and Forecast - by Product Type
- 6. Global Bleeding Disorder Testing Market Analysis, Insights and Forecast, 2021-2033
- 6.1. Market Analysis, Insights and Forecast - by Product Type
- 6.1.1. Plasma Derived Factors
- 6.1.2. Recombinant Factors
- 6.1.3. Other Products
- 6.2. Market Analysis, Insights and Forecast - by Application
- 6.2.1. Hemoglobin Diosrders
- 6.2.2. Platelet Based Disorders
- 6.2.3. Plasma Disorders
- 6.2.4. Myeloproliferative Disorders
- 6.2.5. Genetic Hematology Disorders
- 6.2.6. Blood Cancers
- 6.2.7. Other Application
- 6.1. Market Analysis, Insights and Forecast - by Product Type
- 7. North America Bleeding Disorder Testing Market Analysis, Insights and Forecast, 2021-2033
- 7.1. Market Analysis, Insights and Forecast - by Product Type
- 7.1.1. Plasma Derived Factors
- 7.1.2. Recombinant Factors
- 7.1.3. Other Products
- 7.2. Market Analysis, Insights and Forecast - by Application
- 7.2.1. Hemoglobin Diosrders
- 7.2.2. Platelet Based Disorders
- 7.2.3. Plasma Disorders
- 7.2.4. Myeloproliferative Disorders
- 7.2.5. Genetic Hematology Disorders
- 7.2.6. Blood Cancers
- 7.2.7. Other Application
- 7.1. Market Analysis, Insights and Forecast - by Product Type
- 8. Europe Bleeding Disorder Testing Market Analysis, Insights and Forecast, 2021-2033
- 8.1. Market Analysis, Insights and Forecast - by Product Type
- 8.1.1. Plasma Derived Factors
- 8.1.2. Recombinant Factors
- 8.1.3. Other Products
- 8.2. Market Analysis, Insights and Forecast - by Application
- 8.2.1. Hemoglobin Diosrders
- 8.2.2. Platelet Based Disorders
- 8.2.3. Plasma Disorders
- 8.2.4. Myeloproliferative Disorders
- 8.2.5. Genetic Hematology Disorders
- 8.2.6. Blood Cancers
- 8.2.7. Other Application
- 8.1. Market Analysis, Insights and Forecast - by Product Type
- 9. Asia Pacific Bleeding Disorder Testing Market Analysis, Insights and Forecast, 2021-2033
- 9.1. Market Analysis, Insights and Forecast - by Product Type
- 9.1.1. Plasma Derived Factors
- 9.1.2. Recombinant Factors
- 9.1.3. Other Products
- 9.2. Market Analysis, Insights and Forecast - by Application
- 9.2.1. Hemoglobin Diosrders
- 9.2.2. Platelet Based Disorders
- 9.2.3. Plasma Disorders
- 9.2.4. Myeloproliferative Disorders
- 9.2.5. Genetic Hematology Disorders
- 9.2.6. Blood Cancers
- 9.2.7. Other Application
- 9.1. Market Analysis, Insights and Forecast - by Product Type
- 10. Middle East and Africa Bleeding Disorder Testing Market Analysis, Insights and Forecast, 2021-2033
- 10.1. Market Analysis, Insights and Forecast - by Product Type
- 10.1.1. Plasma Derived Factors
- 10.1.2. Recombinant Factors
- 10.1.3. Other Products
- 10.2. Market Analysis, Insights and Forecast - by Application
- 10.2.1. Hemoglobin Diosrders
- 10.2.2. Platelet Based Disorders
- 10.2.3. Plasma Disorders
- 10.2.4. Myeloproliferative Disorders
- 10.2.5. Genetic Hematology Disorders
- 10.2.6. Blood Cancers
- 10.2.7. Other Application
- 10.1. Market Analysis, Insights and Forecast - by Product Type
- 11. South America Bleeding Disorder Testing Market Analysis, Insights and Forecast, 2021-2033
- 11.1. Market Analysis, Insights and Forecast - by Product Type
- 11.1.1. Plasma Derived Factors
- 11.1.2. Recombinant Factors
- 11.1.3. Other Products
- 11.2. Market Analysis, Insights and Forecast - by Application
- 11.2.1. Hemoglobin Diosrders
- 11.2.2. Platelet Based Disorders
- 11.2.3. Plasma Disorders
- 11.2.4. Myeloproliferative Disorders
- 11.2.5. Genetic Hematology Disorders
- 11.2.6. Blood Cancers
- 11.2.7. Other Application
- 11.1. Market Analysis, Insights and Forecast - by Product Type
- 12. Competitive Analysis
- 12.1. Company Profiles
- 12.1.1 CSL Ltd
- 12.1.1.1. Company Overview
- 12.1.1.2. Products
- 12.1.1.3. Company Financials
- 12.1.1.4. SWOT Analysis
- 12.1.2 Bayer AG
- 12.1.2.1. Company Overview
- 12.1.2.2. Products
- 12.1.2.3. Company Financials
- 12.1.2.4. SWOT Analysis
- 12.1.3 Celgene Corporation
- 12.1.3.1. Company Overview
- 12.1.3.2. Products
- 12.1.3.3. Company Financials
- 12.1.3.4. SWOT Analysis
- 12.1.4 Sanofi
- 12.1.4.1. Company Overview
- 12.1.4.2. Products
- 12.1.4.3. Company Financials
- 12.1.4.4. SWOT Analysis
- 12.1.5 Amgen Inc
- 12.1.5.1. Company Overview
- 12.1.5.2. Products
- 12.1.5.3. Company Financials
- 12.1.5.4. SWOT Analysis
- 12.1.6 AstraZeneca Plc
- 12.1.6.1. Company Overview
- 12.1.6.2. Products
- 12.1.6.3. Company Financials
- 12.1.6.4. SWOT Analysis
- 12.1.7 Alexion Pharmaceuticals Inc
- 12.1.7.1. Company Overview
- 12.1.7.2. Products
- 12.1.7.3. Company Financials
- 12.1.7.4. SWOT Analysis
- 12.1.8 Takeda Pharmaceutical Company Limited (Shire Plc)
- 12.1.8.1. Company Overview
- 12.1.8.2. Products
- 12.1.8.3. Company Financials
- 12.1.8.4. SWOT Analysis
- 12.1.9 Novo Nordisk A/S
- 12.1.9.1. Company Overview
- 12.1.9.2. Products
- 12.1.9.3. Company Financials
- 12.1.9.4. SWOT Analysis
- 12.1.10 Pfizer Inc
- 12.1.10.1. Company Overview
- 12.1.10.2. Products
- 12.1.10.3. Company Financials
- 12.1.10.4. SWOT Analysis
- 12.1.1 CSL Ltd
- 12.2. Market Entropy
- 12.2.1 Company's Key Areas Served
- 12.2.2 Recent Developments
- 12.3. Company Market Share Analysis 2025
- 12.3.1 Top 5 Companies Market Share Analysis
- 12.3.2 Top 3 Companies Market Share Analysis
- 12.4. List of Potential Customers
- 13. Research Methodology
List of Figures
- Figure 1: Global Bleeding Disorder Testing Market Revenue Breakdown (billion, %) by Region 2025 & 2033
- Figure 2: Global Bleeding Disorder Testing Market Volume Breakdown (K Unit, %) by Region 2025 & 2033
- Figure 3: North America Bleeding Disorder Testing Market Revenue (billion), by Product Type 2025 & 2033
- Figure 4: North America Bleeding Disorder Testing Market Volume (K Unit), by Product Type 2025 & 2033
- Figure 5: North America Bleeding Disorder Testing Market Revenue Share (%), by Product Type 2025 & 2033
- Figure 6: North America Bleeding Disorder Testing Market Volume Share (%), by Product Type 2025 & 2033
- Figure 7: North America Bleeding Disorder Testing Market Revenue (billion), by Application 2025 & 2033
- Figure 8: North America Bleeding Disorder Testing Market Volume (K Unit), by Application 2025 & 2033
- Figure 9: North America Bleeding Disorder Testing Market Revenue Share (%), by Application 2025 & 2033
- Figure 10: North America Bleeding Disorder Testing Market Volume Share (%), by Application 2025 & 2033
- Figure 11: North America Bleeding Disorder Testing Market Revenue (billion), by Country 2025 & 2033
- Figure 12: North America Bleeding Disorder Testing Market Volume (K Unit), by Country 2025 & 2033
- Figure 13: North America Bleeding Disorder Testing Market Revenue Share (%), by Country 2025 & 2033
- Figure 14: North America Bleeding Disorder Testing Market Volume Share (%), by Country 2025 & 2033
- Figure 15: Europe Bleeding Disorder Testing Market Revenue (billion), by Product Type 2025 & 2033
- Figure 16: Europe Bleeding Disorder Testing Market Volume (K Unit), by Product Type 2025 & 2033
- Figure 17: Europe Bleeding Disorder Testing Market Revenue Share (%), by Product Type 2025 & 2033
- Figure 18: Europe Bleeding Disorder Testing Market Volume Share (%), by Product Type 2025 & 2033
- Figure 19: Europe Bleeding Disorder Testing Market Revenue (billion), by Application 2025 & 2033
- Figure 20: Europe Bleeding Disorder Testing Market Volume (K Unit), by Application 2025 & 2033
- Figure 21: Europe Bleeding Disorder Testing Market Revenue Share (%), by Application 2025 & 2033
- Figure 22: Europe Bleeding Disorder Testing Market Volume Share (%), by Application 2025 & 2033
- Figure 23: Europe Bleeding Disorder Testing Market Revenue (billion), by Country 2025 & 2033
- Figure 24: Europe Bleeding Disorder Testing Market Volume (K Unit), by Country 2025 & 2033
- Figure 25: Europe Bleeding Disorder Testing Market Revenue Share (%), by Country 2025 & 2033
- Figure 26: Europe Bleeding Disorder Testing Market Volume Share (%), by Country 2025 & 2033
- Figure 27: Asia Pacific Bleeding Disorder Testing Market Revenue (billion), by Product Type 2025 & 2033
- Figure 28: Asia Pacific Bleeding Disorder Testing Market Volume (K Unit), by Product Type 2025 & 2033
- Figure 29: Asia Pacific Bleeding Disorder Testing Market Revenue Share (%), by Product Type 2025 & 2033
- Figure 30: Asia Pacific Bleeding Disorder Testing Market Volume Share (%), by Product Type 2025 & 2033
- Figure 31: Asia Pacific Bleeding Disorder Testing Market Revenue (billion), by Application 2025 & 2033
- Figure 32: Asia Pacific Bleeding Disorder Testing Market Volume (K Unit), by Application 2025 & 2033
- Figure 33: Asia Pacific Bleeding Disorder Testing Market Revenue Share (%), by Application 2025 & 2033
- Figure 34: Asia Pacific Bleeding Disorder Testing Market Volume Share (%), by Application 2025 & 2033
- Figure 35: Asia Pacific Bleeding Disorder Testing Market Revenue (billion), by Country 2025 & 2033
- Figure 36: Asia Pacific Bleeding Disorder Testing Market Volume (K Unit), by Country 2025 & 2033
- Figure 37: Asia Pacific Bleeding Disorder Testing Market Revenue Share (%), by Country 2025 & 2033
- Figure 38: Asia Pacific Bleeding Disorder Testing Market Volume Share (%), by Country 2025 & 2033
- Figure 39: Middle East and Africa Bleeding Disorder Testing Market Revenue (billion), by Product Type 2025 & 2033
- Figure 40: Middle East and Africa Bleeding Disorder Testing Market Volume (K Unit), by Product Type 2025 & 2033
- Figure 41: Middle East and Africa Bleeding Disorder Testing Market Revenue Share (%), by Product Type 2025 & 2033
- Figure 42: Middle East and Africa Bleeding Disorder Testing Market Volume Share (%), by Product Type 2025 & 2033
- Figure 43: Middle East and Africa Bleeding Disorder Testing Market Revenue (billion), by Application 2025 & 2033
- Figure 44: Middle East and Africa Bleeding Disorder Testing Market Volume (K Unit), by Application 2025 & 2033
- Figure 45: Middle East and Africa Bleeding Disorder Testing Market Revenue Share (%), by Application 2025 & 2033
- Figure 46: Middle East and Africa Bleeding Disorder Testing Market Volume Share (%), by Application 2025 & 2033
- Figure 47: Middle East and Africa Bleeding Disorder Testing Market Revenue (billion), by Country 2025 & 2033
- Figure 48: Middle East and Africa Bleeding Disorder Testing Market Volume (K Unit), by Country 2025 & 2033
- Figure 49: Middle East and Africa Bleeding Disorder Testing Market Revenue Share (%), by Country 2025 & 2033
- Figure 50: Middle East and Africa Bleeding Disorder Testing Market Volume Share (%), by Country 2025 & 2033
- Figure 51: South America Bleeding Disorder Testing Market Revenue (billion), by Product Type 2025 & 2033
- Figure 52: South America Bleeding Disorder Testing Market Volume (K Unit), by Product Type 2025 & 2033
- Figure 53: South America Bleeding Disorder Testing Market Revenue Share (%), by Product Type 2025 & 2033
- Figure 54: South America Bleeding Disorder Testing Market Volume Share (%), by Product Type 2025 & 2033
- Figure 55: South America Bleeding Disorder Testing Market Revenue (billion), by Application 2025 & 2033
- Figure 56: South America Bleeding Disorder Testing Market Volume (K Unit), by Application 2025 & 2033
- Figure 57: South America Bleeding Disorder Testing Market Revenue Share (%), by Application 2025 & 2033
- Figure 58: South America Bleeding Disorder Testing Market Volume Share (%), by Application 2025 & 2033
- Figure 59: South America Bleeding Disorder Testing Market Revenue (billion), by Country 2025 & 2033
- Figure 60: South America Bleeding Disorder Testing Market Volume (K Unit), by Country 2025 & 2033
- Figure 61: South America Bleeding Disorder Testing Market Revenue Share (%), by Country 2025 & 2033
- Figure 62: South America Bleeding Disorder Testing Market Volume Share (%), by Country 2025 & 2033
List of Tables
- Table 1: Global Bleeding Disorder Testing Market Revenue billion Forecast, by Product Type 2020 & 2033
- Table 2: Global Bleeding Disorder Testing Market Volume K Unit Forecast, by Product Type 2020 & 2033
- Table 3: Global Bleeding Disorder Testing Market Revenue billion Forecast, by Application 2020 & 2033
- Table 4: Global Bleeding Disorder Testing Market Volume K Unit Forecast, by Application 2020 & 2033
- Table 5: Global Bleeding Disorder Testing Market Revenue billion Forecast, by Region 2020 & 2033
- Table 6: Global Bleeding Disorder Testing Market Volume K Unit Forecast, by Region 2020 & 2033
- Table 7: Global Bleeding Disorder Testing Market Revenue billion Forecast, by Product Type 2020 & 2033
- Table 8: Global Bleeding Disorder Testing Market Volume K Unit Forecast, by Product Type 2020 & 2033
- Table 9: Global Bleeding Disorder Testing Market Revenue billion Forecast, by Application 2020 & 2033
- Table 10: Global Bleeding Disorder Testing Market Volume K Unit Forecast, by Application 2020 & 2033
- Table 11: Global Bleeding Disorder Testing Market Revenue billion Forecast, by Country 2020 & 2033
- Table 12: Global Bleeding Disorder Testing Market Volume K Unit Forecast, by Country 2020 & 2033
- Table 13: United States Bleeding Disorder Testing Market Revenue (billion) Forecast, by Application 2020 & 2033
- Table 14: United States Bleeding Disorder Testing Market Volume (K Unit) Forecast, by Application 2020 & 2033
- Table 15: Canada Bleeding Disorder Testing Market Revenue (billion) Forecast, by Application 2020 & 2033
- Table 16: Canada Bleeding Disorder Testing Market Volume (K Unit) Forecast, by Application 2020 & 2033
- Table 17: Mexico Bleeding Disorder Testing Market Revenue (billion) Forecast, by Application 2020 & 2033
- Table 18: Mexico Bleeding Disorder Testing Market Volume (K Unit) Forecast, by Application 2020 & 2033
- Table 19: Global Bleeding Disorder Testing Market Revenue billion Forecast, by Product Type 2020 & 2033
- Table 20: Global Bleeding Disorder Testing Market Volume K Unit Forecast, by Product Type 2020 & 2033
- Table 21: Global Bleeding Disorder Testing Market Revenue billion Forecast, by Application 2020 & 2033
- Table 22: Global Bleeding Disorder Testing Market Volume K Unit Forecast, by Application 2020 & 2033
- Table 23: Global Bleeding Disorder Testing Market Revenue billion Forecast, by Country 2020 & 2033
- Table 24: Global Bleeding Disorder Testing Market Volume K Unit Forecast, by Country 2020 & 2033
- Table 25: Germany Bleeding Disorder Testing Market Revenue (billion) Forecast, by Application 2020 & 2033
- Table 26: Germany Bleeding Disorder Testing Market Volume (K Unit) Forecast, by Application 2020 & 2033
- Table 27: United Kingdom Bleeding Disorder Testing Market Revenue (billion) Forecast, by Application 2020 & 2033
- Table 28: United Kingdom Bleeding Disorder Testing Market Volume (K Unit) Forecast, by Application 2020 & 2033
- Table 29: France Bleeding Disorder Testing Market Revenue (billion) Forecast, by Application 2020 & 2033
- Table 30: France Bleeding Disorder Testing Market Volume (K Unit) Forecast, by Application 2020 & 2033
- Table 31: Italy Bleeding Disorder Testing Market Revenue (billion) Forecast, by Application 2020 & 2033
- Table 32: Italy Bleeding Disorder Testing Market Volume (K Unit) Forecast, by Application 2020 & 2033
- Table 33: Spain Bleeding Disorder Testing Market Revenue (billion) Forecast, by Application 2020 & 2033
- Table 34: Spain Bleeding Disorder Testing Market Volume (K Unit) Forecast, by Application 2020 & 2033
- Table 35: Rest of Europe Bleeding Disorder Testing Market Revenue (billion) Forecast, by Application 2020 & 2033
- Table 36: Rest of Europe Bleeding Disorder Testing Market Volume (K Unit) Forecast, by Application 2020 & 2033
- Table 37: Global Bleeding Disorder Testing Market Revenue billion Forecast, by Product Type 2020 & 2033
- Table 38: Global Bleeding Disorder Testing Market Volume K Unit Forecast, by Product Type 2020 & 2033
- Table 39: Global Bleeding Disorder Testing Market Revenue billion Forecast, by Application 2020 & 2033
- Table 40: Global Bleeding Disorder Testing Market Volume K Unit Forecast, by Application 2020 & 2033
- Table 41: Global Bleeding Disorder Testing Market Revenue billion Forecast, by Country 2020 & 2033
- Table 42: Global Bleeding Disorder Testing Market Volume K Unit Forecast, by Country 2020 & 2033
- Table 43: China Bleeding Disorder Testing Market Revenue (billion) Forecast, by Application 2020 & 2033
- Table 44: China Bleeding Disorder Testing Market Volume (K Unit) Forecast, by Application 2020 & 2033
- Table 45: Japan Bleeding Disorder Testing Market Revenue (billion) Forecast, by Application 2020 & 2033
- Table 46: Japan Bleeding Disorder Testing Market Volume (K Unit) Forecast, by Application 2020 & 2033
- Table 47: India Bleeding Disorder Testing Market Revenue (billion) Forecast, by Application 2020 & 2033
- Table 48: India Bleeding Disorder Testing Market Volume (K Unit) Forecast, by Application 2020 & 2033
- Table 49: Australia Bleeding Disorder Testing Market Revenue (billion) Forecast, by Application 2020 & 2033
- Table 50: Australia Bleeding Disorder Testing Market Volume (K Unit) Forecast, by Application 2020 & 2033
- Table 51: South Korea Bleeding Disorder Testing Market Revenue (billion) Forecast, by Application 2020 & 2033
- Table 52: South Korea Bleeding Disorder Testing Market Volume (K Unit) Forecast, by Application 2020 & 2033
- Table 53: Rest of Asia Pacific Bleeding Disorder Testing Market Revenue (billion) Forecast, by Application 2020 & 2033
- Table 54: Rest of Asia Pacific Bleeding Disorder Testing Market Volume (K Unit) Forecast, by Application 2020 & 2033
- Table 55: Global Bleeding Disorder Testing Market Revenue billion Forecast, by Product Type 2020 & 2033
- Table 56: Global Bleeding Disorder Testing Market Volume K Unit Forecast, by Product Type 2020 & 2033
- Table 57: Global Bleeding Disorder Testing Market Revenue billion Forecast, by Application 2020 & 2033
- Table 58: Global Bleeding Disorder Testing Market Volume K Unit Forecast, by Application 2020 & 2033
- Table 59: Global Bleeding Disorder Testing Market Revenue billion Forecast, by Country 2020 & 2033
- Table 60: Global Bleeding Disorder Testing Market Volume K Unit Forecast, by Country 2020 & 2033
- Table 61: GCC Bleeding Disorder Testing Market Revenue (billion) Forecast, by Application 2020 & 2033
- Table 62: GCC Bleeding Disorder Testing Market Volume (K Unit) Forecast, by Application 2020 & 2033
- Table 63: South Africa Bleeding Disorder Testing Market Revenue (billion) Forecast, by Application 2020 & 2033
- Table 64: South Africa Bleeding Disorder Testing Market Volume (K Unit) Forecast, by Application 2020 & 2033
- Table 65: Rest of Middle East and Africa Bleeding Disorder Testing Market Revenue (billion) Forecast, by Application 2020 & 2033
- Table 66: Rest of Middle East and Africa Bleeding Disorder Testing Market Volume (K Unit) Forecast, by Application 2020 & 2033
- Table 67: Global Bleeding Disorder Testing Market Revenue billion Forecast, by Product Type 2020 & 2033
- Table 68: Global Bleeding Disorder Testing Market Volume K Unit Forecast, by Product Type 2020 & 2033
- Table 69: Global Bleeding Disorder Testing Market Revenue billion Forecast, by Application 2020 & 2033
- Table 70: Global Bleeding Disorder Testing Market Volume K Unit Forecast, by Application 2020 & 2033
- Table 71: Global Bleeding Disorder Testing Market Revenue billion Forecast, by Country 2020 & 2033
- Table 72: Global Bleeding Disorder Testing Market Volume K Unit Forecast, by Country 2020 & 2033
- Table 73: Brazil Bleeding Disorder Testing Market Revenue (billion) Forecast, by Application 2020 & 2033
- Table 74: Brazil Bleeding Disorder Testing Market Volume (K Unit) Forecast, by Application 2020 & 2033
- Table 75: Argentina Bleeding Disorder Testing Market Revenue (billion) Forecast, by Application 2020 & 2033
- Table 76: Argentina Bleeding Disorder Testing Market Volume (K Unit) Forecast, by Application 2020 & 2033
- Table 77: Rest of South America Bleeding Disorder Testing Market Revenue (billion) Forecast, by Application 2020 & 2033
- Table 78: Rest of South America Bleeding Disorder Testing Market Volume (K Unit) Forecast, by Application 2020 & 2033
Frequently Asked Questions
1. What is the projected Compound Annual Growth Rate (CAGR) of the Bleeding Disorder Testing Market?
The projected CAGR is approximately 7.2%.
2. Which companies are prominent players in the Bleeding Disorder Testing Market?
Key companies in the market include CSL Ltd, Bayer AG, Celgene Corporation, Sanofi, Amgen Inc, AstraZeneca Plc, Alexion Pharmaceuticals Inc, Takeda Pharmaceutical Company Limited (Shire Plc), Novo Nordisk A/S, Pfizer Inc.
3. What are the main segments of the Bleeding Disorder Testing Market?
The market segments include Product Type, Application.
4. Can you provide details about the market size?
The market size is estimated to be USD 109.2 billion as of 2022.
5. What are some drivers contributing to market growth?
; Rising Prevalence of Various Blood Disorders; Increasing Investment in R&D for Advance Treatment Options.
6. What are the notable trends driving market growth?
Recombinant Factors Segment is Expected to Hold a Significant Market Share in the Blood Disorder Therapeutics Market.
7. Are there any restraints impacting market growth?
; High Cost of Treatment; Stringent Regulations Norms.
8. Can you provide examples of recent developments in the market?
N/A
9. What pricing options are available for accessing the report?
Pricing options include single-user, multi-user, and enterprise licenses priced at USD 4750, USD 5250, and USD 8750 respectively.
10. Is the market size provided in terms of value or volume?
The market size is provided in terms of value, measured in billion and volume, measured in K Unit.
11. Are there any specific market keywords associated with the report?
Yes, the market keyword associated with the report is "Bleeding Disorder Testing Market," which aids in identifying and referencing the specific market segment covered.
12. How do I determine which pricing option suits my needs best?
The pricing options vary based on user requirements and access needs. Individual users may opt for single-user licenses, while businesses requiring broader access may choose multi-user or enterprise licenses for cost-effective access to the report.
13. Are there any additional resources or data provided in the Bleeding Disorder Testing Market report?
While the report offers comprehensive insights, it's advisable to review the specific contents or supplementary materials provided to ascertain if additional resources or data are available.
14. How can I stay updated on further developments or reports in the Bleeding Disorder Testing Market?
To stay informed about further developments, trends, and reports in the Bleeding Disorder Testing Market, consider subscribing to industry newsletters, following relevant companies and organizations, or regularly checking reputable industry news sources and publications.
Methodology
Step 1 - Identification of Relevant Samples Size from Population Database


Step 2 - Approaches for Defining Global Market Size (Value, Volume* & Price*)

Note*: In applicable scenarios
Step 3 - Data Sources
Primary Research
- Web Analytics
- Survey Reports
- Research Institute
- Latest Research Reports
- Opinion Leaders
Secondary Research
- Annual Reports
- White Paper
- Latest Press Release
- Industry Association
- Paid Database
- Investor Presentations

Step 4 - Data Triangulation
Involves using different sources of information in order to increase the validity of a study
These sources are likely to be stakeholders in a program - participants, other researchers, program staff, other community members, and so on.
Then we put all data in single framework & apply various statistical tools to find out the dynamic on the market.
During the analysis stage, feedback from the stakeholder groups would be compared to determine areas of agreement as well as areas of divergence