


Key Insights
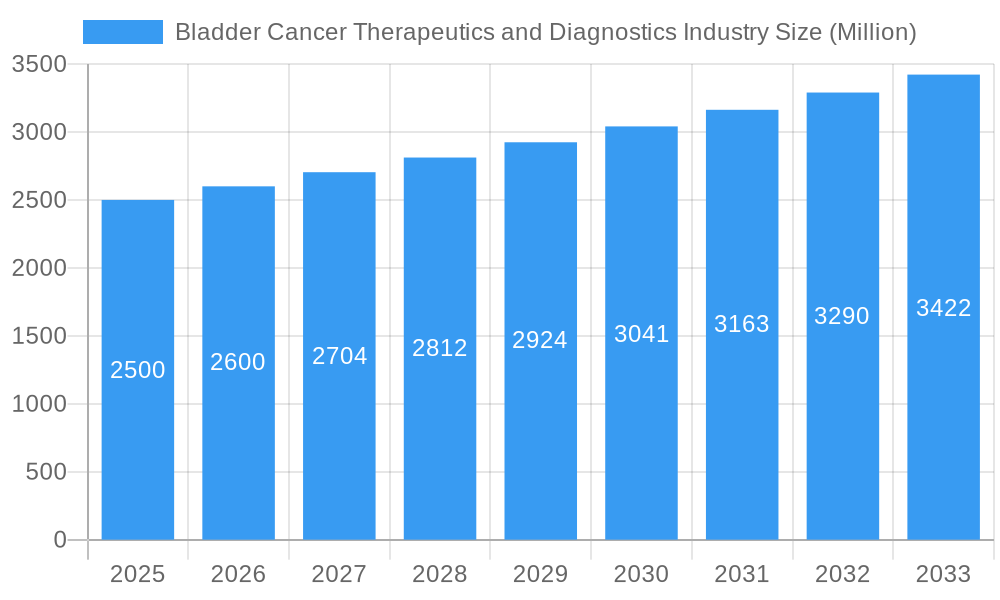
The global bladder cancer therapeutics and diagnostics market is poised for significant expansion, projecting a Compound Annual Growth Rate (CAGR) of 7.1%. This upward trend is propelled by several key factors, including the escalating global prevalence of bladder cancer, particularly transitional cell carcinoma. Advancements in targeted therapies, immunotherapies, and diagnostic technologies are enhancing treatment efficacy and early detection capabilities, thereby stimulating market growth. The aging global population, a demographic associated with increased bladder cancer risk, further contributes to this expansion. Additionally, heightened healthcare investments and amplified awareness initiatives focused on early diagnosis and prompt treatment are positively influencing market dynamics. Nevertheless, challenges such as the high cost of advanced treatments and diagnostic procedures, alongside treatment complexities, may impede market penetration. Furthermore, potential adverse effects associated with certain therapies could influence their widespread adoption.

Bladder Cancer Therapeutics and Diagnostics Industry Market Size (In Billion)

Market segmentation highlights therapeutic agents for transitional cell bladder cancer as a dominant segment, followed by those for squamous cell bladder cancer. The diagnostics segment demonstrates robust growth potential, driven by the increasing integration of minimally invasive techniques and sophisticated imaging modalities for precise disease characterization. Geographically, North America and Europe currently lead the market, underpinned by their advanced healthcare infrastructures and higher adoption rates of advanced treatment protocols. However, the Asia-Pacific region is anticipated to experience substantial growth, fueled by rising awareness, improving healthcare infrastructure, and an increasing incidence of bladder cancer. Leading market players, including Novartis, Merck, and Roche, are spearheading innovation through dedicated research and development efforts, fostering a competitive environment characterized by established therapies and novel, targeted treatments. The market's future trajectory will be shaped by continuous innovation in therapeutic and diagnostic modalities, alongside efforts to enhance affordability and accessibility of advanced care.
Bladder Cancer Therapeutics and Diagnostics Industry Company Market Share
Bladder Cancer Therapeutics and Diagnostics Industry: A Comprehensive Market Report (2019-2033)
This comprehensive report provides an in-depth analysis of the Bladder Cancer Therapeutics and Diagnostics industry, encompassing market dynamics, growth trends, competitive landscape, and future outlook. The study period covers 2019-2033, with 2025 as the base year and a forecast period of 2025-2033. The report segments the market by product (Therapeutics, Diagnostics), cancer type (Transitional Cell Bladder Cancer, Squamous Cell Bladder Cancer, Other Cancer Types), and key players including Novartis International AG, Merck & Co Inc, F Hoffmann-La Roche Ltd, Eli Lilly and Company, Johnson & Johnson (Janssen Pharmaceutical), Ameritech Diagnostic Reagent(Jiaxing)Co Ltd, Endo Pharmaceuticals Inc, Astellas Pharma Inc, Abbott Inc, Bristol-Myers Squibb Company, GlaxoSmithKline PLC, and Pfizer Inc. The report is crucial for industry professionals, investors, and researchers seeking a comprehensive understanding of this vital market.
Bladder Cancer Therapeutics and Diagnostics Industry Market Dynamics & Structure
The bladder cancer therapeutics and diagnostics market is characterized by a moderately concentrated landscape, with a few major pharmaceutical companies holding significant market share. Technological innovation, particularly in targeted therapies and minimally invasive diagnostics, is a key driver, alongside stringent regulatory frameworks that influence product approvals and market access. The market also witnesses significant M&A activity as larger players seek to expand their portfolios and enhance their competitive positions. The increasing prevalence of bladder cancer, coupled with an aging global population, fuels market growth.
- Market Concentration: The top 5 players hold approximately xx% of the global market share in 2025 (estimated).
- Technological Innovation: Advancements in immunotherapy, targeted therapy, and liquid biopsy diagnostics are driving innovation.
- Regulatory Framework: Stringent FDA and EMA approvals create barriers to entry, but ensure high product quality and safety.
- Competitive Substitutes: Alternative treatment modalities and diagnostic techniques influence market competition.
- End-User Demographics: Aging population and increasing prevalence of bladder cancer are major market growth factors.
- M&A Trends: An average of xx M&A deals per year were observed during the historical period (2019-2024).
Bladder Cancer Therapeutics and Diagnostics Industry Growth Trends & Insights
The global bladder cancer therapeutics and diagnostics market is experiencing robust growth, driven by a confluence of factors. The market size expanded from xx million units in 2019 to an estimated xx million units in 2025, exhibiting a CAGR of xx% during the historical period. This growth is fueled by increasing prevalence of bladder cancer, rising healthcare expenditure, technological advancements in diagnostics and therapeutics, and growing awareness amongst patients. The adoption rate of novel therapies and diagnostic tools is also increasing steadily. Technological disruptions, particularly in areas like immunotherapy and precision medicine, continue to reshape the landscape, leading to improved treatment outcomes and reduced healthcare costs. Consumer behavior shifts towards early detection and personalized medicine further contribute to the market's expansion. The forecast period (2025-2033) anticipates sustained growth, with a projected CAGR of xx%. Market penetration of advanced therapies remains relatively low, indicating substantial future growth potential.
Dominant Regions, Countries, or Segments in Bladder Cancer Therapeutics and Diagnostics Industry
North America currently dominates the bladder cancer therapeutics and diagnostics market, followed by Europe. This dominance is attributed to factors such as high healthcare expenditure, advanced healthcare infrastructure, and early adoption of innovative technologies. Within the product segments, Therapeutics holds a larger market share compared to Diagnostics in 2025, largely due to the high cost and widespread usage of various treatments. Among cancer types, Transitional Cell Bladder Cancer accounts for the significant majority of the market due to its higher prevalence.
- Key Drivers in North America: High per capita healthcare expenditure, advanced medical infrastructure, and early adoption of new technologies.
- Key Drivers in Europe: Well-established healthcare systems and increasing government funding for cancer research.
- Market Share: North America holds an estimated xx% market share in 2025 (estimated), while Europe holds xx% (estimated).
- Growth Potential: Emerging markets in Asia-Pacific show significant growth potential driven by rising healthcare awareness and improving healthcare infrastructure.
Bladder Cancer Therapeutics and Diagnostics Industry Product Landscape
The bladder cancer therapeutics market offers a diverse range of treatment options, including chemotherapy, immunotherapy, targeted therapy, and surgery. Diagnostic tools encompass cytology, imaging techniques (CT scans, MRI), and increasingly, liquid biopsies offering minimally invasive and more precise diagnosis. Recent innovations focus on improving efficacy, reducing side effects, and enhancing early detection capabilities. Key selling propositions include improved patient outcomes, reduced treatment time, and enhanced diagnostic accuracy. Technological advancements like next-generation sequencing and artificial intelligence are further transforming the product landscape.
Key Drivers, Barriers & Challenges in Bladder Cancer Therapeutics and Diagnostics Industry
Key Drivers:
- Increasing prevalence of bladder cancer globally.
- Technological advancements in targeted therapies and diagnostics.
- Rising healthcare expenditure and insurance coverage.
- Growing awareness and early detection initiatives.
Key Challenges & Restraints:
- High cost of innovative therapies limiting accessibility.
- Stringent regulatory pathways delaying product approvals.
- Competition among established and emerging players.
- Supply chain disruptions impacting availability of treatment modalities.
Emerging Opportunities in Bladder Cancer Therapeutics and Diagnostics Industry
- Development and commercialization of personalized medicine approaches.
- Expansion into emerging markets with unmet needs.
- Exploration of novel therapeutic targets for improved treatment efficacy.
- Development of minimally invasive and cost-effective diagnostic tools.
Growth Accelerators in the Bladder Cancer Therapeutics and Diagnostics Industry
Strategic partnerships between pharmaceutical companies and research institutions are accelerating innovation. Technological breakthroughs in immunotherapy, targeted therapy, and liquid biopsy diagnostics are driving growth. Expansion into emerging markets with high unmet medical needs provides significant growth opportunities. Furthermore, government initiatives supporting cancer research and improved healthcare infrastructure in developing nations significantly contribute to market expansion.
Key Players Shaping the Bladder Cancer Therapeutics and Diagnostics Industry Market
- Novartis International AG
- Merck & Co Inc
- F Hoffmann-La Roche Ltd
- Eli Lilly and Company
- Johnson & Johnson (Janssen Pharmaceutical)
- Ameritech Diagnostic Reagent(Jiaxing)Co Ltd
- Endo Pharmaceuticals Inc
- Astellas Pharma Inc
- Abbott Inc
- Bristol-Myers Squibb Company
- GlaxoSmithKline PLC
- Pfizer Inc
Notable Milestones in Bladder Cancer Therapeutics and Diagnostics Industry Sector
- July 2022: The FDA agreed to review ImmunityBio's BLA for N-803 for non-muscle-invasive bladder cancer (NMIBC).
- July 2022: Nanostics Inc. launched a clinical study for its ClarityDX Bladder diagnostic test.
In-Depth Bladder Cancer Therapeutics and Diagnostics Industry Market Outlook
The bladder cancer therapeutics and diagnostics market is poised for significant growth, driven by continuous innovation in treatment modalities and diagnostics. The focus on personalized medicine, coupled with the expansion into emerging markets, presents significant opportunities for market players. Strategic partnerships and investments in research and development will further fuel market expansion in the coming years, creating a dynamic and competitive landscape.
Bladder Cancer Therapeutics and Diagnostics Industry Segmentation
-
1. Product
-
1.1. Therapeutics
- 1.1.1. Chemotherapy
- 1.1.2. Immunotherapy
- 1.1.3. Other Therapeuticss
-
1.2. Diagnostics
- 1.2.1. Cystoscopy
- 1.2.2. Bladder Ultrasound
- 1.2.3. Urinalysis
- 1.2.4. Other Diagnostics
-
1.1. Therapeutics
-
2. Cancer Type
- 2.1. Transitional Cell Bladder Cancer
- 2.2. Squamous Cell Bladder Cancer
- 2.3. Other Cancer Types
Bladder Cancer Therapeutics and Diagnostics Industry Segmentation By Geography
-
1. North America
- 1.1. United States
- 1.2. Canada
- 1.3. Mexico
-
2. Europe
- 2.1. Germany
- 2.2. United Kingdom
- 2.3. France
- 2.4. Italy
- 2.5. Spain
- 2.6. Rest of Europe
-
3. Asia Pacific
- 3.1. China
- 3.2. Japan
- 3.3. India
- 3.4. Australia
- 3.5. South Korea
- 3.6. Rest of Asia Pacific
-
4. Middle East and Africa
- 4.1. GCC
- 4.2. South Africa
- 4.3. Rest of Middle East and Africa
-
5. South America
- 5.1. Brazil
- 5.2. Argentina
- 5.3. Rest of South America

Bladder Cancer Therapeutics and Diagnostics Industry Regional Market Share
Geographic Coverage of Bladder Cancer Therapeutics and Diagnostics Industry
Bladder Cancer Therapeutics and Diagnostics Industry REPORT HIGHLIGHTS
| Aspects | Details |
|---|---|
| Study Period | 2020-2034 |
| Base Year | 2025 |
| Estimated Year | 2026 |
| Forecast Period | 2026-2034 |
| Historical Period | 2020-2025 |
| Growth Rate | CAGR of 7.1% from 2020-2034 |
| Segmentation |
|
Table of Contents
- 1. Introduction
- 1.1. Research Scope
- 1.2. Market Segmentation
- 1.3. Research Methodology
- 1.4. Definitions and Assumptions
- 2. Executive Summary
- 2.1. Introduction
- 3. Market Dynamics
- 3.1. Introduction
- 3.2. Market Drivers
- 3.2.1. Increasing Awareness on Bladder Diseases and Available Therapies; Increasing Healthcare Expenditure; Increasing Burden of Bladder Cancer
- 3.3. Market Restrains
- 3.3.1. Rise in the Number of Patent Expiration and Increased Use of Generic Drugs; Asymptomatic Nature of the Disease
- 3.4. Market Trends
- 3.4.1. Cystoscopy is Anticipated to be the Dominant Segment in Studied Market Over the Forecast Period
- 4. Market Factor Analysis
- 4.1. Porters Five Forces
- 4.2. Supply/Value Chain
- 4.3. PESTEL analysis
- 4.4. Market Entropy
- 4.5. Patent/Trademark Analysis
- 5. Global Bladder Cancer Therapeutics and Diagnostics Industry Analysis, Insights and Forecast, 2020-2032
- 5.1. Market Analysis, Insights and Forecast - by Product
- 5.1.1. Therapeutics
- 5.1.1.1. Chemotherapy
- 5.1.1.2. Immunotherapy
- 5.1.1.3. Other Therapeuticss
- 5.1.2. Diagnostics
- 5.1.2.1. Cystoscopy
- 5.1.2.2. Bladder Ultrasound
- 5.1.2.3. Urinalysis
- 5.1.2.4. Other Diagnostics
- 5.1.1. Therapeutics
- 5.2. Market Analysis, Insights and Forecast - by Cancer Type
- 5.2.1. Transitional Cell Bladder Cancer
- 5.2.2. Squamous Cell Bladder Cancer
- 5.2.3. Other Cancer Types
- 5.3. Market Analysis, Insights and Forecast - by Region
- 5.3.1. North America
- 5.3.2. Europe
- 5.3.3. Asia Pacific
- 5.3.4. Middle East and Africa
- 5.3.5. South America
- 5.1. Market Analysis, Insights and Forecast - by Product
- 6. North America Bladder Cancer Therapeutics and Diagnostics Industry Analysis, Insights and Forecast, 2020-2032
- 6.1. Market Analysis, Insights and Forecast - by Product
- 6.1.1. Therapeutics
- 6.1.1.1. Chemotherapy
- 6.1.1.2. Immunotherapy
- 6.1.1.3. Other Therapeuticss
- 6.1.2. Diagnostics
- 6.1.2.1. Cystoscopy
- 6.1.2.2. Bladder Ultrasound
- 6.1.2.3. Urinalysis
- 6.1.2.4. Other Diagnostics
- 6.1.1. Therapeutics
- 6.2. Market Analysis, Insights and Forecast - by Cancer Type
- 6.2.1. Transitional Cell Bladder Cancer
- 6.2.2. Squamous Cell Bladder Cancer
- 6.2.3. Other Cancer Types
- 6.1. Market Analysis, Insights and Forecast - by Product
- 7. Europe Bladder Cancer Therapeutics and Diagnostics Industry Analysis, Insights and Forecast, 2020-2032
- 7.1. Market Analysis, Insights and Forecast - by Product
- 7.1.1. Therapeutics
- 7.1.1.1. Chemotherapy
- 7.1.1.2. Immunotherapy
- 7.1.1.3. Other Therapeuticss
- 7.1.2. Diagnostics
- 7.1.2.1. Cystoscopy
- 7.1.2.2. Bladder Ultrasound
- 7.1.2.3. Urinalysis
- 7.1.2.4. Other Diagnostics
- 7.1.1. Therapeutics
- 7.2. Market Analysis, Insights and Forecast - by Cancer Type
- 7.2.1. Transitional Cell Bladder Cancer
- 7.2.2. Squamous Cell Bladder Cancer
- 7.2.3. Other Cancer Types
- 7.1. Market Analysis, Insights and Forecast - by Product
- 8. Asia Pacific Bladder Cancer Therapeutics and Diagnostics Industry Analysis, Insights and Forecast, 2020-2032
- 8.1. Market Analysis, Insights and Forecast - by Product
- 8.1.1. Therapeutics
- 8.1.1.1. Chemotherapy
- 8.1.1.2. Immunotherapy
- 8.1.1.3. Other Therapeuticss
- 8.1.2. Diagnostics
- 8.1.2.1. Cystoscopy
- 8.1.2.2. Bladder Ultrasound
- 8.1.2.3. Urinalysis
- 8.1.2.4. Other Diagnostics
- 8.1.1. Therapeutics
- 8.2. Market Analysis, Insights and Forecast - by Cancer Type
- 8.2.1. Transitional Cell Bladder Cancer
- 8.2.2. Squamous Cell Bladder Cancer
- 8.2.3. Other Cancer Types
- 8.1. Market Analysis, Insights and Forecast - by Product
- 9. Middle East and Africa Bladder Cancer Therapeutics and Diagnostics Industry Analysis, Insights and Forecast, 2020-2032
- 9.1. Market Analysis, Insights and Forecast - by Product
- 9.1.1. Therapeutics
- 9.1.1.1. Chemotherapy
- 9.1.1.2. Immunotherapy
- 9.1.1.3. Other Therapeuticss
- 9.1.2. Diagnostics
- 9.1.2.1. Cystoscopy
- 9.1.2.2. Bladder Ultrasound
- 9.1.2.3. Urinalysis
- 9.1.2.4. Other Diagnostics
- 9.1.1. Therapeutics
- 9.2. Market Analysis, Insights and Forecast - by Cancer Type
- 9.2.1. Transitional Cell Bladder Cancer
- 9.2.2. Squamous Cell Bladder Cancer
- 9.2.3. Other Cancer Types
- 9.1. Market Analysis, Insights and Forecast - by Product
- 10. South America Bladder Cancer Therapeutics and Diagnostics Industry Analysis, Insights and Forecast, 2020-2032
- 10.1. Market Analysis, Insights and Forecast - by Product
- 10.1.1. Therapeutics
- 10.1.1.1. Chemotherapy
- 10.1.1.2. Immunotherapy
- 10.1.1.3. Other Therapeuticss
- 10.1.2. Diagnostics
- 10.1.2.1. Cystoscopy
- 10.1.2.2. Bladder Ultrasound
- 10.1.2.3. Urinalysis
- 10.1.2.4. Other Diagnostics
- 10.1.1. Therapeutics
- 10.2. Market Analysis, Insights and Forecast - by Cancer Type
- 10.2.1. Transitional Cell Bladder Cancer
- 10.2.2. Squamous Cell Bladder Cancer
- 10.2.3. Other Cancer Types
- 10.1. Market Analysis, Insights and Forecast - by Product
- 11. Competitive Analysis
- 11.1. Global Market Share Analysis 2025
- 11.2. Company Profiles
- 11.2.1 Novartis International AG
- 11.2.1.1. Overview
- 11.2.1.2. Products
- 11.2.1.3. SWOT Analysis
- 11.2.1.4. Recent Developments
- 11.2.1.5. Financials (Based on Availability)
- 11.2.2 Merck & Co Inc
- 11.2.2.1. Overview
- 11.2.2.2. Products
- 11.2.2.3. SWOT Analysis
- 11.2.2.4. Recent Developments
- 11.2.2.5. Financials (Based on Availability)
- 11.2.3 F Hoffmann-La Roche Ltd
- 11.2.3.1. Overview
- 11.2.3.2. Products
- 11.2.3.3. SWOT Analysis
- 11.2.3.4. Recent Developments
- 11.2.3.5. Financials (Based on Availability)
- 11.2.4 Eli Lilly and Company
- 11.2.4.1. Overview
- 11.2.4.2. Products
- 11.2.4.3. SWOT Analysis
- 11.2.4.4. Recent Developments
- 11.2.4.5. Financials (Based on Availability)
- 11.2.5 Johnson & Johnson (Janssen Pharmaceutical)
- 11.2.5.1. Overview
- 11.2.5.2. Products
- 11.2.5.3. SWOT Analysis
- 11.2.5.4. Recent Developments
- 11.2.5.5. Financials (Based on Availability)
- 11.2.6 Ameritech Diagnostic Reagent(Jiaxing)Co Ltd
- 11.2.6.1. Overview
- 11.2.6.2. Products
- 11.2.6.3. SWOT Analysis
- 11.2.6.4. Recent Developments
- 11.2.6.5. Financials (Based on Availability)
- 11.2.7 Endo Pharmaceuticals Inc
- 11.2.7.1. Overview
- 11.2.7.2. Products
- 11.2.7.3. SWOT Analysis
- 11.2.7.4. Recent Developments
- 11.2.7.5. Financials (Based on Availability)
- 11.2.8 Astellas Pharma Inc
- 11.2.8.1. Overview
- 11.2.8.2. Products
- 11.2.8.3. SWOT Analysis
- 11.2.8.4. Recent Developments
- 11.2.8.5. Financials (Based on Availability)
- 11.2.9 Abbott Inc
- 11.2.9.1. Overview
- 11.2.9.2. Products
- 11.2.9.3. SWOT Analysis
- 11.2.9.4. Recent Developments
- 11.2.9.5. Financials (Based on Availability)
- 11.2.10 Bristol-Myers Squibb Company
- 11.2.10.1. Overview
- 11.2.10.2. Products
- 11.2.10.3. SWOT Analysis
- 11.2.10.4. Recent Developments
- 11.2.10.5. Financials (Based on Availability)
- 11.2.11 GlaxoSmithKline PLC
- 11.2.11.1. Overview
- 11.2.11.2. Products
- 11.2.11.3. SWOT Analysis
- 11.2.11.4. Recent Developments
- 11.2.11.5. Financials (Based on Availability)
- 11.2.12 Pfizer Inc
- 11.2.12.1. Overview
- 11.2.12.2. Products
- 11.2.12.3. SWOT Analysis
- 11.2.12.4. Recent Developments
- 11.2.12.5. Financials (Based on Availability)
- 11.2.1 Novartis International AG
List of Figures
- Figure 1: Global Bladder Cancer Therapeutics and Diagnostics Industry Revenue Breakdown (million, %) by Region 2025 & 2033
- Figure 2: Global Bladder Cancer Therapeutics and Diagnostics Industry Volume Breakdown (K Unit, %) by Region 2025 & 2033
- Figure 3: North America Bladder Cancer Therapeutics and Diagnostics Industry Revenue (million), by Product 2025 & 2033
- Figure 4: North America Bladder Cancer Therapeutics and Diagnostics Industry Volume (K Unit), by Product 2025 & 2033
- Figure 5: North America Bladder Cancer Therapeutics and Diagnostics Industry Revenue Share (%), by Product 2025 & 2033
- Figure 6: North America Bladder Cancer Therapeutics and Diagnostics Industry Volume Share (%), by Product 2025 & 2033
- Figure 7: North America Bladder Cancer Therapeutics and Diagnostics Industry Revenue (million), by Cancer Type 2025 & 2033
- Figure 8: North America Bladder Cancer Therapeutics and Diagnostics Industry Volume (K Unit), by Cancer Type 2025 & 2033
- Figure 9: North America Bladder Cancer Therapeutics and Diagnostics Industry Revenue Share (%), by Cancer Type 2025 & 2033
- Figure 10: North America Bladder Cancer Therapeutics and Diagnostics Industry Volume Share (%), by Cancer Type 2025 & 2033
- Figure 11: North America Bladder Cancer Therapeutics and Diagnostics Industry Revenue (million), by Country 2025 & 2033
- Figure 12: North America Bladder Cancer Therapeutics and Diagnostics Industry Volume (K Unit), by Country 2025 & 2033
- Figure 13: North America Bladder Cancer Therapeutics and Diagnostics Industry Revenue Share (%), by Country 2025 & 2033
- Figure 14: North America Bladder Cancer Therapeutics and Diagnostics Industry Volume Share (%), by Country 2025 & 2033
- Figure 15: Europe Bladder Cancer Therapeutics and Diagnostics Industry Revenue (million), by Product 2025 & 2033
- Figure 16: Europe Bladder Cancer Therapeutics and Diagnostics Industry Volume (K Unit), by Product 2025 & 2033
- Figure 17: Europe Bladder Cancer Therapeutics and Diagnostics Industry Revenue Share (%), by Product 2025 & 2033
- Figure 18: Europe Bladder Cancer Therapeutics and Diagnostics Industry Volume Share (%), by Product 2025 & 2033
- Figure 19: Europe Bladder Cancer Therapeutics and Diagnostics Industry Revenue (million), by Cancer Type 2025 & 2033
- Figure 20: Europe Bladder Cancer Therapeutics and Diagnostics Industry Volume (K Unit), by Cancer Type 2025 & 2033
- Figure 21: Europe Bladder Cancer Therapeutics and Diagnostics Industry Revenue Share (%), by Cancer Type 2025 & 2033
- Figure 22: Europe Bladder Cancer Therapeutics and Diagnostics Industry Volume Share (%), by Cancer Type 2025 & 2033
- Figure 23: Europe Bladder Cancer Therapeutics and Diagnostics Industry Revenue (million), by Country 2025 & 2033
- Figure 24: Europe Bladder Cancer Therapeutics and Diagnostics Industry Volume (K Unit), by Country 2025 & 2033
- Figure 25: Europe Bladder Cancer Therapeutics and Diagnostics Industry Revenue Share (%), by Country 2025 & 2033
- Figure 26: Europe Bladder Cancer Therapeutics and Diagnostics Industry Volume Share (%), by Country 2025 & 2033
- Figure 27: Asia Pacific Bladder Cancer Therapeutics and Diagnostics Industry Revenue (million), by Product 2025 & 2033
- Figure 28: Asia Pacific Bladder Cancer Therapeutics and Diagnostics Industry Volume (K Unit), by Product 2025 & 2033
- Figure 29: Asia Pacific Bladder Cancer Therapeutics and Diagnostics Industry Revenue Share (%), by Product 2025 & 2033
- Figure 30: Asia Pacific Bladder Cancer Therapeutics and Diagnostics Industry Volume Share (%), by Product 2025 & 2033
- Figure 31: Asia Pacific Bladder Cancer Therapeutics and Diagnostics Industry Revenue (million), by Cancer Type 2025 & 2033
- Figure 32: Asia Pacific Bladder Cancer Therapeutics and Diagnostics Industry Volume (K Unit), by Cancer Type 2025 & 2033
- Figure 33: Asia Pacific Bladder Cancer Therapeutics and Diagnostics Industry Revenue Share (%), by Cancer Type 2025 & 2033
- Figure 34: Asia Pacific Bladder Cancer Therapeutics and Diagnostics Industry Volume Share (%), by Cancer Type 2025 & 2033
- Figure 35: Asia Pacific Bladder Cancer Therapeutics and Diagnostics Industry Revenue (million), by Country 2025 & 2033
- Figure 36: Asia Pacific Bladder Cancer Therapeutics and Diagnostics Industry Volume (K Unit), by Country 2025 & 2033
- Figure 37: Asia Pacific Bladder Cancer Therapeutics and Diagnostics Industry Revenue Share (%), by Country 2025 & 2033
- Figure 38: Asia Pacific Bladder Cancer Therapeutics and Diagnostics Industry Volume Share (%), by Country 2025 & 2033
- Figure 39: Middle East and Africa Bladder Cancer Therapeutics and Diagnostics Industry Revenue (million), by Product 2025 & 2033
- Figure 40: Middle East and Africa Bladder Cancer Therapeutics and Diagnostics Industry Volume (K Unit), by Product 2025 & 2033
- Figure 41: Middle East and Africa Bladder Cancer Therapeutics and Diagnostics Industry Revenue Share (%), by Product 2025 & 2033
- Figure 42: Middle East and Africa Bladder Cancer Therapeutics and Diagnostics Industry Volume Share (%), by Product 2025 & 2033
- Figure 43: Middle East and Africa Bladder Cancer Therapeutics and Diagnostics Industry Revenue (million), by Cancer Type 2025 & 2033
- Figure 44: Middle East and Africa Bladder Cancer Therapeutics and Diagnostics Industry Volume (K Unit), by Cancer Type 2025 & 2033
- Figure 45: Middle East and Africa Bladder Cancer Therapeutics and Diagnostics Industry Revenue Share (%), by Cancer Type 2025 & 2033
- Figure 46: Middle East and Africa Bladder Cancer Therapeutics and Diagnostics Industry Volume Share (%), by Cancer Type 2025 & 2033
- Figure 47: Middle East and Africa Bladder Cancer Therapeutics and Diagnostics Industry Revenue (million), by Country 2025 & 2033
- Figure 48: Middle East and Africa Bladder Cancer Therapeutics and Diagnostics Industry Volume (K Unit), by Country 2025 & 2033
- Figure 49: Middle East and Africa Bladder Cancer Therapeutics and Diagnostics Industry Revenue Share (%), by Country 2025 & 2033
- Figure 50: Middle East and Africa Bladder Cancer Therapeutics and Diagnostics Industry Volume Share (%), by Country 2025 & 2033
- Figure 51: South America Bladder Cancer Therapeutics and Diagnostics Industry Revenue (million), by Product 2025 & 2033
- Figure 52: South America Bladder Cancer Therapeutics and Diagnostics Industry Volume (K Unit), by Product 2025 & 2033
- Figure 53: South America Bladder Cancer Therapeutics and Diagnostics Industry Revenue Share (%), by Product 2025 & 2033
- Figure 54: South America Bladder Cancer Therapeutics and Diagnostics Industry Volume Share (%), by Product 2025 & 2033
- Figure 55: South America Bladder Cancer Therapeutics and Diagnostics Industry Revenue (million), by Cancer Type 2025 & 2033
- Figure 56: South America Bladder Cancer Therapeutics and Diagnostics Industry Volume (K Unit), by Cancer Type 2025 & 2033
- Figure 57: South America Bladder Cancer Therapeutics and Diagnostics Industry Revenue Share (%), by Cancer Type 2025 & 2033
- Figure 58: South America Bladder Cancer Therapeutics and Diagnostics Industry Volume Share (%), by Cancer Type 2025 & 2033
- Figure 59: South America Bladder Cancer Therapeutics and Diagnostics Industry Revenue (million), by Country 2025 & 2033
- Figure 60: South America Bladder Cancer Therapeutics and Diagnostics Industry Volume (K Unit), by Country 2025 & 2033
- Figure 61: South America Bladder Cancer Therapeutics and Diagnostics Industry Revenue Share (%), by Country 2025 & 2033
- Figure 62: South America Bladder Cancer Therapeutics and Diagnostics Industry Volume Share (%), by Country 2025 & 2033
List of Tables
- Table 1: Global Bladder Cancer Therapeutics and Diagnostics Industry Revenue million Forecast, by Product 2020 & 2033
- Table 2: Global Bladder Cancer Therapeutics and Diagnostics Industry Volume K Unit Forecast, by Product 2020 & 2033
- Table 3: Global Bladder Cancer Therapeutics and Diagnostics Industry Revenue million Forecast, by Cancer Type 2020 & 2033
- Table 4: Global Bladder Cancer Therapeutics and Diagnostics Industry Volume K Unit Forecast, by Cancer Type 2020 & 2033
- Table 5: Global Bladder Cancer Therapeutics and Diagnostics Industry Revenue million Forecast, by Region 2020 & 2033
- Table 6: Global Bladder Cancer Therapeutics and Diagnostics Industry Volume K Unit Forecast, by Region 2020 & 2033
- Table 7: Global Bladder Cancer Therapeutics and Diagnostics Industry Revenue million Forecast, by Product 2020 & 2033
- Table 8: Global Bladder Cancer Therapeutics and Diagnostics Industry Volume K Unit Forecast, by Product 2020 & 2033
- Table 9: Global Bladder Cancer Therapeutics and Diagnostics Industry Revenue million Forecast, by Cancer Type 2020 & 2033
- Table 10: Global Bladder Cancer Therapeutics and Diagnostics Industry Volume K Unit Forecast, by Cancer Type 2020 & 2033
- Table 11: Global Bladder Cancer Therapeutics and Diagnostics Industry Revenue million Forecast, by Country 2020 & 2033
- Table 12: Global Bladder Cancer Therapeutics and Diagnostics Industry Volume K Unit Forecast, by Country 2020 & 2033
- Table 13: United States Bladder Cancer Therapeutics and Diagnostics Industry Revenue (million) Forecast, by Application 2020 & 2033
- Table 14: United States Bladder Cancer Therapeutics and Diagnostics Industry Volume (K Unit) Forecast, by Application 2020 & 2033
- Table 15: Canada Bladder Cancer Therapeutics and Diagnostics Industry Revenue (million) Forecast, by Application 2020 & 2033
- Table 16: Canada Bladder Cancer Therapeutics and Diagnostics Industry Volume (K Unit) Forecast, by Application 2020 & 2033
- Table 17: Mexico Bladder Cancer Therapeutics and Diagnostics Industry Revenue (million) Forecast, by Application 2020 & 2033
- Table 18: Mexico Bladder Cancer Therapeutics and Diagnostics Industry Volume (K Unit) Forecast, by Application 2020 & 2033
- Table 19: Global Bladder Cancer Therapeutics and Diagnostics Industry Revenue million Forecast, by Product 2020 & 2033
- Table 20: Global Bladder Cancer Therapeutics and Diagnostics Industry Volume K Unit Forecast, by Product 2020 & 2033
- Table 21: Global Bladder Cancer Therapeutics and Diagnostics Industry Revenue million Forecast, by Cancer Type 2020 & 2033
- Table 22: Global Bladder Cancer Therapeutics and Diagnostics Industry Volume K Unit Forecast, by Cancer Type 2020 & 2033
- Table 23: Global Bladder Cancer Therapeutics and Diagnostics Industry Revenue million Forecast, by Country 2020 & 2033
- Table 24: Global Bladder Cancer Therapeutics and Diagnostics Industry Volume K Unit Forecast, by Country 2020 & 2033
- Table 25: Germany Bladder Cancer Therapeutics and Diagnostics Industry Revenue (million) Forecast, by Application 2020 & 2033
- Table 26: Germany Bladder Cancer Therapeutics and Diagnostics Industry Volume (K Unit) Forecast, by Application 2020 & 2033
- Table 27: United Kingdom Bladder Cancer Therapeutics and Diagnostics Industry Revenue (million) Forecast, by Application 2020 & 2033
- Table 28: United Kingdom Bladder Cancer Therapeutics and Diagnostics Industry Volume (K Unit) Forecast, by Application 2020 & 2033
- Table 29: France Bladder Cancer Therapeutics and Diagnostics Industry Revenue (million) Forecast, by Application 2020 & 2033
- Table 30: France Bladder Cancer Therapeutics and Diagnostics Industry Volume (K Unit) Forecast, by Application 2020 & 2033
- Table 31: Italy Bladder Cancer Therapeutics and Diagnostics Industry Revenue (million) Forecast, by Application 2020 & 2033
- Table 32: Italy Bladder Cancer Therapeutics and Diagnostics Industry Volume (K Unit) Forecast, by Application 2020 & 2033
- Table 33: Spain Bladder Cancer Therapeutics and Diagnostics Industry Revenue (million) Forecast, by Application 2020 & 2033
- Table 34: Spain Bladder Cancer Therapeutics and Diagnostics Industry Volume (K Unit) Forecast, by Application 2020 & 2033
- Table 35: Rest of Europe Bladder Cancer Therapeutics and Diagnostics Industry Revenue (million) Forecast, by Application 2020 & 2033
- Table 36: Rest of Europe Bladder Cancer Therapeutics and Diagnostics Industry Volume (K Unit) Forecast, by Application 2020 & 2033
- Table 37: Global Bladder Cancer Therapeutics and Diagnostics Industry Revenue million Forecast, by Product 2020 & 2033
- Table 38: Global Bladder Cancer Therapeutics and Diagnostics Industry Volume K Unit Forecast, by Product 2020 & 2033
- Table 39: Global Bladder Cancer Therapeutics and Diagnostics Industry Revenue million Forecast, by Cancer Type 2020 & 2033
- Table 40: Global Bladder Cancer Therapeutics and Diagnostics Industry Volume K Unit Forecast, by Cancer Type 2020 & 2033
- Table 41: Global Bladder Cancer Therapeutics and Diagnostics Industry Revenue million Forecast, by Country 2020 & 2033
- Table 42: Global Bladder Cancer Therapeutics and Diagnostics Industry Volume K Unit Forecast, by Country 2020 & 2033
- Table 43: China Bladder Cancer Therapeutics and Diagnostics Industry Revenue (million) Forecast, by Application 2020 & 2033
- Table 44: China Bladder Cancer Therapeutics and Diagnostics Industry Volume (K Unit) Forecast, by Application 2020 & 2033
- Table 45: Japan Bladder Cancer Therapeutics and Diagnostics Industry Revenue (million) Forecast, by Application 2020 & 2033
- Table 46: Japan Bladder Cancer Therapeutics and Diagnostics Industry Volume (K Unit) Forecast, by Application 2020 & 2033
- Table 47: India Bladder Cancer Therapeutics and Diagnostics Industry Revenue (million) Forecast, by Application 2020 & 2033
- Table 48: India Bladder Cancer Therapeutics and Diagnostics Industry Volume (K Unit) Forecast, by Application 2020 & 2033
- Table 49: Australia Bladder Cancer Therapeutics and Diagnostics Industry Revenue (million) Forecast, by Application 2020 & 2033
- Table 50: Australia Bladder Cancer Therapeutics and Diagnostics Industry Volume (K Unit) Forecast, by Application 2020 & 2033
- Table 51: South Korea Bladder Cancer Therapeutics and Diagnostics Industry Revenue (million) Forecast, by Application 2020 & 2033
- Table 52: South Korea Bladder Cancer Therapeutics and Diagnostics Industry Volume (K Unit) Forecast, by Application 2020 & 2033
- Table 53: Rest of Asia Pacific Bladder Cancer Therapeutics and Diagnostics Industry Revenue (million) Forecast, by Application 2020 & 2033
- Table 54: Rest of Asia Pacific Bladder Cancer Therapeutics and Diagnostics Industry Volume (K Unit) Forecast, by Application 2020 & 2033
- Table 55: Global Bladder Cancer Therapeutics and Diagnostics Industry Revenue million Forecast, by Product 2020 & 2033
- Table 56: Global Bladder Cancer Therapeutics and Diagnostics Industry Volume K Unit Forecast, by Product 2020 & 2033
- Table 57: Global Bladder Cancer Therapeutics and Diagnostics Industry Revenue million Forecast, by Cancer Type 2020 & 2033
- Table 58: Global Bladder Cancer Therapeutics and Diagnostics Industry Volume K Unit Forecast, by Cancer Type 2020 & 2033
- Table 59: Global Bladder Cancer Therapeutics and Diagnostics Industry Revenue million Forecast, by Country 2020 & 2033
- Table 60: Global Bladder Cancer Therapeutics and Diagnostics Industry Volume K Unit Forecast, by Country 2020 & 2033
- Table 61: GCC Bladder Cancer Therapeutics and Diagnostics Industry Revenue (million) Forecast, by Application 2020 & 2033
- Table 62: GCC Bladder Cancer Therapeutics and Diagnostics Industry Volume (K Unit) Forecast, by Application 2020 & 2033
- Table 63: South Africa Bladder Cancer Therapeutics and Diagnostics Industry Revenue (million) Forecast, by Application 2020 & 2033
- Table 64: South Africa Bladder Cancer Therapeutics and Diagnostics Industry Volume (K Unit) Forecast, by Application 2020 & 2033
- Table 65: Rest of Middle East and Africa Bladder Cancer Therapeutics and Diagnostics Industry Revenue (million) Forecast, by Application 2020 & 2033
- Table 66: Rest of Middle East and Africa Bladder Cancer Therapeutics and Diagnostics Industry Volume (K Unit) Forecast, by Application 2020 & 2033
- Table 67: Global Bladder Cancer Therapeutics and Diagnostics Industry Revenue million Forecast, by Product 2020 & 2033
- Table 68: Global Bladder Cancer Therapeutics and Diagnostics Industry Volume K Unit Forecast, by Product 2020 & 2033
- Table 69: Global Bladder Cancer Therapeutics and Diagnostics Industry Revenue million Forecast, by Cancer Type 2020 & 2033
- Table 70: Global Bladder Cancer Therapeutics and Diagnostics Industry Volume K Unit Forecast, by Cancer Type 2020 & 2033
- Table 71: Global Bladder Cancer Therapeutics and Diagnostics Industry Revenue million Forecast, by Country 2020 & 2033
- Table 72: Global Bladder Cancer Therapeutics and Diagnostics Industry Volume K Unit Forecast, by Country 2020 & 2033
- Table 73: Brazil Bladder Cancer Therapeutics and Diagnostics Industry Revenue (million) Forecast, by Application 2020 & 2033
- Table 74: Brazil Bladder Cancer Therapeutics and Diagnostics Industry Volume (K Unit) Forecast, by Application 2020 & 2033
- Table 75: Argentina Bladder Cancer Therapeutics and Diagnostics Industry Revenue (million) Forecast, by Application 2020 & 2033
- Table 76: Argentina Bladder Cancer Therapeutics and Diagnostics Industry Volume (K Unit) Forecast, by Application 2020 & 2033
- Table 77: Rest of South America Bladder Cancer Therapeutics and Diagnostics Industry Revenue (million) Forecast, by Application 2020 & 2033
- Table 78: Rest of South America Bladder Cancer Therapeutics and Diagnostics Industry Volume (K Unit) Forecast, by Application 2020 & 2033
Frequently Asked Questions
1. What is the projected Compound Annual Growth Rate (CAGR) of the Bladder Cancer Therapeutics and Diagnostics Industry?
The projected CAGR is approximately 7.1%.
2. Which companies are prominent players in the Bladder Cancer Therapeutics and Diagnostics Industry?
Key companies in the market include Novartis International AG, Merck & Co Inc, F Hoffmann-La Roche Ltd, Eli Lilly and Company, Johnson & Johnson (Janssen Pharmaceutical), Ameritech Diagnostic Reagent(Jiaxing)Co Ltd, Endo Pharmaceuticals Inc, Astellas Pharma Inc , Abbott Inc, Bristol-Myers Squibb Company, GlaxoSmithKline PLC, Pfizer Inc.
3. What are the main segments of the Bladder Cancer Therapeutics and Diagnostics Industry?
The market segments include Product, Cancer Type.
4. Can you provide details about the market size?
The market size is estimated to be USD 4065.1 million as of 2022.
5. What are some drivers contributing to market growth?
Increasing Awareness on Bladder Diseases and Available Therapies; Increasing Healthcare Expenditure; Increasing Burden of Bladder Cancer.
6. What are the notable trends driving market growth?
Cystoscopy is Anticipated to be the Dominant Segment in Studied Market Over the Forecast Period.
7. Are there any restraints impacting market growth?
Rise in the Number of Patent Expiration and Increased Use of Generic Drugs; Asymptomatic Nature of the Disease.
8. Can you provide examples of recent developments in the market?
In July 2022, The United States Food and Drug Administration (FDA) agreed to review ImmunityBio's Biologics License Application (BLA) for N-803 in patients with or without Ta or T1 illness who have non-muscle-invasive bladder cancer (NMIBC) carcinoma in situ (CIS).
9. What pricing options are available for accessing the report?
Pricing options include single-user, multi-user, and enterprise licenses priced at USD 4750, USD 5250, and USD 8750 respectively.
10. Is the market size provided in terms of value or volume?
The market size is provided in terms of value, measured in million and volume, measured in K Unit.
11. Are there any specific market keywords associated with the report?
Yes, the market keyword associated with the report is "Bladder Cancer Therapeutics and Diagnostics Industry," which aids in identifying and referencing the specific market segment covered.
12. How do I determine which pricing option suits my needs best?
The pricing options vary based on user requirements and access needs. Individual users may opt for single-user licenses, while businesses requiring broader access may choose multi-user or enterprise licenses for cost-effective access to the report.
13. Are there any additional resources or data provided in the Bladder Cancer Therapeutics and Diagnostics Industry report?
While the report offers comprehensive insights, it's advisable to review the specific contents or supplementary materials provided to ascertain if additional resources or data are available.
14. How can I stay updated on further developments or reports in the Bladder Cancer Therapeutics and Diagnostics Industry?
To stay informed about further developments, trends, and reports in the Bladder Cancer Therapeutics and Diagnostics Industry, consider subscribing to industry newsletters, following relevant companies and organizations, or regularly checking reputable industry news sources and publications.
Methodology
Step 1 - Identification of Relevant Samples Size from Population Database


Step 2 - Approaches for Defining Global Market Size (Value, Volume* & Price*)

Note*: In applicable scenarios
Step 3 - Data Sources
Primary Research
- Web Analytics
- Survey Reports
- Research Institute
- Latest Research Reports
- Opinion Leaders
Secondary Research
- Annual Reports
- White Paper
- Latest Press Release
- Industry Association
- Paid Database
- Investor Presentations

Step 4 - Data Triangulation
Involves using different sources of information in order to increase the validity of a study
These sources are likely to be stakeholders in a program - participants, other researchers, program staff, other community members, and so on.
Then we put all data in single framework & apply various statistical tools to find out the dynamic on the market.
During the analysis stage, feedback from the stakeholder groups would be compared to determine areas of agreement as well as areas of divergence