
Key Insights
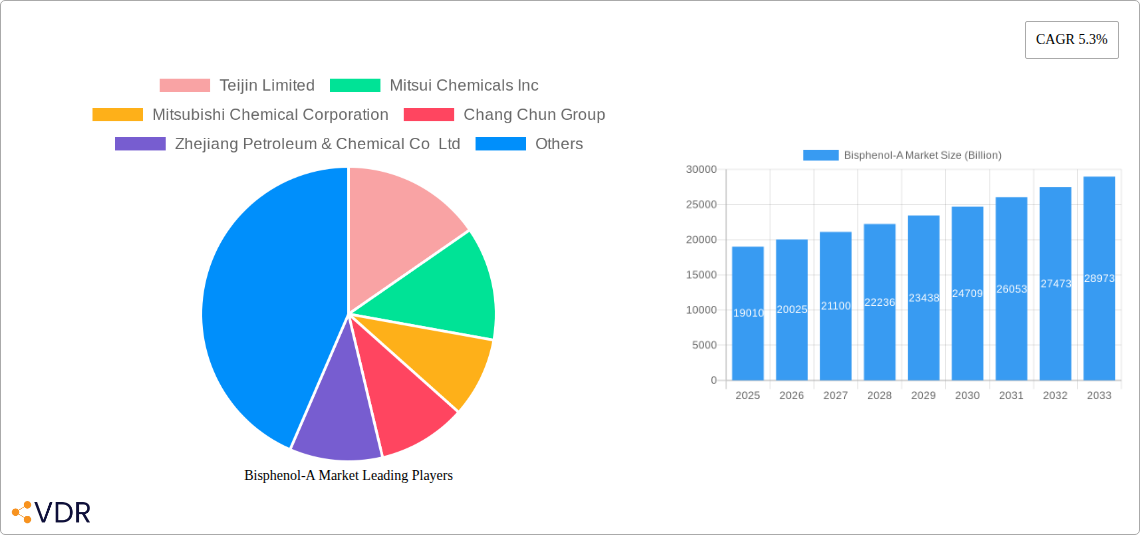
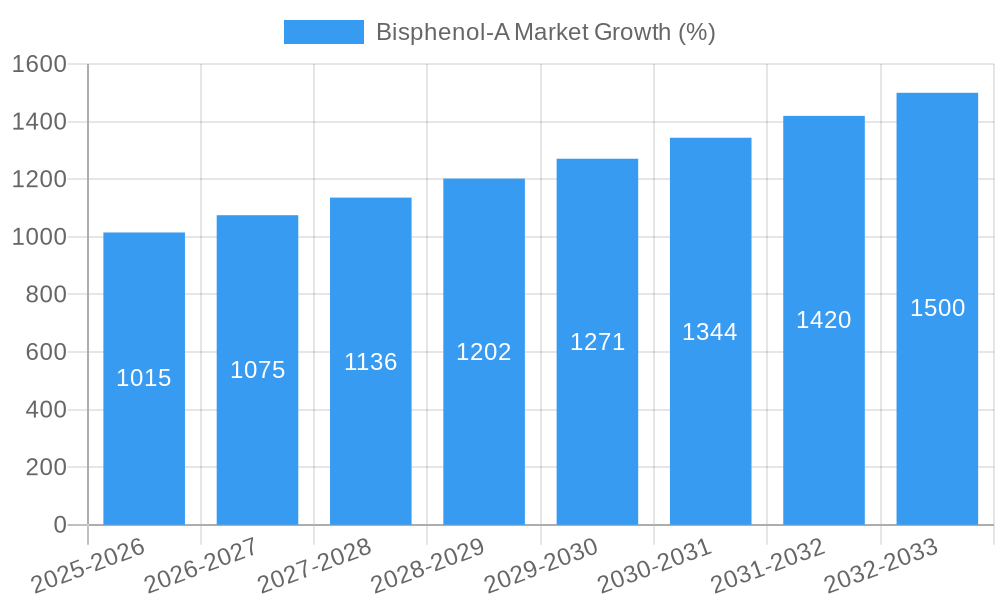
The Bisphenol-A (BPA) market, valued at $19.01 billion in 2025, is projected to experience robust growth, exhibiting a compound annual growth rate (CAGR) of 5.3% from 2025 to 2033. This expansion is driven by the increasing demand for BPA in various applications, particularly in the production of polycarbonate resins used in consumer electronics, automotive parts, and construction materials. The rising global population and expanding middle class, particularly in developing economies, fuel the demand for these products. Furthermore, advancements in BPA production technologies, leading to improved efficiency and reduced costs, are contributing to market growth. However, growing environmental concerns regarding BPA's potential endocrine-disrupting effects and increasing regulations restricting its use in certain products pose significant challenges to market expansion. This necessitates a shift towards sustainable alternatives and innovative applications that mitigate environmental risks. The market segmentation reveals that polycarbonate resins dominate the application landscape, followed by epoxy and unsaturated polyester resins. Key players like Teijin Limited, Mitsui Chemicals Inc., and SABIC are strategically positioned to capitalize on market opportunities through product innovation, capacity expansion, and geographic diversification.
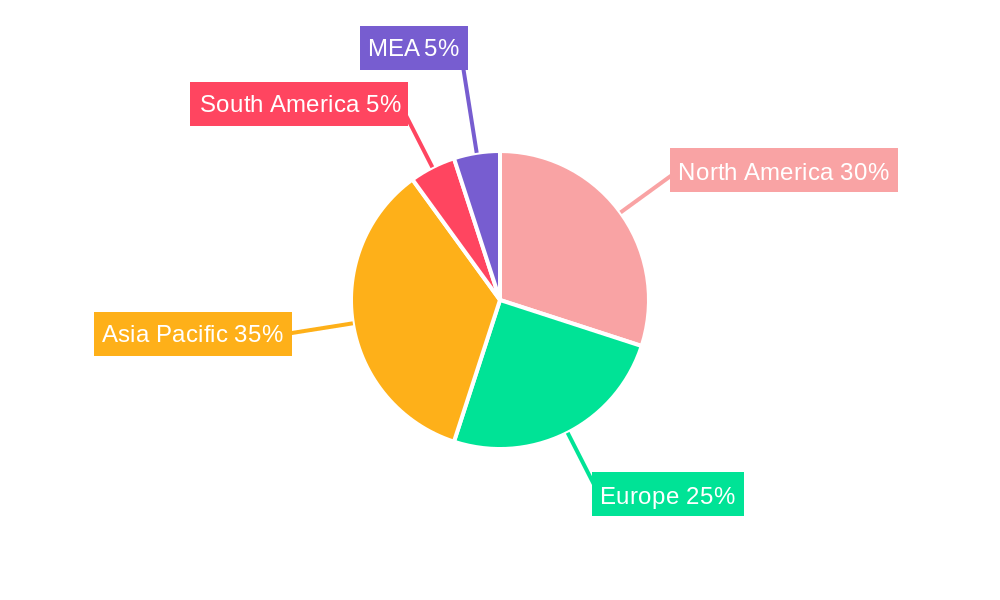
The geographical distribution of the BPA market is geographically diverse, with North America and Asia-Pacific representing significant market shares. The mature markets of North America and Europe are witnessing steady growth, driven by technological advancements and product innovation. However, rapidly developing economies in Asia-Pacific, particularly China and India, are expected to be key drivers of future growth due to increasing infrastructure development and industrialization. South America and the Middle East & Africa regions are also anticipated to experience modest growth, driven by rising consumer demand and government investments in infrastructure projects. Competition within the BPA market is intense, with established players competing on price, quality, and innovation. Future growth will depend on the industry's ability to address environmental concerns, develop sustainable alternatives, and cater to evolving consumer preferences.
Bisphenol-A (BPA) Market: A Comprehensive Report (2019-2033)
This in-depth report provides a comprehensive analysis of the global Bisphenol-A (BPA) market, encompassing market dynamics, growth trends, regional analysis, competitive landscape, and future outlook. The report covers the parent market of chemical resins and its child market of Bisphenol-A, offering a granular view of this crucial chemical sector. The market size is projected to reach xx Billion by 2033.
Bisphenol-A Market Dynamics & Structure
The Bisphenol-A market is characterized by moderate concentration, with key players holding significant market share. Technological innovation, particularly in sustainable BPA alternatives and production processes, is a key driver. Stringent regulatory frameworks concerning BPA usage, especially in food-contact applications, present both challenges and opportunities. Competitive substitutes, such as BPS and BPF, are gaining traction, impacting market share dynamics. The end-user demographics are diverse, spanning various industries with varying demands. M&A activity has been moderate, with strategic acquisitions aiming for vertical integration and expanded product portfolios.
- Market Concentration: Moderate, with top 5 players holding approximately xx% market share in 2024.
- Technological Innovation: Focus on sustainable BPA production and bio-based alternatives.
- Regulatory Landscape: Stringent regulations in food-contact applications drive demand for safer alternatives.
- Competitive Substitutes: BPS and BPF are emerging as viable substitutes, impacting market growth.
- M&A Activity: Moderate level of mergers and acquisitions, focused on expanding product lines and geographic reach. Estimated xx deals from 2019-2024.
Bisphenol-A Market Growth Trends & Insights
The Bisphenol-A market experienced steady growth during the historical period (2019-2024), driven primarily by increasing demand from the polycarbonate resins segment. The market is projected to exhibit a CAGR of xx% during the forecast period (2025-2033), reaching xx Billion by 2033. Technological disruptions, such as the development of sustainable BPA production methods and bio-based alternatives, are influencing market adoption rates. Consumer behavior shifts towards environmentally friendly products are also shaping market demand. Market penetration varies significantly across different regions and applications, with mature markets exhibiting slower growth rates compared to emerging economies.
Dominant Regions, Countries, or Segments in Bisphenol-A Market
Asia-Pacific dominates the Bisphenol-A market, driven by robust demand from the rapidly growing construction and packaging industries in countries like China and India. The Polycarbonate Resins segment holds the largest market share, followed by Epoxy Resins.
- Asia-Pacific: Strong economic growth, expanding infrastructure, and high consumption of BPA-based products drive market dominance. Market share: xx% in 2024.
- Polycarbonate Resins Segment: Largest application segment due to wide use in electronics, automotive, and consumer goods. Market share: xx% in 2024.
- Key Drivers: Rapid industrialization, increasing disposable incomes, and government infrastructure investments.
Bisphenol-A Market Product Landscape
The Bisphenol-A market offers a range of products, including various grades of BPA tailored to specific applications. Recent innovations focus on enhanced performance characteristics, such as improved heat resistance and transparency. Sustainable BPA production methods, using bio-based feedstocks, are gaining traction, offering unique selling propositions in terms of environmental sustainability. Technological advancements include improved production efficiency and reduced waste generation.
Key Drivers, Barriers & Challenges in Bisphenol-A Market
Key Drivers:
- Growing demand from the construction, automotive, and electronics industries.
- Increasing use of BPA in various applications, such as polycarbonate resins and epoxy resins.
- Technological advancements in BPA production and application.
Challenges & Restraints:
- Stringent regulations on BPA use in food-contact applications.
- Growing consumer awareness of BPA's potential health effects.
- Emergence of BPA-free alternatives.
- Estimated xx% decrease in demand due to regulatory pressure in 2024.
Emerging Opportunities in Bisphenol-A Market
Emerging opportunities lie in the development and adoption of sustainable BPA production methods and bio-based alternatives. Untapped markets in developing countries offer significant growth potential. Innovative applications in areas such as medical devices and advanced materials are also driving market expansion.
Growth Accelerators in the Bisphenol-A Market Industry
Technological breakthroughs in sustainable BPA production, strategic partnerships to expand market reach, and market expansion into new geographical areas are key accelerators for long-term growth in the Bisphenol-A market.
Key Players Shaping the Bisphenol-A Market Market
- Teijin Limited
- Mitsui Chemicals Inc
- Mitsubishi Chemical Corporation
- Chang Chun Group
- Zhejiang Petroleum & Chemical Co Ltd
- Nippon Steel Chemical & Material Co Ltd
- Samyang Holdings Corporation
- China National Bluestar (Group) Co Ltd
- Nan Ya Plastics Industry Co Ltd
- SABIC
- LG Chem
- Dow
- Hexion
- Idemitsu Kosan Co Ltd
- Lihua Yiweiyuan Chemical Co Ltd
- PTT Phenol Company Limited
- Covestro AG
- China Petroleum & Chemical Corporation (SINOPEC)
- Altivia Petrochemicals
- Kumho P&B Chemicals Inc
Notable Milestones in Bisphenol-A Market Sector
- March 2023: Teijin Limited launched new biomass-derived Bisphenol-A (BPA) polycarbonate (PC) resin products, certified as an ISCC PLUS sustainable product. This launch signifies a significant step towards environmentally friendly BPA production and is expected to influence market share in the coming years.
In-Depth Bisphenol-A Market Market Outlook
The Bisphenol-A market is poised for continued growth, driven by technological innovation and expansion into new applications. Opportunities exist in developing sustainable production methods, exploring new market segments, and strategic collaborations to address emerging challenges and capture market share. The market’s future success hinges on balancing the demand for BPA with the increasing concerns about its potential health and environmental impacts.
Bisphenol-A Market Segmentation
-
1. Application
- 1.1. Polycarbonate Resins
- 1.2. Epoxy Resins
- 1.3. Unsaturated Polyester Resins
- 1.4. Flame Retardants
- 1.5. Other Applications
Bisphenol-A Market Segmentation By Geography
-
1. Asia Pacific
- 1.1. China
- 1.2. India
- 1.3. Japan
- 1.4. South Korea
- 1.5. ASEAN Countries
- 1.6. Rest of Asia Pacific
-
2. North America
- 2.1. United States
- 2.2. Canada
- 2.3. Mexico
-
3. Europe
- 3.1. Germany
- 3.2. United Kingdom
- 3.3. Italy
- 3.4. France
- 3.5. Spain
- 3.6. Rest of Europe
-
4. South America
- 4.1. Brazil
- 4.2. Argentina
- 4.3. Rest of South America
-
5. Middle East and Africa
- 5.1. Saudi Arabia
- 5.2. South Africa
- 5.3. Rest of Middle East and Africa
Bisphenol-A Market REPORT HIGHLIGHTS
| Aspects | Details |
|---|---|
| Study Period | 2019-2033 |
| Base Year | 2024 |
| Estimated Year | 2025 |
| Forecast Period | 2025-2033 |
| Historical Period | 2019-2024 |
| Growth Rate | CAGR of 5.3% from 2019-2033 |
| Segmentation |
|
Table of Contents
- 1. Introduction
- 1.1. Research Scope
- 1.2. Market Segmentation
- 1.3. Research Methodology
- 1.4. Definitions and Assumptions
- 2. Executive Summary
- 2.1. Introduction
- 3. Market Dynamics
- 3.1. Introduction
- 3.2. Market Drivers
- 3.2.1. Soaring Demand from Polycarbonate Sector; Increasing Demand from Epoxy Resin Production
- 3.3. Market Restrains
- 3.3.1. Increasing Regulations in the Food and Beverage Industry
- 3.4. Market Trends
- 3.4.1. Increasing Demand for Polycarbonate Resins
- 4. Market Factor Analysis
- 4.1. Porters Five Forces
- 4.2. Supply/Value Chain
- 4.3. PESTEL analysis
- 4.4. Market Entropy
- 4.5. Patent/Trademark Analysis
- 5. Global Bisphenol-A Market Analysis, Insights and Forecast, 2019-2031
- 5.1. Market Analysis, Insights and Forecast - by Application
- 5.1.1. Polycarbonate Resins
- 5.1.2. Epoxy Resins
- 5.1.3. Unsaturated Polyester Resins
- 5.1.4. Flame Retardants
- 5.1.5. Other Applications
- 5.2. Market Analysis, Insights and Forecast - by Region
- 5.2.1. Asia Pacific
- 5.2.2. North America
- 5.2.3. Europe
- 5.2.4. South America
- 5.2.5. Middle East and Africa
- 5.1. Market Analysis, Insights and Forecast - by Application
- 6. Asia Pacific Bisphenol-A Market Analysis, Insights and Forecast, 2019-2031
- 6.1. Market Analysis, Insights and Forecast - by Application
- 6.1.1. Polycarbonate Resins
- 6.1.2. Epoxy Resins
- 6.1.3. Unsaturated Polyester Resins
- 6.1.4. Flame Retardants
- 6.1.5. Other Applications
- 6.1. Market Analysis, Insights and Forecast - by Application
- 7. North America Bisphenol-A Market Analysis, Insights and Forecast, 2019-2031
- 7.1. Market Analysis, Insights and Forecast - by Application
- 7.1.1. Polycarbonate Resins
- 7.1.2. Epoxy Resins
- 7.1.3. Unsaturated Polyester Resins
- 7.1.4. Flame Retardants
- 7.1.5. Other Applications
- 7.1. Market Analysis, Insights and Forecast - by Application
- 8. Europe Bisphenol-A Market Analysis, Insights and Forecast, 2019-2031
- 8.1. Market Analysis, Insights and Forecast - by Application
- 8.1.1. Polycarbonate Resins
- 8.1.2. Epoxy Resins
- 8.1.3. Unsaturated Polyester Resins
- 8.1.4. Flame Retardants
- 8.1.5. Other Applications
- 8.1. Market Analysis, Insights and Forecast - by Application
- 9. South America Bisphenol-A Market Analysis, Insights and Forecast, 2019-2031
- 9.1. Market Analysis, Insights and Forecast - by Application
- 9.1.1. Polycarbonate Resins
- 9.1.2. Epoxy Resins
- 9.1.3. Unsaturated Polyester Resins
- 9.1.4. Flame Retardants
- 9.1.5. Other Applications
- 9.1. Market Analysis, Insights and Forecast - by Application
- 10. Middle East and Africa Bisphenol-A Market Analysis, Insights and Forecast, 2019-2031
- 10.1. Market Analysis, Insights and Forecast - by Application
- 10.1.1. Polycarbonate Resins
- 10.1.2. Epoxy Resins
- 10.1.3. Unsaturated Polyester Resins
- 10.1.4. Flame Retardants
- 10.1.5. Other Applications
- 10.1. Market Analysis, Insights and Forecast - by Application
- 11. North America Bisphenol-A Market Analysis, Insights and Forecast, 2019-2031
- 11.1. Market Analysis, Insights and Forecast - By Country/Sub-region
- 11.1.1 United States
- 11.1.2 Canada
- 11.1.3 Mexico
- 12. Europe Bisphenol-A Market Analysis, Insights and Forecast, 2019-2031
- 12.1. Market Analysis, Insights and Forecast - By Country/Sub-region
- 12.1.1 Germany
- 12.1.2 France
- 12.1.3 Italy
- 12.1.4 United Kingdom
- 12.1.5 Netherlands
- 12.1.6 Rest of Europe
- 13. Asia Pacific Bisphenol-A Market Analysis, Insights and Forecast, 2019-2031
- 13.1. Market Analysis, Insights and Forecast - By Country/Sub-region
- 13.1.1 China
- 13.1.2 Japan
- 13.1.3 India
- 13.1.4 South Korea
- 13.1.5 Taiwan
- 13.1.6 Australia
- 13.1.7 Rest of Asia-Pacific
- 14. South America Bisphenol-A Market Analysis, Insights and Forecast, 2019-2031
- 14.1. Market Analysis, Insights and Forecast - By Country/Sub-region
- 14.1.1 Brazil
- 14.1.2 Argentina
- 14.1.3 Rest of South America
- 15. MEA Bisphenol-A Market Analysis, Insights and Forecast, 2019-2031
- 15.1. Market Analysis, Insights and Forecast - By Country/Sub-region
- 15.1.1 Middle East
- 15.1.2 Africa
- 16. Competitive Analysis
- 16.1. Global Market Share Analysis 2024
- 16.2. Company Profiles
- 16.2.1 Teijin Limited
- 16.2.1.1. Overview
- 16.2.1.2. Products
- 16.2.1.3. SWOT Analysis
- 16.2.1.4. Recent Developments
- 16.2.1.5. Financials (Based on Availability)
- 16.2.2 Mitsui Chemicals Inc
- 16.2.2.1. Overview
- 16.2.2.2. Products
- 16.2.2.3. SWOT Analysis
- 16.2.2.4. Recent Developments
- 16.2.2.5. Financials (Based on Availability)
- 16.2.3 Mitsubishi Chemical Corporation
- 16.2.3.1. Overview
- 16.2.3.2. Products
- 16.2.3.3. SWOT Analysis
- 16.2.3.4. Recent Developments
- 16.2.3.5. Financials (Based on Availability)
- 16.2.4 Chang Chun Group
- 16.2.4.1. Overview
- 16.2.4.2. Products
- 16.2.4.3. SWOT Analysis
- 16.2.4.4. Recent Developments
- 16.2.4.5. Financials (Based on Availability)
- 16.2.5 Zhejiang Petroleum & Chemical Co Ltd
- 16.2.5.1. Overview
- 16.2.5.2. Products
- 16.2.5.3. SWOT Analysis
- 16.2.5.4. Recent Developments
- 16.2.5.5. Financials (Based on Availability)
- 16.2.6 Nippon Steel Chemical & Material Co Ltd
- 16.2.6.1. Overview
- 16.2.6.2. Products
- 16.2.6.3. SWOT Analysis
- 16.2.6.4. Recent Developments
- 16.2.6.5. Financials (Based on Availability)
- 16.2.7 Samyang Holdings Corporation
- 16.2.7.1. Overview
- 16.2.7.2. Products
- 16.2.7.3. SWOT Analysis
- 16.2.7.4. Recent Developments
- 16.2.7.5. Financials (Based on Availability)
- 16.2.8 China National Bluestar (Group) Co Ltd
- 16.2.8.1. Overview
- 16.2.8.2. Products
- 16.2.8.3. SWOT Analysis
- 16.2.8.4. Recent Developments
- 16.2.8.5. Financials (Based on Availability)
- 16.2.9 Nan Ya Plastics Industry Co Ltd
- 16.2.9.1. Overview
- 16.2.9.2. Products
- 16.2.9.3. SWOT Analysis
- 16.2.9.4. Recent Developments
- 16.2.9.5. Financials (Based on Availability)
- 16.2.10 SABIC
- 16.2.10.1. Overview
- 16.2.10.2. Products
- 16.2.10.3. SWOT Analysis
- 16.2.10.4. Recent Developments
- 16.2.10.5. Financials (Based on Availability)
- 16.2.11 LG Chem
- 16.2.11.1. Overview
- 16.2.11.2. Products
- 16.2.11.3. SWOT Analysis
- 16.2.11.4. Recent Developments
- 16.2.11.5. Financials (Based on Availability)
- 16.2.12 Dow
- 16.2.12.1. Overview
- 16.2.12.2. Products
- 16.2.12.3. SWOT Analysis
- 16.2.12.4. Recent Developments
- 16.2.12.5. Financials (Based on Availability)
- 16.2.13 Hexion
- 16.2.13.1. Overview
- 16.2.13.2. Products
- 16.2.13.3. SWOT Analysis
- 16.2.13.4. Recent Developments
- 16.2.13.5. Financials (Based on Availability)
- 16.2.14 Idemitsu Kosan Co Ltd
- 16.2.14.1. Overview
- 16.2.14.2. Products
- 16.2.14.3. SWOT Analysis
- 16.2.14.4. Recent Developments
- 16.2.14.5. Financials (Based on Availability)
- 16.2.15 Lihua Yiweiyuan Chemical Co Ltd
- 16.2.15.1. Overview
- 16.2.15.2. Products
- 16.2.15.3. SWOT Analysis
- 16.2.15.4. Recent Developments
- 16.2.15.5. Financials (Based on Availability)
- 16.2.16 PTT Phenol Company Limited
- 16.2.16.1. Overview
- 16.2.16.2. Products
- 16.2.16.3. SWOT Analysis
- 16.2.16.4. Recent Developments
- 16.2.16.5. Financials (Based on Availability)
- 16.2.17 Covestro AG
- 16.2.17.1. Overview
- 16.2.17.2. Products
- 16.2.17.3. SWOT Analysis
- 16.2.17.4. Recent Developments
- 16.2.17.5. Financials (Based on Availability)
- 16.2.18 China Petroleum & Chemical Corporation (SINOPEC)
- 16.2.18.1. Overview
- 16.2.18.2. Products
- 16.2.18.3. SWOT Analysis
- 16.2.18.4. Recent Developments
- 16.2.18.5. Financials (Based on Availability)
- 16.2.19 Altivia Petrochemicals
- 16.2.19.1. Overview
- 16.2.19.2. Products
- 16.2.19.3. SWOT Analysis
- 16.2.19.4. Recent Developments
- 16.2.19.5. Financials (Based on Availability)
- 16.2.20 Kumho P&B Chemicals Inc
- 16.2.20.1. Overview
- 16.2.20.2. Products
- 16.2.20.3. SWOT Analysis
- 16.2.20.4. Recent Developments
- 16.2.20.5. Financials (Based on Availability)
- 16.2.1 Teijin Limited
List of Figures
- Figure 1: Global Bisphenol-A Market Revenue Breakdown (Billion, %) by Region 2024 & 2032
- Figure 2: Global Bisphenol-A Market Volume Breakdown (K Tons, %) by Region 2024 & 2032
- Figure 3: North America Bisphenol-A Market Revenue (Billion), by Country 2024 & 2032
- Figure 4: North America Bisphenol-A Market Volume (K Tons), by Country 2024 & 2032
- Figure 5: North America Bisphenol-A Market Revenue Share (%), by Country 2024 & 2032
- Figure 6: North America Bisphenol-A Market Volume Share (%), by Country 2024 & 2032
- Figure 7: Europe Bisphenol-A Market Revenue (Billion), by Country 2024 & 2032
- Figure 8: Europe Bisphenol-A Market Volume (K Tons), by Country 2024 & 2032
- Figure 9: Europe Bisphenol-A Market Revenue Share (%), by Country 2024 & 2032
- Figure 10: Europe Bisphenol-A Market Volume Share (%), by Country 2024 & 2032
- Figure 11: Asia Pacific Bisphenol-A Market Revenue (Billion), by Country 2024 & 2032
- Figure 12: Asia Pacific Bisphenol-A Market Volume (K Tons), by Country 2024 & 2032
- Figure 13: Asia Pacific Bisphenol-A Market Revenue Share (%), by Country 2024 & 2032
- Figure 14: Asia Pacific Bisphenol-A Market Volume Share (%), by Country 2024 & 2032
- Figure 15: South America Bisphenol-A Market Revenue (Billion), by Country 2024 & 2032
- Figure 16: South America Bisphenol-A Market Volume (K Tons), by Country 2024 & 2032
- Figure 17: South America Bisphenol-A Market Revenue Share (%), by Country 2024 & 2032
- Figure 18: South America Bisphenol-A Market Volume Share (%), by Country 2024 & 2032
- Figure 19: MEA Bisphenol-A Market Revenue (Billion), by Country 2024 & 2032
- Figure 20: MEA Bisphenol-A Market Volume (K Tons), by Country 2024 & 2032
- Figure 21: MEA Bisphenol-A Market Revenue Share (%), by Country 2024 & 2032
- Figure 22: MEA Bisphenol-A Market Volume Share (%), by Country 2024 & 2032
- Figure 23: Asia Pacific Bisphenol-A Market Revenue (Billion), by Application 2024 & 2032
- Figure 24: Asia Pacific Bisphenol-A Market Volume (K Tons), by Application 2024 & 2032
- Figure 25: Asia Pacific Bisphenol-A Market Revenue Share (%), by Application 2024 & 2032
- Figure 26: Asia Pacific Bisphenol-A Market Volume Share (%), by Application 2024 & 2032
- Figure 27: Asia Pacific Bisphenol-A Market Revenue (Billion), by Country 2024 & 2032
- Figure 28: Asia Pacific Bisphenol-A Market Volume (K Tons), by Country 2024 & 2032
- Figure 29: Asia Pacific Bisphenol-A Market Revenue Share (%), by Country 2024 & 2032
- Figure 30: Asia Pacific Bisphenol-A Market Volume Share (%), by Country 2024 & 2032
- Figure 31: North America Bisphenol-A Market Revenue (Billion), by Application 2024 & 2032
- Figure 32: North America Bisphenol-A Market Volume (K Tons), by Application 2024 & 2032
- Figure 33: North America Bisphenol-A Market Revenue Share (%), by Application 2024 & 2032
- Figure 34: North America Bisphenol-A Market Volume Share (%), by Application 2024 & 2032
- Figure 35: North America Bisphenol-A Market Revenue (Billion), by Country 2024 & 2032
- Figure 36: North America Bisphenol-A Market Volume (K Tons), by Country 2024 & 2032
- Figure 37: North America Bisphenol-A Market Revenue Share (%), by Country 2024 & 2032
- Figure 38: North America Bisphenol-A Market Volume Share (%), by Country 2024 & 2032
- Figure 39: Europe Bisphenol-A Market Revenue (Billion), by Application 2024 & 2032
- Figure 40: Europe Bisphenol-A Market Volume (K Tons), by Application 2024 & 2032
- Figure 41: Europe Bisphenol-A Market Revenue Share (%), by Application 2024 & 2032
- Figure 42: Europe Bisphenol-A Market Volume Share (%), by Application 2024 & 2032
- Figure 43: Europe Bisphenol-A Market Revenue (Billion), by Country 2024 & 2032
- Figure 44: Europe Bisphenol-A Market Volume (K Tons), by Country 2024 & 2032
- Figure 45: Europe Bisphenol-A Market Revenue Share (%), by Country 2024 & 2032
- Figure 46: Europe Bisphenol-A Market Volume Share (%), by Country 2024 & 2032
- Figure 47: South America Bisphenol-A Market Revenue (Billion), by Application 2024 & 2032
- Figure 48: South America Bisphenol-A Market Volume (K Tons), by Application 2024 & 2032
- Figure 49: South America Bisphenol-A Market Revenue Share (%), by Application 2024 & 2032
- Figure 50: South America Bisphenol-A Market Volume Share (%), by Application 2024 & 2032
- Figure 51: South America Bisphenol-A Market Revenue (Billion), by Country 2024 & 2032
- Figure 52: South America Bisphenol-A Market Volume (K Tons), by Country 2024 & 2032
- Figure 53: South America Bisphenol-A Market Revenue Share (%), by Country 2024 & 2032
- Figure 54: South America Bisphenol-A Market Volume Share (%), by Country 2024 & 2032
- Figure 55: Middle East and Africa Bisphenol-A Market Revenue (Billion), by Application 2024 & 2032
- Figure 56: Middle East and Africa Bisphenol-A Market Volume (K Tons), by Application 2024 & 2032
- Figure 57: Middle East and Africa Bisphenol-A Market Revenue Share (%), by Application 2024 & 2032
- Figure 58: Middle East and Africa Bisphenol-A Market Volume Share (%), by Application 2024 & 2032
- Figure 59: Middle East and Africa Bisphenol-A Market Revenue (Billion), by Country 2024 & 2032
- Figure 60: Middle East and Africa Bisphenol-A Market Volume (K Tons), by Country 2024 & 2032
- Figure 61: Middle East and Africa Bisphenol-A Market Revenue Share (%), by Country 2024 & 2032
- Figure 62: Middle East and Africa Bisphenol-A Market Volume Share (%), by Country 2024 & 2032
List of Tables
- Table 1: Global Bisphenol-A Market Revenue Billion Forecast, by Region 2019 & 2032
- Table 2: Global Bisphenol-A Market Volume K Tons Forecast, by Region 2019 & 2032
- Table 3: Global Bisphenol-A Market Revenue Billion Forecast, by Application 2019 & 2032
- Table 4: Global Bisphenol-A Market Volume K Tons Forecast, by Application 2019 & 2032
- Table 5: Global Bisphenol-A Market Revenue Billion Forecast, by Region 2019 & 2032
- Table 6: Global Bisphenol-A Market Volume K Tons Forecast, by Region 2019 & 2032
- Table 7: Global Bisphenol-A Market Revenue Billion Forecast, by Country 2019 & 2032
- Table 8: Global Bisphenol-A Market Volume K Tons Forecast, by Country 2019 & 2032
- Table 9: United States Bisphenol-A Market Revenue (Billion) Forecast, by Application 2019 & 2032
- Table 10: United States Bisphenol-A Market Volume (K Tons) Forecast, by Application 2019 & 2032
- Table 11: Canada Bisphenol-A Market Revenue (Billion) Forecast, by Application 2019 & 2032
- Table 12: Canada Bisphenol-A Market Volume (K Tons) Forecast, by Application 2019 & 2032
- Table 13: Mexico Bisphenol-A Market Revenue (Billion) Forecast, by Application 2019 & 2032
- Table 14: Mexico Bisphenol-A Market Volume (K Tons) Forecast, by Application 2019 & 2032
- Table 15: Global Bisphenol-A Market Revenue Billion Forecast, by Country 2019 & 2032
- Table 16: Global Bisphenol-A Market Volume K Tons Forecast, by Country 2019 & 2032
- Table 17: Germany Bisphenol-A Market Revenue (Billion) Forecast, by Application 2019 & 2032
- Table 18: Germany Bisphenol-A Market Volume (K Tons) Forecast, by Application 2019 & 2032
- Table 19: France Bisphenol-A Market Revenue (Billion) Forecast, by Application 2019 & 2032
- Table 20: France Bisphenol-A Market Volume (K Tons) Forecast, by Application 2019 & 2032
- Table 21: Italy Bisphenol-A Market Revenue (Billion) Forecast, by Application 2019 & 2032
- Table 22: Italy Bisphenol-A Market Volume (K Tons) Forecast, by Application 2019 & 2032
- Table 23: United Kingdom Bisphenol-A Market Revenue (Billion) Forecast, by Application 2019 & 2032
- Table 24: United Kingdom Bisphenol-A Market Volume (K Tons) Forecast, by Application 2019 & 2032
- Table 25: Netherlands Bisphenol-A Market Revenue (Billion) Forecast, by Application 2019 & 2032
- Table 26: Netherlands Bisphenol-A Market Volume (K Tons) Forecast, by Application 2019 & 2032
- Table 27: Rest of Europe Bisphenol-A Market Revenue (Billion) Forecast, by Application 2019 & 2032
- Table 28: Rest of Europe Bisphenol-A Market Volume (K Tons) Forecast, by Application 2019 & 2032
- Table 29: Global Bisphenol-A Market Revenue Billion Forecast, by Country 2019 & 2032
- Table 30: Global Bisphenol-A Market Volume K Tons Forecast, by Country 2019 & 2032
- Table 31: China Bisphenol-A Market Revenue (Billion) Forecast, by Application 2019 & 2032
- Table 32: China Bisphenol-A Market Volume (K Tons) Forecast, by Application 2019 & 2032
- Table 33: Japan Bisphenol-A Market Revenue (Billion) Forecast, by Application 2019 & 2032
- Table 34: Japan Bisphenol-A Market Volume (K Tons) Forecast, by Application 2019 & 2032
- Table 35: India Bisphenol-A Market Revenue (Billion) Forecast, by Application 2019 & 2032
- Table 36: India Bisphenol-A Market Volume (K Tons) Forecast, by Application 2019 & 2032
- Table 37: South Korea Bisphenol-A Market Revenue (Billion) Forecast, by Application 2019 & 2032
- Table 38: South Korea Bisphenol-A Market Volume (K Tons) Forecast, by Application 2019 & 2032
- Table 39: Taiwan Bisphenol-A Market Revenue (Billion) Forecast, by Application 2019 & 2032
- Table 40: Taiwan Bisphenol-A Market Volume (K Tons) Forecast, by Application 2019 & 2032
- Table 41: Australia Bisphenol-A Market Revenue (Billion) Forecast, by Application 2019 & 2032
- Table 42: Australia Bisphenol-A Market Volume (K Tons) Forecast, by Application 2019 & 2032
- Table 43: Rest of Asia-Pacific Bisphenol-A Market Revenue (Billion) Forecast, by Application 2019 & 2032
- Table 44: Rest of Asia-Pacific Bisphenol-A Market Volume (K Tons) Forecast, by Application 2019 & 2032
- Table 45: Global Bisphenol-A Market Revenue Billion Forecast, by Country 2019 & 2032
- Table 46: Global Bisphenol-A Market Volume K Tons Forecast, by Country 2019 & 2032
- Table 47: Brazil Bisphenol-A Market Revenue (Billion) Forecast, by Application 2019 & 2032
- Table 48: Brazil Bisphenol-A Market Volume (K Tons) Forecast, by Application 2019 & 2032
- Table 49: Argentina Bisphenol-A Market Revenue (Billion) Forecast, by Application 2019 & 2032
- Table 50: Argentina Bisphenol-A Market Volume (K Tons) Forecast, by Application 2019 & 2032
- Table 51: Rest of South America Bisphenol-A Market Revenue (Billion) Forecast, by Application 2019 & 2032
- Table 52: Rest of South America Bisphenol-A Market Volume (K Tons) Forecast, by Application 2019 & 2032
- Table 53: Global Bisphenol-A Market Revenue Billion Forecast, by Country 2019 & 2032
- Table 54: Global Bisphenol-A Market Volume K Tons Forecast, by Country 2019 & 2032
- Table 55: Middle East Bisphenol-A Market Revenue (Billion) Forecast, by Application 2019 & 2032
- Table 56: Middle East Bisphenol-A Market Volume (K Tons) Forecast, by Application 2019 & 2032
- Table 57: Africa Bisphenol-A Market Revenue (Billion) Forecast, by Application 2019 & 2032
- Table 58: Africa Bisphenol-A Market Volume (K Tons) Forecast, by Application 2019 & 2032
- Table 59: Global Bisphenol-A Market Revenue Billion Forecast, by Application 2019 & 2032
- Table 60: Global Bisphenol-A Market Volume K Tons Forecast, by Application 2019 & 2032
- Table 61: Global Bisphenol-A Market Revenue Billion Forecast, by Country 2019 & 2032
- Table 62: Global Bisphenol-A Market Volume K Tons Forecast, by Country 2019 & 2032
- Table 63: China Bisphenol-A Market Revenue (Billion) Forecast, by Application 2019 & 2032
- Table 64: China Bisphenol-A Market Volume (K Tons) Forecast, by Application 2019 & 2032
- Table 65: India Bisphenol-A Market Revenue (Billion) Forecast, by Application 2019 & 2032
- Table 66: India Bisphenol-A Market Volume (K Tons) Forecast, by Application 2019 & 2032
- Table 67: Japan Bisphenol-A Market Revenue (Billion) Forecast, by Application 2019 & 2032
- Table 68: Japan Bisphenol-A Market Volume (K Tons) Forecast, by Application 2019 & 2032
- Table 69: South Korea Bisphenol-A Market Revenue (Billion) Forecast, by Application 2019 & 2032
- Table 70: South Korea Bisphenol-A Market Volume (K Tons) Forecast, by Application 2019 & 2032
- Table 71: ASEAN Countries Bisphenol-A Market Revenue (Billion) Forecast, by Application 2019 & 2032
- Table 72: ASEAN Countries Bisphenol-A Market Volume (K Tons) Forecast, by Application 2019 & 2032
- Table 73: Rest of Asia Pacific Bisphenol-A Market Revenue (Billion) Forecast, by Application 2019 & 2032
- Table 74: Rest of Asia Pacific Bisphenol-A Market Volume (K Tons) Forecast, by Application 2019 & 2032
- Table 75: Global Bisphenol-A Market Revenue Billion Forecast, by Application 2019 & 2032
- Table 76: Global Bisphenol-A Market Volume K Tons Forecast, by Application 2019 & 2032
- Table 77: Global Bisphenol-A Market Revenue Billion Forecast, by Country 2019 & 2032
- Table 78: Global Bisphenol-A Market Volume K Tons Forecast, by Country 2019 & 2032
- Table 79: United States Bisphenol-A Market Revenue (Billion) Forecast, by Application 2019 & 2032
- Table 80: United States Bisphenol-A Market Volume (K Tons) Forecast, by Application 2019 & 2032
- Table 81: Canada Bisphenol-A Market Revenue (Billion) Forecast, by Application 2019 & 2032
- Table 82: Canada Bisphenol-A Market Volume (K Tons) Forecast, by Application 2019 & 2032
- Table 83: Mexico Bisphenol-A Market Revenue (Billion) Forecast, by Application 2019 & 2032
- Table 84: Mexico Bisphenol-A Market Volume (K Tons) Forecast, by Application 2019 & 2032
- Table 85: Global Bisphenol-A Market Revenue Billion Forecast, by Application 2019 & 2032
- Table 86: Global Bisphenol-A Market Volume K Tons Forecast, by Application 2019 & 2032
- Table 87: Global Bisphenol-A Market Revenue Billion Forecast, by Country 2019 & 2032
- Table 88: Global Bisphenol-A Market Volume K Tons Forecast, by Country 2019 & 2032
- Table 89: Germany Bisphenol-A Market Revenue (Billion) Forecast, by Application 2019 & 2032
- Table 90: Germany Bisphenol-A Market Volume (K Tons) Forecast, by Application 2019 & 2032
- Table 91: United Kingdom Bisphenol-A Market Revenue (Billion) Forecast, by Application 2019 & 2032
- Table 92: United Kingdom Bisphenol-A Market Volume (K Tons) Forecast, by Application 2019 & 2032
- Table 93: Italy Bisphenol-A Market Revenue (Billion) Forecast, by Application 2019 & 2032
- Table 94: Italy Bisphenol-A Market Volume (K Tons) Forecast, by Application 2019 & 2032
- Table 95: France Bisphenol-A Market Revenue (Billion) Forecast, by Application 2019 & 2032
- Table 96: France Bisphenol-A Market Volume (K Tons) Forecast, by Application 2019 & 2032
- Table 97: Spain Bisphenol-A Market Revenue (Billion) Forecast, by Application 2019 & 2032
- Table 98: Spain Bisphenol-A Market Volume (K Tons) Forecast, by Application 2019 & 2032
- Table 99: Rest of Europe Bisphenol-A Market Revenue (Billion) Forecast, by Application 2019 & 2032
- Table 100: Rest of Europe Bisphenol-A Market Volume (K Tons) Forecast, by Application 2019 & 2032
- Table 101: Global Bisphenol-A Market Revenue Billion Forecast, by Application 2019 & 2032
- Table 102: Global Bisphenol-A Market Volume K Tons Forecast, by Application 2019 & 2032
- Table 103: Global Bisphenol-A Market Revenue Billion Forecast, by Country 2019 & 2032
- Table 104: Global Bisphenol-A Market Volume K Tons Forecast, by Country 2019 & 2032
- Table 105: Brazil Bisphenol-A Market Revenue (Billion) Forecast, by Application 2019 & 2032
- Table 106: Brazil Bisphenol-A Market Volume (K Tons) Forecast, by Application 2019 & 2032
- Table 107: Argentina Bisphenol-A Market Revenue (Billion) Forecast, by Application 2019 & 2032
- Table 108: Argentina Bisphenol-A Market Volume (K Tons) Forecast, by Application 2019 & 2032
- Table 109: Rest of South America Bisphenol-A Market Revenue (Billion) Forecast, by Application 2019 & 2032
- Table 110: Rest of South America Bisphenol-A Market Volume (K Tons) Forecast, by Application 2019 & 2032
- Table 111: Global Bisphenol-A Market Revenue Billion Forecast, by Application 2019 & 2032
- Table 112: Global Bisphenol-A Market Volume K Tons Forecast, by Application 2019 & 2032
- Table 113: Global Bisphenol-A Market Revenue Billion Forecast, by Country 2019 & 2032
- Table 114: Global Bisphenol-A Market Volume K Tons Forecast, by Country 2019 & 2032
- Table 115: Saudi Arabia Bisphenol-A Market Revenue (Billion) Forecast, by Application 2019 & 2032
- Table 116: Saudi Arabia Bisphenol-A Market Volume (K Tons) Forecast, by Application 2019 & 2032
- Table 117: South Africa Bisphenol-A Market Revenue (Billion) Forecast, by Application 2019 & 2032
- Table 118: South Africa Bisphenol-A Market Volume (K Tons) Forecast, by Application 2019 & 2032
- Table 119: Rest of Middle East and Africa Bisphenol-A Market Revenue (Billion) Forecast, by Application 2019 & 2032
- Table 120: Rest of Middle East and Africa Bisphenol-A Market Volume (K Tons) Forecast, by Application 2019 & 2032
Frequently Asked Questions
1. What is the projected Compound Annual Growth Rate (CAGR) of the Bisphenol-A Market?
The projected CAGR is approximately 5.3%.
2. Which companies are prominent players in the Bisphenol-A Market?
Key companies in the market include Teijin Limited, Mitsui Chemicals Inc, Mitsubishi Chemical Corporation, Chang Chun Group, Zhejiang Petroleum & Chemical Co Ltd, Nippon Steel Chemical & Material Co Ltd, Samyang Holdings Corporation, China National Bluestar (Group) Co Ltd, Nan Ya Plastics Industry Co Ltd, SABIC, LG Chem, Dow, Hexion, Idemitsu Kosan Co Ltd, Lihua Yiweiyuan Chemical Co Ltd, PTT Phenol Company Limited, Covestro AG, China Petroleum & Chemical Corporation (SINOPEC), Altivia Petrochemicals, Kumho P&B Chemicals Inc.
3. What are the main segments of the Bisphenol-A Market?
The market segments include Application.
4. Can you provide details about the market size?
The market size is estimated to be USD 19.01 Billion as of 2022.
5. What are some drivers contributing to market growth?
Soaring Demand from Polycarbonate Sector; Increasing Demand from Epoxy Resin Production.
6. What are the notable trends driving market growth?
Increasing Demand for Polycarbonate Resins.
7. Are there any restraints impacting market growth?
Increasing Regulations in the Food and Beverage Industry.
8. Can you provide examples of recent developments in the market?
March 2023: Teijin Limited launched new biomass-derived Bisphenol-A (BPA) polycarbonate (PC) resin products, which were certified as an ISCC PLUS sustainable product by the International Sustainability and Carbon Certification (ISCC) system to support efforts to achieve carbon neutrality by reducing greenhouse gas (GHG) emissions throughout product lifecycles.
9. What pricing options are available for accessing the report?
Pricing options include single-user, multi-user, and enterprise licenses priced at USD 4750, USD 5250, and USD 8750 respectively.
10. Is the market size provided in terms of value or volume?
The market size is provided in terms of value, measured in Billion and volume, measured in K Tons.
11. Are there any specific market keywords associated with the report?
Yes, the market keyword associated with the report is "Bisphenol-A Market," which aids in identifying and referencing the specific market segment covered.
12. How do I determine which pricing option suits my needs best?
The pricing options vary based on user requirements and access needs. Individual users may opt for single-user licenses, while businesses requiring broader access may choose multi-user or enterprise licenses for cost-effective access to the report.
13. Are there any additional resources or data provided in the Bisphenol-A Market report?
While the report offers comprehensive insights, it's advisable to review the specific contents or supplementary materials provided to ascertain if additional resources or data are available.
14. How can I stay updated on further developments or reports in the Bisphenol-A Market?
To stay informed about further developments, trends, and reports in the Bisphenol-A Market, consider subscribing to industry newsletters, following relevant companies and organizations, or regularly checking reputable industry news sources and publications.
Methodology
Step 1 - Identification of Relevant Samples Size from Population Database


Step 2 - Approaches for Defining Global Market Size (Value, Volume* & Price*)

Note*: In applicable scenarios
Step 3 - Data Sources
Primary Research
- Web Analytics
- Survey Reports
- Research Institute
- Latest Research Reports
- Opinion Leaders
Secondary Research
- Annual Reports
- White Paper
- Latest Press Release
- Industry Association
- Paid Database
- Investor Presentations

Step 4 - Data Triangulation
Involves using different sources of information in order to increase the validity of a study
These sources are likely to be stakeholders in a program - participants, other researchers, program staff, other community members, and so on.
Then we put all data in single framework & apply various statistical tools to find out the dynamic on the market.
During the analysis stage, feedback from the stakeholder groups would be compared to determine areas of agreement as well as areas of divergence


