

Key Insights
The bioprocess validation market is experiencing robust expansion, propelled by escalating demand for biopharmaceuticals, advancements in biologics manufacturing, and stringent regulatory mandates for product safety and efficacy. This market is projected to reach $554.8 million by 2025, with a Compound Annual Growth Rate (CAGR) of 9.7%. Key growth drivers include substantial R&D investments by pharmaceutical and biotechnology firms, the rising global prevalence of chronic diseases boosting biopharmaceutical demand, and regulatory bodies' emphasis on comprehensive validation for product quality and safety. Segment analysis highlights extractables and microbiological testing services as significant contributors due to their critical role in contamination control and material compatibility. Geographically, North America and Europe lead due to mature biopharmaceutical sectors and strong regulatory frameworks, while the Asia-Pacific region shows rapid growth potential driven by increased manufacturing investments.
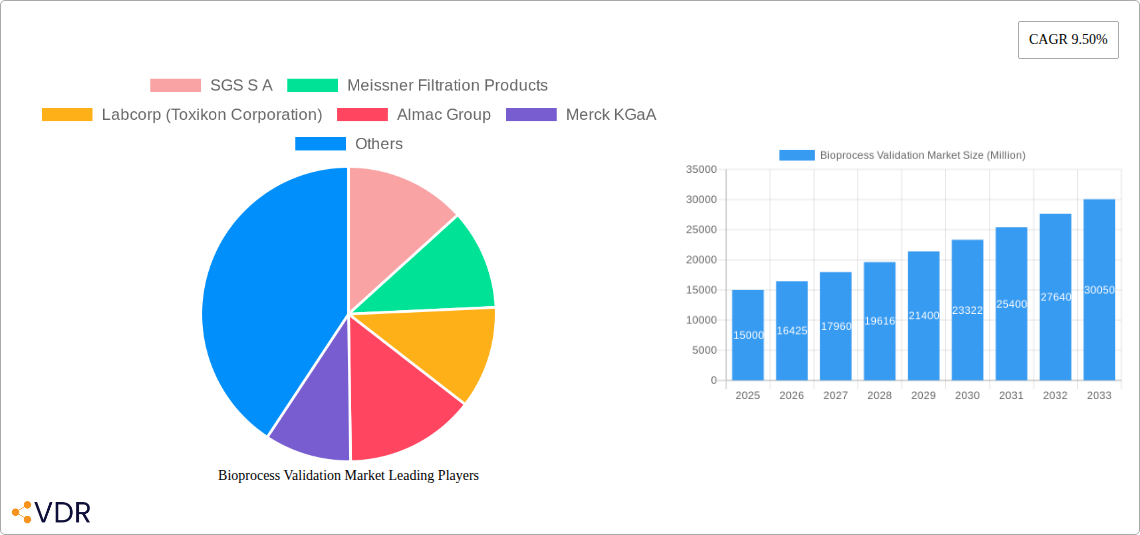
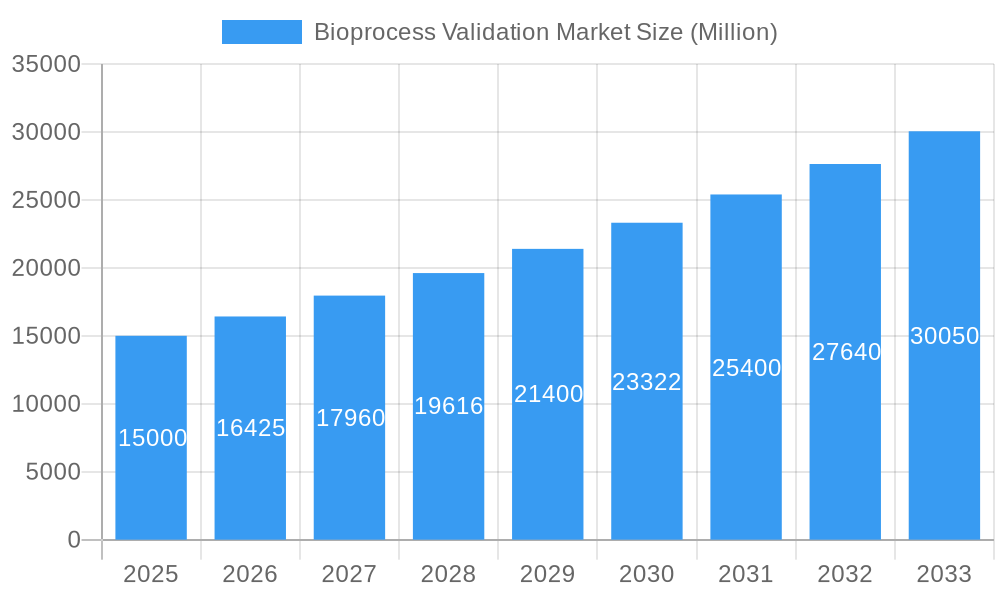
Bioprocess Validation Market Market Size (In Million)
The competitive environment features established multinational corporations and specialized service providers. Leading companies like SGS, Merck KGaA, and Thermo Fisher Scientific leverage extensive expertise and global presence. Emerging niche players are also catering to specific industry needs. Future growth will be shaped by technological innovations such as automation and digitalization, enhancing efficiency and reducing costs. The adoption of single-use technologies will influence demand for particular validation services, while the growing emphasis on sustainability may foster eco-friendly validation methods. Overall, the bioprocess validation market offers significant opportunities for stakeholders, underscoring its vital role in biopharmaceutical manufacturing.
Bioprocess Validation Market Company Market Share
Bioprocess Validation Market: A Comprehensive Report (2019-2033)
This comprehensive report provides an in-depth analysis of the Bioprocess Validation market, encompassing market dynamics, growth trends, regional segmentation, product landscape, key players, and future outlook. The study period covers 2019-2033, with 2025 as the base and estimated year. The forecast period is 2025-2033, and the historical period is 2019-2024. The market is segmented by Test Type (Extractables Testing Services, Microbiological Testing Services, Physiochemical Testing Services, Integrity Testing Services, Compatibility Testing Services, Other Testing Services), Process Component (Filter Elements, Media containers and bags, Freezing And Thawing Process Bags, Mixing Systems, Bioreactors, Transfer Systems, Others), and End User (Pharmaceutical & Biotechnology Companies, Contract Development & Manufacturing Organizations, Other End Users). The report is valued at xx Million in 2025 and is projected to reach xx Million by 2033, exhibiting a CAGR of xx%.
Bioprocess Validation Market Dynamics & Structure
The Bioprocess Validation market is characterized by moderate concentration, with key players holding significant market share. Technological innovation, particularly in automation and data analytics, is a major driver. Stringent regulatory frameworks, like those from the FDA and EMA, influence validation practices. Competitive substitutes include in-house validation capabilities, but specialized service providers often offer superior expertise and capacity. End-users are predominantly Pharmaceutical & Biotechnology Companies and Contract Development & Manufacturing Organizations (CDMOs), exhibiting a growing demand for validation services. M&A activity has been moderate, with strategic acquisitions aimed at expanding service portfolios and geographic reach.
- Market Concentration: Moderately concentrated, with top 5 players holding approximately xx% market share in 2025.
- Technological Innovation: Automation, AI-driven data analysis, and advanced analytical techniques are driving efficiency and accuracy.
- Regulatory Landscape: Stringent regulations (FDA, EMA) drive demand for compliant validation services.
- Competitive Substitutes: In-house validation capabilities, but external providers offer specialized expertise and scalability.
- M&A Activity: Moderate activity, focused on expanding service offerings and geographic reach. Approximately xx M&A deals were recorded between 2019 and 2024.
- End-User Demographics: Primarily Pharmaceutical & Biotechnology Companies and CDMOs, with a growing contribution from other end users.
Bioprocess Validation Market Growth Trends & Insights
The Bioprocess Validation market has experienced steady growth over the past few years, driven by factors such as increasing biopharmaceutical production, stringent regulatory compliance requirements, and the growing adoption of advanced technologies. The market size witnessed a substantial increase from xx Million in 2019 to xx Million in 2024. Adoption rates of advanced validation techniques, like those incorporating AI and automation, are accelerating. Technological disruptions are improving efficiency and reducing costs. Consumer behavior shifts towards outsourcing validation services to specialized providers are contributing to the market's expansion. The market is expected to grow at a CAGR of xx% during the forecast period (2025-2033), exceeding xx Million by 2033. Market penetration of advanced testing services is expected to rise from xx% in 2025 to xx% by 2033.
Dominant Regions, Countries, or Segments in Bioprocess Validation Market
North America currently dominates the Bioprocess Validation market, driven by a strong pharmaceutical and biotechnology sector and robust regulatory frameworks. Within this region, the United States holds the largest share due to high R&D investments and a large number of biopharmaceutical companies. Europe follows as a significant market, fueled by substantial government funding for life sciences research and development.
By Test Type: Extractables testing services represent a significant segment, due to increasing focus on product safety and regulatory compliance.
By Process Component: Bioreactors and filter elements hold substantial market share, driven by their critical roles in bioprocessing.
By End-User: Pharmaceutical & Biotechnology companies are the primary drivers of market growth, followed by CDMOs.
- Key Drivers (North America): High R&D spending, robust regulatory frameworks, established biopharmaceutical industry.
- Key Drivers (Europe): Government support for life sciences, strong presence of pharmaceutical and biotech companies.
- Growth Potential: Asia-Pacific exhibits high growth potential due to expanding biopharmaceutical industries and rising investments in infrastructure.
Bioprocess Validation Market Product Landscape
The Bioprocess Validation market features a range of services, including testing for extractables, microbial contamination, physiochemical properties, integrity of equipment, and compatibility of materials. Innovative products emphasize automation, data analytics, and advanced analytical techniques to enhance efficiency, accuracy, and compliance. Unique selling propositions often include specialized expertise, faster turnaround times, and compliance with global regulatory standards. Technological advancements are driving the adoption of more sophisticated and reliable validation methods.
Key Drivers, Barriers & Challenges in Bioprocess Validation Market
Key Drivers:
- Increasing biopharmaceutical production and rising demand for biosimilars.
- Stringent regulatory requirements and compliance needs.
- Technological advancements in automation and data analytics.
- Growing outsourcing of validation services to specialized providers.
Key Challenges:
- High cost of validation services can be a barrier for smaller companies.
- Complex regulatory landscape requires significant expertise and resources.
- Competition from in-house validation capabilities.
- Supply chain disruptions can impact the availability of testing materials and services. (estimated impact on market growth: xx% in 2024)
Emerging Opportunities in Bioprocess Validation Market
- Expansion into emerging markets: Untapped potential in Asia-Pacific and Latin America.
- Development of innovative validation methods: Utilizing AI and machine learning for more efficient and accurate testing.
- Focus on personalized medicine: Validation services tailored to individual patient needs.
- Growth in cell and gene therapy: Validation of novel processing techniques and materials for advanced therapies.
Growth Accelerators in the Bioprocess Validation Market Industry
Technological breakthroughs in automation and data analytics are significantly accelerating market growth. Strategic partnerships between validation service providers and biopharmaceutical companies are streamlining processes and fostering innovation. Market expansion into emerging economies with developing biopharmaceutical sectors is creating substantial growth opportunities.
Key Players Shaping the Bioprocess Validation Market Market
- SGS S A
- Meissner Filtration Products
- Labcorp (Toxikon Corporation)
- Almac Group
- Merck KGaA
- Eurofins Scientific
- Cobetter Filtration Equipments Co Ltd
- Pall Corporation
- Sartorius AG
- Thermo Fisher Scientific
- DOC S r l
Notable Milestones in Bioprocess Validation Market Sector
- May 2022: Qosina launched its new Bioprocess Resource Center, enhancing information access for the industry.
- September 2022: Eppendorf SE expanded its bioprocess site in Jülich, Germany, signifying investment in capacity and advanced technologies.
In-Depth Bioprocess Validation Market Market Outlook
The Bioprocess Validation market is poised for continued strong growth, driven by technological advancements, increasing biopharmaceutical production, and stringent regulatory requirements. Strategic partnerships and expansion into emerging markets will further fuel market expansion. The focus on advanced therapies and personalized medicine will create new opportunities for specialized validation services. The market's future potential is substantial, presenting significant opportunities for both established players and new entrants.
Bioprocess Validation Market Segmentation
-
1. Test Type
- 1.1. Extractables Testing Services
- 1.2. Microbiological Testing Services
- 1.3. Physiochemical Testing Services
- 1.4. Integrity Testing Services
- 1.5. Compatibility Testing Services
- 1.6. Other Testing Services
-
2. Process Component
- 2.1. Filter Elements
- 2.2. Media containers and bags
- 2.3. Freezing And Thawing Process Bags
- 2.4. Mixing Systems
- 2.5. Bioreactors
- 2.6. Transfer Systems
- 2.7. Others
-
3. End User
- 3.1. Pharmaceutical & Biotechnology Companies
- 3.2. Contract Development & Manufacturing Organizations
- 3.3. Other End Users
Bioprocess Validation Market Segmentation By Geography
-
1. North America
- 1.1. United States
- 1.2. Canada
- 1.3. Mexico
-
2. Europe
- 2.1. Germany
- 2.2. United Kingdom
- 2.3. France
- 2.4. Italy
- 2.5. Spain
- 2.6. Rest of Europe
-
3. Asia Pacific
- 3.1. China
- 3.2. Japan
- 3.3. India
- 3.4. Australia
- 3.5. South Korea
- 3.6. Rest of Asia Pacific
-
4. Middle East and Africa
- 4.1. GCC
- 4.2. South Africa
- 4.3. Rest of Middle East and Africa
-
5. South America
- 5.1. Brazil
- 5.2. Argentina
- 5.3. Rest of South America
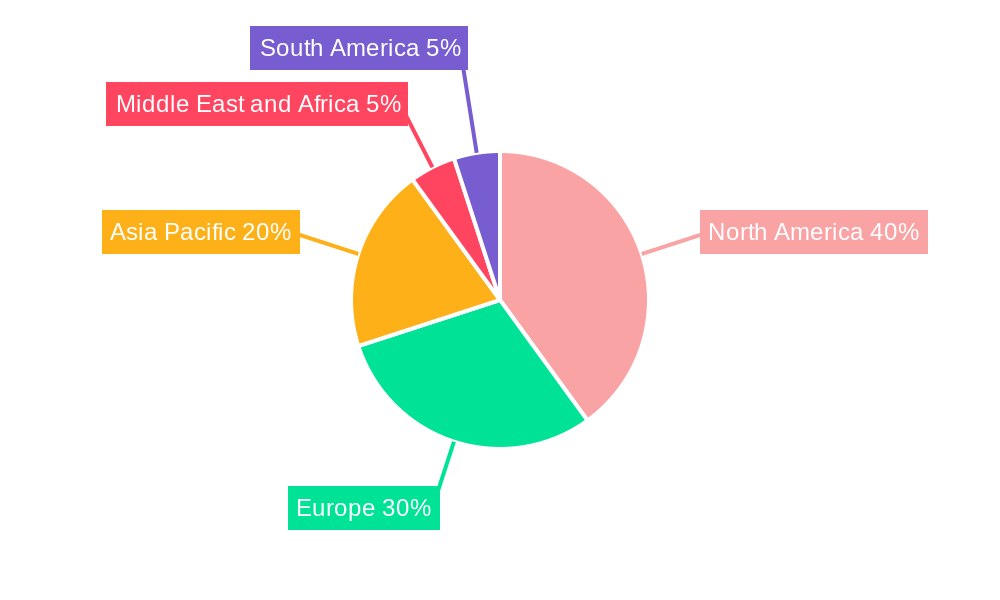
Bioprocess Validation Market Regional Market Share
Geographic Coverage of Bioprocess Validation Market
Bioprocess Validation Market REPORT HIGHLIGHTS
| Aspects | Details |
|---|---|
| Study Period | 2020-2034 |
| Base Year | 2025 |
| Estimated Year | 2026 |
| Forecast Period | 2026-2034 |
| Historical Period | 2020-2025 |
| Growth Rate | CAGR of 9.7% from 2020-2034 |
| Segmentation |
|
Table of Contents
- 1. Introduction
- 1.1. Research Scope
- 1.2. Market Segmentation
- 1.3. Research Objective
- 1.4. Definitions and Assumptions
- 2. Executive Summary
- 2.1. Market Snapshot
- 3. Market Dynamics
- 3.1. Market Drivers
- 3.2. Market Restrains
- 3.3. Market Trends
- 3.4. Market Opportunities
- 4. Market Factor Analysis
- 4.1. Porters Five Forces
- 4.1.1. Bargaining Power of Suppliers
- 4.1.2. Bargaining Power of Buyers
- 4.1.3. Threat of New Entrants
- 4.1.4. Threat of Substitutes
- 4.1.5. Competitive Rivalry
- 4.2. PESTEL analysis
- 4.3. BCG Analysis
- 4.3.1. Stars (High Growth, High Market Share)
- 4.3.2. Cash Cows (Low Growth, High Market Share)
- 4.3.3. Question Mark (High Growth, Low Market Share)
- 4.3.4. Dogs (Low Growth, Low Market Share)
- 4.4. Ansoff Matrix Analysis
- 4.5. Supply Chain Analysis
- 4.6. Regulatory Landscape
- 4.7. Current Market Potential and Opportunity Assessment (TAM–SAM–SOM Framework)
- 4.8. VDR Analyst Note
- 4.1. Porters Five Forces
- 5. Market Analysis, Insights and Forecast 2021-2033
- 5.1. Market Analysis, Insights and Forecast - by Test Type
- 5.1.1. Extractables Testing Services
- 5.1.2. Microbiological Testing Services
- 5.1.3. Physiochemical Testing Services
- 5.1.4. Integrity Testing Services
- 5.1.5. Compatibility Testing Services
- 5.1.6. Other Testing Services
- 5.2. Market Analysis, Insights and Forecast - by Process Component
- 5.2.1. Filter Elements
- 5.2.2. Media containers and bags
- 5.2.3. Freezing And Thawing Process Bags
- 5.2.4. Mixing Systems
- 5.2.5. Bioreactors
- 5.2.6. Transfer Systems
- 5.2.7. Others
- 5.3. Market Analysis, Insights and Forecast - by End User
- 5.3.1. Pharmaceutical & Biotechnology Companies
- 5.3.2. Contract Development & Manufacturing Organizations
- 5.3.3. Other End Users
- 5.4. Market Analysis, Insights and Forecast - by Region
- 5.4.1. North America
- 5.4.2. Europe
- 5.4.3. Asia Pacific
- 5.4.4. Middle East and Africa
- 5.4.5. South America
- 5.1. Market Analysis, Insights and Forecast - by Test Type
- 6. Global Bioprocess Validation Market Analysis, Insights and Forecast, 2021-2033
- 6.1. Market Analysis, Insights and Forecast - by Test Type
- 6.1.1. Extractables Testing Services
- 6.1.2. Microbiological Testing Services
- 6.1.3. Physiochemical Testing Services
- 6.1.4. Integrity Testing Services
- 6.1.5. Compatibility Testing Services
- 6.1.6. Other Testing Services
- 6.2. Market Analysis, Insights and Forecast - by Process Component
- 6.2.1. Filter Elements
- 6.2.2. Media containers and bags
- 6.2.3. Freezing And Thawing Process Bags
- 6.2.4. Mixing Systems
- 6.2.5. Bioreactors
- 6.2.6. Transfer Systems
- 6.2.7. Others
- 6.3. Market Analysis, Insights and Forecast - by End User
- 6.3.1. Pharmaceutical & Biotechnology Companies
- 6.3.2. Contract Development & Manufacturing Organizations
- 6.3.3. Other End Users
- 6.1. Market Analysis, Insights and Forecast - by Test Type
- 7. North America Bioprocess Validation Market Analysis, Insights and Forecast, 2021-2033
- 7.1. Market Analysis, Insights and Forecast - by Test Type
- 7.1.1. Extractables Testing Services
- 7.1.2. Microbiological Testing Services
- 7.1.3. Physiochemical Testing Services
- 7.1.4. Integrity Testing Services
- 7.1.5. Compatibility Testing Services
- 7.1.6. Other Testing Services
- 7.2. Market Analysis, Insights and Forecast - by Process Component
- 7.2.1. Filter Elements
- 7.2.2. Media containers and bags
- 7.2.3. Freezing And Thawing Process Bags
- 7.2.4. Mixing Systems
- 7.2.5. Bioreactors
- 7.2.6. Transfer Systems
- 7.2.7. Others
- 7.3. Market Analysis, Insights and Forecast - by End User
- 7.3.1. Pharmaceutical & Biotechnology Companies
- 7.3.2. Contract Development & Manufacturing Organizations
- 7.3.3. Other End Users
- 7.1. Market Analysis, Insights and Forecast - by Test Type
- 8. Europe Bioprocess Validation Market Analysis, Insights and Forecast, 2021-2033
- 8.1. Market Analysis, Insights and Forecast - by Test Type
- 8.1.1. Extractables Testing Services
- 8.1.2. Microbiological Testing Services
- 8.1.3. Physiochemical Testing Services
- 8.1.4. Integrity Testing Services
- 8.1.5. Compatibility Testing Services
- 8.1.6. Other Testing Services
- 8.2. Market Analysis, Insights and Forecast - by Process Component
- 8.2.1. Filter Elements
- 8.2.2. Media containers and bags
- 8.2.3. Freezing And Thawing Process Bags
- 8.2.4. Mixing Systems
- 8.2.5. Bioreactors
- 8.2.6. Transfer Systems
- 8.2.7. Others
- 8.3. Market Analysis, Insights and Forecast - by End User
- 8.3.1. Pharmaceutical & Biotechnology Companies
- 8.3.2. Contract Development & Manufacturing Organizations
- 8.3.3. Other End Users
- 8.1. Market Analysis, Insights and Forecast - by Test Type
- 9. Asia Pacific Bioprocess Validation Market Analysis, Insights and Forecast, 2021-2033
- 9.1. Market Analysis, Insights and Forecast - by Test Type
- 9.1.1. Extractables Testing Services
- 9.1.2. Microbiological Testing Services
- 9.1.3. Physiochemical Testing Services
- 9.1.4. Integrity Testing Services
- 9.1.5. Compatibility Testing Services
- 9.1.6. Other Testing Services
- 9.2. Market Analysis, Insights and Forecast - by Process Component
- 9.2.1. Filter Elements
- 9.2.2. Media containers and bags
- 9.2.3. Freezing And Thawing Process Bags
- 9.2.4. Mixing Systems
- 9.2.5. Bioreactors
- 9.2.6. Transfer Systems
- 9.2.7. Others
- 9.3. Market Analysis, Insights and Forecast - by End User
- 9.3.1. Pharmaceutical & Biotechnology Companies
- 9.3.2. Contract Development & Manufacturing Organizations
- 9.3.3. Other End Users
- 9.1. Market Analysis, Insights and Forecast - by Test Type
- 10. Middle East and Africa Bioprocess Validation Market Analysis, Insights and Forecast, 2021-2033
- 10.1. Market Analysis, Insights and Forecast - by Test Type
- 10.1.1. Extractables Testing Services
- 10.1.2. Microbiological Testing Services
- 10.1.3. Physiochemical Testing Services
- 10.1.4. Integrity Testing Services
- 10.1.5. Compatibility Testing Services
- 10.1.6. Other Testing Services
- 10.2. Market Analysis, Insights and Forecast - by Process Component
- 10.2.1. Filter Elements
- 10.2.2. Media containers and bags
- 10.2.3. Freezing And Thawing Process Bags
- 10.2.4. Mixing Systems
- 10.2.5. Bioreactors
- 10.2.6. Transfer Systems
- 10.2.7. Others
- 10.3. Market Analysis, Insights and Forecast - by End User
- 10.3.1. Pharmaceutical & Biotechnology Companies
- 10.3.2. Contract Development & Manufacturing Organizations
- 10.3.3. Other End Users
- 10.1. Market Analysis, Insights and Forecast - by Test Type
- 11. South America Bioprocess Validation Market Analysis, Insights and Forecast, 2021-2033
- 11.1. Market Analysis, Insights and Forecast - by Test Type
- 11.1.1. Extractables Testing Services
- 11.1.2. Microbiological Testing Services
- 11.1.3. Physiochemical Testing Services
- 11.1.4. Integrity Testing Services
- 11.1.5. Compatibility Testing Services
- 11.1.6. Other Testing Services
- 11.2. Market Analysis, Insights and Forecast - by Process Component
- 11.2.1. Filter Elements
- 11.2.2. Media containers and bags
- 11.2.3. Freezing And Thawing Process Bags
- 11.2.4. Mixing Systems
- 11.2.5. Bioreactors
- 11.2.6. Transfer Systems
- 11.2.7. Others
- 11.3. Market Analysis, Insights and Forecast - by End User
- 11.3.1. Pharmaceutical & Biotechnology Companies
- 11.3.2. Contract Development & Manufacturing Organizations
- 11.3.3. Other End Users
- 11.1. Market Analysis, Insights and Forecast - by Test Type
- 12. Competitive Analysis
- 12.1. Company Profiles
- 12.1.1 SGS S A
- 12.1.1.1. Company Overview
- 12.1.1.2. Products
- 12.1.1.3. Company Financials
- 12.1.1.4. SWOT Analysis
- 12.1.2 Meissner Filtration Products
- 12.1.2.1. Company Overview
- 12.1.2.2. Products
- 12.1.2.3. Company Financials
- 12.1.2.4. SWOT Analysis
- 12.1.3 Labcorp (Toxikon Corporation)
- 12.1.3.1. Company Overview
- 12.1.3.2. Products
- 12.1.3.3. Company Financials
- 12.1.3.4. SWOT Analysis
- 12.1.4 Almac Group
- 12.1.4.1. Company Overview
- 12.1.4.2. Products
- 12.1.4.3. Company Financials
- 12.1.4.4. SWOT Analysis
- 12.1.5 Merck KGaA
- 12.1.5.1. Company Overview
- 12.1.5.2. Products
- 12.1.5.3. Company Financials
- 12.1.5.4. SWOT Analysis
- 12.1.6 Eurofins Scientific
- 12.1.6.1. Company Overview
- 12.1.6.2. Products
- 12.1.6.3. Company Financials
- 12.1.6.4. SWOT Analysis
- 12.1.7 Cobetter Filtration Equipments Co Ltd
- 12.1.7.1. Company Overview
- 12.1.7.2. Products
- 12.1.7.3. Company Financials
- 12.1.7.4. SWOT Analysis
- 12.1.8 Pall Corporation
- 12.1.8.1. Company Overview
- 12.1.8.2. Products
- 12.1.8.3. Company Financials
- 12.1.8.4. SWOT Analysis
- 12.1.9 Sartorius AG
- 12.1.9.1. Company Overview
- 12.1.9.2. Products
- 12.1.9.3. Company Financials
- 12.1.9.4. SWOT Analysis
- 12.1.10 Thermo Fisher Scientific
- 12.1.10.1. Company Overview
- 12.1.10.2. Products
- 12.1.10.3. Company Financials
- 12.1.10.4. SWOT Analysis
- 12.1.11 DOC S r l
- 12.1.11.1. Company Overview
- 12.1.11.2. Products
- 12.1.11.3. Company Financials
- 12.1.11.4. SWOT Analysis
- 12.1.1 SGS S A
- 12.2. Market Entropy
- 12.2.1 Company's Key Areas Served
- 12.2.2 Recent Developments
- 12.3. Company Market Share Analysis 2025
- 12.3.1 Top 5 Companies Market Share Analysis
- 12.3.2 Top 3 Companies Market Share Analysis
- 12.4. List of Potential Customers
- 13. Research Methodology
List of Figures
- Figure 1: Global Bioprocess Validation Market Revenue Breakdown (million, %) by Region 2025 & 2033
- Figure 2: Global Bioprocess Validation Market Volume Breakdown (K Unit, %) by Region 2025 & 2033
- Figure 3: North America Bioprocess Validation Market Revenue (million), by Test Type 2025 & 2033
- Figure 4: North America Bioprocess Validation Market Volume (K Unit), by Test Type 2025 & 2033
- Figure 5: North America Bioprocess Validation Market Revenue Share (%), by Test Type 2025 & 2033
- Figure 6: North America Bioprocess Validation Market Volume Share (%), by Test Type 2025 & 2033
- Figure 7: North America Bioprocess Validation Market Revenue (million), by Process Component 2025 & 2033
- Figure 8: North America Bioprocess Validation Market Volume (K Unit), by Process Component 2025 & 2033
- Figure 9: North America Bioprocess Validation Market Revenue Share (%), by Process Component 2025 & 2033
- Figure 10: North America Bioprocess Validation Market Volume Share (%), by Process Component 2025 & 2033
- Figure 11: North America Bioprocess Validation Market Revenue (million), by End User 2025 & 2033
- Figure 12: North America Bioprocess Validation Market Volume (K Unit), by End User 2025 & 2033
- Figure 13: North America Bioprocess Validation Market Revenue Share (%), by End User 2025 & 2033
- Figure 14: North America Bioprocess Validation Market Volume Share (%), by End User 2025 & 2033
- Figure 15: North America Bioprocess Validation Market Revenue (million), by Country 2025 & 2033
- Figure 16: North America Bioprocess Validation Market Volume (K Unit), by Country 2025 & 2033
- Figure 17: North America Bioprocess Validation Market Revenue Share (%), by Country 2025 & 2033
- Figure 18: North America Bioprocess Validation Market Volume Share (%), by Country 2025 & 2033
- Figure 19: Europe Bioprocess Validation Market Revenue (million), by Test Type 2025 & 2033
- Figure 20: Europe Bioprocess Validation Market Volume (K Unit), by Test Type 2025 & 2033
- Figure 21: Europe Bioprocess Validation Market Revenue Share (%), by Test Type 2025 & 2033
- Figure 22: Europe Bioprocess Validation Market Volume Share (%), by Test Type 2025 & 2033
- Figure 23: Europe Bioprocess Validation Market Revenue (million), by Process Component 2025 & 2033
- Figure 24: Europe Bioprocess Validation Market Volume (K Unit), by Process Component 2025 & 2033
- Figure 25: Europe Bioprocess Validation Market Revenue Share (%), by Process Component 2025 & 2033
- Figure 26: Europe Bioprocess Validation Market Volume Share (%), by Process Component 2025 & 2033
- Figure 27: Europe Bioprocess Validation Market Revenue (million), by End User 2025 & 2033
- Figure 28: Europe Bioprocess Validation Market Volume (K Unit), by End User 2025 & 2033
- Figure 29: Europe Bioprocess Validation Market Revenue Share (%), by End User 2025 & 2033
- Figure 30: Europe Bioprocess Validation Market Volume Share (%), by End User 2025 & 2033
- Figure 31: Europe Bioprocess Validation Market Revenue (million), by Country 2025 & 2033
- Figure 32: Europe Bioprocess Validation Market Volume (K Unit), by Country 2025 & 2033
- Figure 33: Europe Bioprocess Validation Market Revenue Share (%), by Country 2025 & 2033
- Figure 34: Europe Bioprocess Validation Market Volume Share (%), by Country 2025 & 2033
- Figure 35: Asia Pacific Bioprocess Validation Market Revenue (million), by Test Type 2025 & 2033
- Figure 36: Asia Pacific Bioprocess Validation Market Volume (K Unit), by Test Type 2025 & 2033
- Figure 37: Asia Pacific Bioprocess Validation Market Revenue Share (%), by Test Type 2025 & 2033
- Figure 38: Asia Pacific Bioprocess Validation Market Volume Share (%), by Test Type 2025 & 2033
- Figure 39: Asia Pacific Bioprocess Validation Market Revenue (million), by Process Component 2025 & 2033
- Figure 40: Asia Pacific Bioprocess Validation Market Volume (K Unit), by Process Component 2025 & 2033
- Figure 41: Asia Pacific Bioprocess Validation Market Revenue Share (%), by Process Component 2025 & 2033
- Figure 42: Asia Pacific Bioprocess Validation Market Volume Share (%), by Process Component 2025 & 2033
- Figure 43: Asia Pacific Bioprocess Validation Market Revenue (million), by End User 2025 & 2033
- Figure 44: Asia Pacific Bioprocess Validation Market Volume (K Unit), by End User 2025 & 2033
- Figure 45: Asia Pacific Bioprocess Validation Market Revenue Share (%), by End User 2025 & 2033
- Figure 46: Asia Pacific Bioprocess Validation Market Volume Share (%), by End User 2025 & 2033
- Figure 47: Asia Pacific Bioprocess Validation Market Revenue (million), by Country 2025 & 2033
- Figure 48: Asia Pacific Bioprocess Validation Market Volume (K Unit), by Country 2025 & 2033
- Figure 49: Asia Pacific Bioprocess Validation Market Revenue Share (%), by Country 2025 & 2033
- Figure 50: Asia Pacific Bioprocess Validation Market Volume Share (%), by Country 2025 & 2033
- Figure 51: Middle East and Africa Bioprocess Validation Market Revenue (million), by Test Type 2025 & 2033
- Figure 52: Middle East and Africa Bioprocess Validation Market Volume (K Unit), by Test Type 2025 & 2033
- Figure 53: Middle East and Africa Bioprocess Validation Market Revenue Share (%), by Test Type 2025 & 2033
- Figure 54: Middle East and Africa Bioprocess Validation Market Volume Share (%), by Test Type 2025 & 2033
- Figure 55: Middle East and Africa Bioprocess Validation Market Revenue (million), by Process Component 2025 & 2033
- Figure 56: Middle East and Africa Bioprocess Validation Market Volume (K Unit), by Process Component 2025 & 2033
- Figure 57: Middle East and Africa Bioprocess Validation Market Revenue Share (%), by Process Component 2025 & 2033
- Figure 58: Middle East and Africa Bioprocess Validation Market Volume Share (%), by Process Component 2025 & 2033
- Figure 59: Middle East and Africa Bioprocess Validation Market Revenue (million), by End User 2025 & 2033
- Figure 60: Middle East and Africa Bioprocess Validation Market Volume (K Unit), by End User 2025 & 2033
- Figure 61: Middle East and Africa Bioprocess Validation Market Revenue Share (%), by End User 2025 & 2033
- Figure 62: Middle East and Africa Bioprocess Validation Market Volume Share (%), by End User 2025 & 2033
- Figure 63: Middle East and Africa Bioprocess Validation Market Revenue (million), by Country 2025 & 2033
- Figure 64: Middle East and Africa Bioprocess Validation Market Volume (K Unit), by Country 2025 & 2033
- Figure 65: Middle East and Africa Bioprocess Validation Market Revenue Share (%), by Country 2025 & 2033
- Figure 66: Middle East and Africa Bioprocess Validation Market Volume Share (%), by Country 2025 & 2033
- Figure 67: South America Bioprocess Validation Market Revenue (million), by Test Type 2025 & 2033
- Figure 68: South America Bioprocess Validation Market Volume (K Unit), by Test Type 2025 & 2033
- Figure 69: South America Bioprocess Validation Market Revenue Share (%), by Test Type 2025 & 2033
- Figure 70: South America Bioprocess Validation Market Volume Share (%), by Test Type 2025 & 2033
- Figure 71: South America Bioprocess Validation Market Revenue (million), by Process Component 2025 & 2033
- Figure 72: South America Bioprocess Validation Market Volume (K Unit), by Process Component 2025 & 2033
- Figure 73: South America Bioprocess Validation Market Revenue Share (%), by Process Component 2025 & 2033
- Figure 74: South America Bioprocess Validation Market Volume Share (%), by Process Component 2025 & 2033
- Figure 75: South America Bioprocess Validation Market Revenue (million), by End User 2025 & 2033
- Figure 76: South America Bioprocess Validation Market Volume (K Unit), by End User 2025 & 2033
- Figure 77: South America Bioprocess Validation Market Revenue Share (%), by End User 2025 & 2033
- Figure 78: South America Bioprocess Validation Market Volume Share (%), by End User 2025 & 2033
- Figure 79: South America Bioprocess Validation Market Revenue (million), by Country 2025 & 2033
- Figure 80: South America Bioprocess Validation Market Volume (K Unit), by Country 2025 & 2033
- Figure 81: South America Bioprocess Validation Market Revenue Share (%), by Country 2025 & 2033
- Figure 82: South America Bioprocess Validation Market Volume Share (%), by Country 2025 & 2033
List of Tables
- Table 1: Global Bioprocess Validation Market Revenue million Forecast, by Test Type 2020 & 2033
- Table 2: Global Bioprocess Validation Market Volume K Unit Forecast, by Test Type 2020 & 2033
- Table 3: Global Bioprocess Validation Market Revenue million Forecast, by Process Component 2020 & 2033
- Table 4: Global Bioprocess Validation Market Volume K Unit Forecast, by Process Component 2020 & 2033
- Table 5: Global Bioprocess Validation Market Revenue million Forecast, by End User 2020 & 2033
- Table 6: Global Bioprocess Validation Market Volume K Unit Forecast, by End User 2020 & 2033
- Table 7: Global Bioprocess Validation Market Revenue million Forecast, by Region 2020 & 2033
- Table 8: Global Bioprocess Validation Market Volume K Unit Forecast, by Region 2020 & 2033
- Table 9: Global Bioprocess Validation Market Revenue million Forecast, by Test Type 2020 & 2033
- Table 10: Global Bioprocess Validation Market Volume K Unit Forecast, by Test Type 2020 & 2033
- Table 11: Global Bioprocess Validation Market Revenue million Forecast, by Process Component 2020 & 2033
- Table 12: Global Bioprocess Validation Market Volume K Unit Forecast, by Process Component 2020 & 2033
- Table 13: Global Bioprocess Validation Market Revenue million Forecast, by End User 2020 & 2033
- Table 14: Global Bioprocess Validation Market Volume K Unit Forecast, by End User 2020 & 2033
- Table 15: Global Bioprocess Validation Market Revenue million Forecast, by Country 2020 & 2033
- Table 16: Global Bioprocess Validation Market Volume K Unit Forecast, by Country 2020 & 2033
- Table 17: United States Bioprocess Validation Market Revenue (million) Forecast, by Application 2020 & 2033
- Table 18: United States Bioprocess Validation Market Volume (K Unit) Forecast, by Application 2020 & 2033
- Table 19: Canada Bioprocess Validation Market Revenue (million) Forecast, by Application 2020 & 2033
- Table 20: Canada Bioprocess Validation Market Volume (K Unit) Forecast, by Application 2020 & 2033
- Table 21: Mexico Bioprocess Validation Market Revenue (million) Forecast, by Application 2020 & 2033
- Table 22: Mexico Bioprocess Validation Market Volume (K Unit) Forecast, by Application 2020 & 2033
- Table 23: Global Bioprocess Validation Market Revenue million Forecast, by Test Type 2020 & 2033
- Table 24: Global Bioprocess Validation Market Volume K Unit Forecast, by Test Type 2020 & 2033
- Table 25: Global Bioprocess Validation Market Revenue million Forecast, by Process Component 2020 & 2033
- Table 26: Global Bioprocess Validation Market Volume K Unit Forecast, by Process Component 2020 & 2033
- Table 27: Global Bioprocess Validation Market Revenue million Forecast, by End User 2020 & 2033
- Table 28: Global Bioprocess Validation Market Volume K Unit Forecast, by End User 2020 & 2033
- Table 29: Global Bioprocess Validation Market Revenue million Forecast, by Country 2020 & 2033
- Table 30: Global Bioprocess Validation Market Volume K Unit Forecast, by Country 2020 & 2033
- Table 31: Germany Bioprocess Validation Market Revenue (million) Forecast, by Application 2020 & 2033
- Table 32: Germany Bioprocess Validation Market Volume (K Unit) Forecast, by Application 2020 & 2033
- Table 33: United Kingdom Bioprocess Validation Market Revenue (million) Forecast, by Application 2020 & 2033
- Table 34: United Kingdom Bioprocess Validation Market Volume (K Unit) Forecast, by Application 2020 & 2033
- Table 35: France Bioprocess Validation Market Revenue (million) Forecast, by Application 2020 & 2033
- Table 36: France Bioprocess Validation Market Volume (K Unit) Forecast, by Application 2020 & 2033
- Table 37: Italy Bioprocess Validation Market Revenue (million) Forecast, by Application 2020 & 2033
- Table 38: Italy Bioprocess Validation Market Volume (K Unit) Forecast, by Application 2020 & 2033
- Table 39: Spain Bioprocess Validation Market Revenue (million) Forecast, by Application 2020 & 2033
- Table 40: Spain Bioprocess Validation Market Volume (K Unit) Forecast, by Application 2020 & 2033
- Table 41: Rest of Europe Bioprocess Validation Market Revenue (million) Forecast, by Application 2020 & 2033
- Table 42: Rest of Europe Bioprocess Validation Market Volume (K Unit) Forecast, by Application 2020 & 2033
- Table 43: Global Bioprocess Validation Market Revenue million Forecast, by Test Type 2020 & 2033
- Table 44: Global Bioprocess Validation Market Volume K Unit Forecast, by Test Type 2020 & 2033
- Table 45: Global Bioprocess Validation Market Revenue million Forecast, by Process Component 2020 & 2033
- Table 46: Global Bioprocess Validation Market Volume K Unit Forecast, by Process Component 2020 & 2033
- Table 47: Global Bioprocess Validation Market Revenue million Forecast, by End User 2020 & 2033
- Table 48: Global Bioprocess Validation Market Volume K Unit Forecast, by End User 2020 & 2033
- Table 49: Global Bioprocess Validation Market Revenue million Forecast, by Country 2020 & 2033
- Table 50: Global Bioprocess Validation Market Volume K Unit Forecast, by Country 2020 & 2033
- Table 51: China Bioprocess Validation Market Revenue (million) Forecast, by Application 2020 & 2033
- Table 52: China Bioprocess Validation Market Volume (K Unit) Forecast, by Application 2020 & 2033
- Table 53: Japan Bioprocess Validation Market Revenue (million) Forecast, by Application 2020 & 2033
- Table 54: Japan Bioprocess Validation Market Volume (K Unit) Forecast, by Application 2020 & 2033
- Table 55: India Bioprocess Validation Market Revenue (million) Forecast, by Application 2020 & 2033
- Table 56: India Bioprocess Validation Market Volume (K Unit) Forecast, by Application 2020 & 2033
- Table 57: Australia Bioprocess Validation Market Revenue (million) Forecast, by Application 2020 & 2033
- Table 58: Australia Bioprocess Validation Market Volume (K Unit) Forecast, by Application 2020 & 2033
- Table 59: South Korea Bioprocess Validation Market Revenue (million) Forecast, by Application 2020 & 2033
- Table 60: South Korea Bioprocess Validation Market Volume (K Unit) Forecast, by Application 2020 & 2033
- Table 61: Rest of Asia Pacific Bioprocess Validation Market Revenue (million) Forecast, by Application 2020 & 2033
- Table 62: Rest of Asia Pacific Bioprocess Validation Market Volume (K Unit) Forecast, by Application 2020 & 2033
- Table 63: Global Bioprocess Validation Market Revenue million Forecast, by Test Type 2020 & 2033
- Table 64: Global Bioprocess Validation Market Volume K Unit Forecast, by Test Type 2020 & 2033
- Table 65: Global Bioprocess Validation Market Revenue million Forecast, by Process Component 2020 & 2033
- Table 66: Global Bioprocess Validation Market Volume K Unit Forecast, by Process Component 2020 & 2033
- Table 67: Global Bioprocess Validation Market Revenue million Forecast, by End User 2020 & 2033
- Table 68: Global Bioprocess Validation Market Volume K Unit Forecast, by End User 2020 & 2033
- Table 69: Global Bioprocess Validation Market Revenue million Forecast, by Country 2020 & 2033
- Table 70: Global Bioprocess Validation Market Volume K Unit Forecast, by Country 2020 & 2033
- Table 71: GCC Bioprocess Validation Market Revenue (million) Forecast, by Application 2020 & 2033
- Table 72: GCC Bioprocess Validation Market Volume (K Unit) Forecast, by Application 2020 & 2033
- Table 73: South Africa Bioprocess Validation Market Revenue (million) Forecast, by Application 2020 & 2033
- Table 74: South Africa Bioprocess Validation Market Volume (K Unit) Forecast, by Application 2020 & 2033
- Table 75: Rest of Middle East and Africa Bioprocess Validation Market Revenue (million) Forecast, by Application 2020 & 2033
- Table 76: Rest of Middle East and Africa Bioprocess Validation Market Volume (K Unit) Forecast, by Application 2020 & 2033
- Table 77: Global Bioprocess Validation Market Revenue million Forecast, by Test Type 2020 & 2033
- Table 78: Global Bioprocess Validation Market Volume K Unit Forecast, by Test Type 2020 & 2033
- Table 79: Global Bioprocess Validation Market Revenue million Forecast, by Process Component 2020 & 2033
- Table 80: Global Bioprocess Validation Market Volume K Unit Forecast, by Process Component 2020 & 2033
- Table 81: Global Bioprocess Validation Market Revenue million Forecast, by End User 2020 & 2033
- Table 82: Global Bioprocess Validation Market Volume K Unit Forecast, by End User 2020 & 2033
- Table 83: Global Bioprocess Validation Market Revenue million Forecast, by Country 2020 & 2033
- Table 84: Global Bioprocess Validation Market Volume K Unit Forecast, by Country 2020 & 2033
- Table 85: Brazil Bioprocess Validation Market Revenue (million) Forecast, by Application 2020 & 2033
- Table 86: Brazil Bioprocess Validation Market Volume (K Unit) Forecast, by Application 2020 & 2033
- Table 87: Argentina Bioprocess Validation Market Revenue (million) Forecast, by Application 2020 & 2033
- Table 88: Argentina Bioprocess Validation Market Volume (K Unit) Forecast, by Application 2020 & 2033
- Table 89: Rest of South America Bioprocess Validation Market Revenue (million) Forecast, by Application 2020 & 2033
- Table 90: Rest of South America Bioprocess Validation Market Volume (K Unit) Forecast, by Application 2020 & 2033
Frequently Asked Questions
1. What is the projected Compound Annual Growth Rate (CAGR) of the Bioprocess Validation Market?
The projected CAGR is approximately 9.7%.
2. Which companies are prominent players in the Bioprocess Validation Market?
Key companies in the market include SGS S A, Meissner Filtration Products, Labcorp (Toxikon Corporation), Almac Group, Merck KGaA, Eurofins Scientific, Cobetter Filtration Equipments Co Ltd, Pall Corporation, Sartorius AG, Thermo Fisher Scientific, DOC S r l.
3. What are the main segments of the Bioprocess Validation Market?
The market segments include Test Type, Process Component, End User.
4. Can you provide details about the market size?
The market size is estimated to be USD 554.8 million as of 2022.
5. What are some drivers contributing to market growth?
Increasing Demand for Biopharmaceuticals; Increasing Demand for Outsourcing Bioprocess Validation; Rising Life Science R&D Expenditure.
6. What are the notable trends driving market growth?
Bioreactor Expected to Hold Significant Market Share.
7. Are there any restraints impacting market growth?
Issues Related to Extractables & Leachables.
8. Can you provide examples of recent developments in the market?
May 2022: Qosina launched its new Bioprocess Resource Center, an information source for the bioprocess industry.
9. What pricing options are available for accessing the report?
Pricing options include single-user, multi-user, and enterprise licenses priced at USD 4750, USD 5250, and USD 8750 respectively.
10. Is the market size provided in terms of value or volume?
The market size is provided in terms of value, measured in million and volume, measured in K Unit.
11. Are there any specific market keywords associated with the report?
Yes, the market keyword associated with the report is "Bioprocess Validation Market," which aids in identifying and referencing the specific market segment covered.
12. How do I determine which pricing option suits my needs best?
The pricing options vary based on user requirements and access needs. Individual users may opt for single-user licenses, while businesses requiring broader access may choose multi-user or enterprise licenses for cost-effective access to the report.
13. Are there any additional resources or data provided in the Bioprocess Validation Market report?
While the report offers comprehensive insights, it's advisable to review the specific contents or supplementary materials provided to ascertain if additional resources or data are available.
14. How can I stay updated on further developments or reports in the Bioprocess Validation Market?
To stay informed about further developments, trends, and reports in the Bioprocess Validation Market, consider subscribing to industry newsletters, following relevant companies and organizations, or regularly checking reputable industry news sources and publications.
Methodology
Step 1 - Identification of Relevant Samples Size from Population Database


Step 2 - Approaches for Defining Global Market Size (Value, Volume* & Price*)

Note*: In applicable scenarios
Step 3 - Data Sources
Primary Research
- Web Analytics
- Survey Reports
- Research Institute
- Latest Research Reports
- Opinion Leaders
Secondary Research
- Annual Reports
- White Paper
- Latest Press Release
- Industry Association
- Paid Database
- Investor Presentations

Step 4 - Data Triangulation
Involves using different sources of information in order to increase the validity of a study
These sources are likely to be stakeholders in a program - participants, other researchers, program staff, other community members, and so on.
Then we put all data in single framework & apply various statistical tools to find out the dynamic on the market.
During the analysis stage, feedback from the stakeholder groups would be compared to determine areas of agreement as well as areas of divergence