Future Trends Shaping Bio Insecticides Market Growth

Bio Insecticides Market by Production Analysis, by Consumption Analysis, by Import Market Analysis (Value & Volume), by Export Market Analysis (Value & Volume), by Price Trend Analysis, by North America (United States, Canada, Mexico), by South America (Brazil, Argentina, Rest of South America), by Europe (United Kingdom, Germany, France, Italy, Spain, Russia, Benelux, Nordics, Rest of Europe), by Middle East & Africa (Turkey, Israel, GCC, North Africa, South Africa, Rest of Middle East & Africa), by Asia Pacific (China, India, Japan, South Korea, ASEAN, Oceania, Rest of Asia Pacific) Forecast 2025-2033

Jun 26 2025
Base Year: 2024

234 Pages
Main Logo

Future Trends Shaping Bio Insecticides Market Growth


Home
Industries
Agriculture
sponsor image

Tailored for you

  • In-depth Analysis Tailored to Specified Regions or Segments
  • Company Profiles Customized to User Preferences
  • Comprehensive Insights Focused on Specific Segments or Regions
  • Customized Evaluation of Competitive Landscape to Meet Your Needs
  • Tailored Customization to Address Other Specific Requirements
Ask for customization


Key Insights

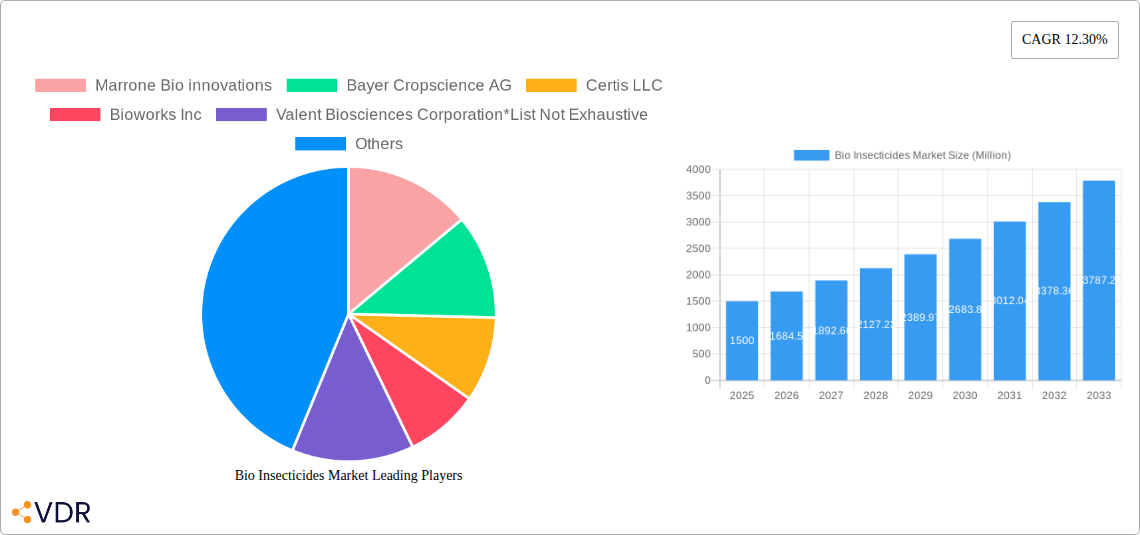
The global bio insecticides market is experiencing robust growth, projected to reach a substantial size by 2033, driven by a 12.30% CAGR from 2025 to 2033. This expansion is fueled by several key factors. Increasing consumer demand for organic and sustainably produced food is pushing farmers to adopt eco-friendly pest control solutions, reducing reliance on synthetic chemical pesticides. Growing awareness of the environmental and health risks associated with conventional insecticides, coupled with stricter government regulations on chemical pesticide usage, are further accelerating the adoption of bio insecticides. The market is segmented by application, with grains & cereals, pulses & oilseeds, and fruits & vegetables representing significant segments. Leading companies such as Marrone Bio Innovations, Bayer CropScience AG, and Corteva Agriscience are driving innovation and expanding market penetration through product development and strategic partnerships. Regional growth is expected to be geographically diverse, with North America and Europe leading initially, followed by strong growth in the Asia-Pacific region due to expanding agricultural practices and rising consumer awareness. Challenges remain, including the relatively higher cost of bio insecticides compared to chemical alternatives and the need for ongoing research and development to improve efficacy and shelf life. However, the long-term outlook for the bio insecticides market remains exceptionally positive, driven by the increasing demand for environmentally friendly agricultural practices and a growing global population requiring a sustainable food supply.

The diverse application segments within the bio insecticides market present opportunities for specialized product development. Companies are focusing on developing targeted bio insecticides for specific crops and pests, improving efficacy and reducing environmental impact. Technological advancements in formulation and delivery systems are further enhancing the competitiveness of bio insecticides. Furthermore, the integration of bio insecticides with other sustainable pest management strategies, such as integrated pest management (IPM) programs, is gaining traction, leading to holistic and more effective pest control solutions. The market's growth is also linked to increasing investments in research and development, leading to the discovery and development of novel bio insecticides with improved efficacy and broader application. The development of robust distribution networks and effective marketing strategies will be crucial for continued market growth and wider adoption of these environmentally friendly pest control solutions.

This comprehensive report provides an in-depth analysis of the Bio Insecticides Market, encompassing market dynamics, growth trends, regional dominance, product landscapes, key players, and future outlook. The study period spans from 2019 to 2033, with 2025 serving as the base and estimated year. The forecast period is 2025-2033, and the historical period covers 2019-2024. This report is crucial for industry professionals, investors, and stakeholders seeking to understand and capitalize on opportunities within this rapidly evolving market. The market size is projected to reach xx Million by 2033.

Bio Insecticides Market Research Report - Market Size, Growth & Forecast

Bio Insecticides Market Dynamics & Structure

This section analyzes the intricate structure of the bio insecticides market, exploring factors influencing its growth and evolution. Market concentration is currently moderate, with several key players holding significant shares. However, the market is witnessing increased fragmentation due to the entry of new players and startups. Technological innovation, particularly in areas like microbial control agents and RNA interference (RNAi) based insecticides, is a major driver. Stringent regulatory frameworks governing biopesticide approvals influence market access and growth. The market faces competition from conventional chemical insecticides, although the shift towards sustainable agriculture is favoring bio-insecticides. M&A activity is moderate, with larger players strategically acquiring smaller companies to expand their product portfolios and technological capabilities.

  • Market Concentration: Moderate, trending towards fragmentation (xx% top 5 players in 2025).
  • Technological Innovation: Significant advancements in microbial and RNAi-based bio insecticides.
  • Regulatory Frameworks: Stringent approval processes influence market access.
  • Competitive Substitutes: Conventional chemical insecticides remain a major competitor.
  • End-User Demographics: Growing adoption by environmentally conscious farmers and consumers.
  • M&A Trends: Moderate activity, with strategic acquisitions by major players (xx deals in 2019-2024).

Bio Insecticides Market Growth Trends & Insights

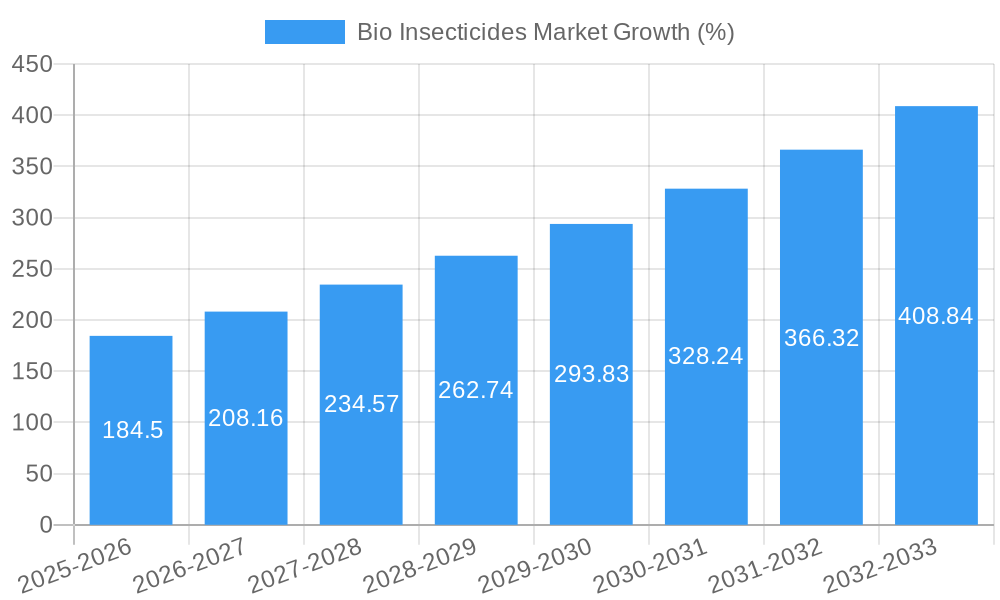
The Bio Insecticides market is experiencing robust growth driven by increasing consumer demand for organically produced food, stricter regulations on chemical pesticides, and growing awareness about environmental sustainability. The market size has shown a CAGR of xx% during the historical period (2019-2024) and is projected to maintain a CAGR of xx% during the forecast period (2025-2033). This growth is fueled by technological advancements, leading to the development of more effective and targeted bio-insecticides. Adoption rates are increasing across various agricultural segments, though penetration varies across regions. Consumer behavior shifts towards environmentally friendly products are creating a substantial pull for bio-insecticides.

(Note: This section requires data input from XXX to populate specific metrics and detailed analysis.)

Bio Insecticides Market Growth

Dominant Regions, Countries, or Segments in Bio Insecticides Market

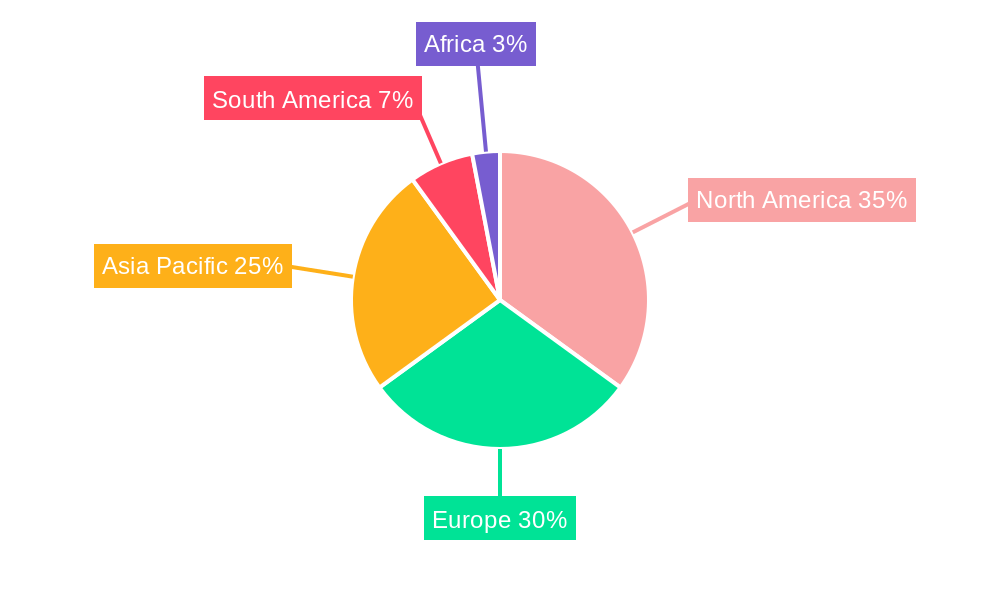
North America currently holds the largest market share in the bio insecticides market, driven by stringent regulations on chemical pesticides and high consumer demand for organic produce. However, Asia Pacific is projected to witness the fastest growth rate, fueled by expanding agricultural lands and increasing adoption of sustainable agricultural practices.

Application Segments:

  • Grains & Cereals: High adoption due to large acreage and susceptibility to pest infestations. Market size xx Million in 2025.
  • Pulses & Oilseeds: Growing demand for organic pulses and oilseeds is driving growth. Market size xx Million in 2025.
  • Commercial Crops: Significant adoption in cotton and other commercial crops. Market size xx Million in 2025.
  • Fruits & Vegetables: High demand for organic fruits and vegetables is boosting growth. Market size xx Million in 2025.
  • Other Applications: Includes ornamental plants and forestry, showing steady growth. Market size xx Million in 2025.

Key Drivers:

  • Favorable government policies and subsidies promoting sustainable agriculture.
  • Increasing awareness among farmers about the benefits of bio-insecticides.
  • Rising consumer preference for organic and pesticide-free food products.

Bio Insecticides Market Product Landscape

The bio insecticides market showcases a diverse product landscape encompassing microbial insecticides (bacteria, fungi, viruses), botanical insecticides derived from plants, and biopesticides based on pheromones and other natural compounds. Recent innovations focus on improving efficacy, shelf life, and application methods. Unique selling propositions include enhanced environmental friendliness, reduced pesticide residues, and targeted pest control. Technological advancements are enhancing the effectiveness and specificity of bio-insecticides, making them more competitive with chemical alternatives.

Key Drivers, Barriers & Challenges in Bio Insecticides Market

Key Drivers:

  • Growing consumer preference for organic food and reduced pesticide use.
  • Increasing stringency of regulations on chemical pesticides.
  • Rising awareness about environmental sustainability and reducing carbon footprint.

Key Challenges & Restraints:

  • Higher cost compared to conventional chemical insecticides.
  • Limited efficacy against certain pests compared to chemical alternatives.
  • Variable efficacy based on environmental factors (temperature, humidity, etc.).
  • Regulatory hurdles and lengthy approval processes.
  • Supply chain issues for raw materials and formulation components.

Emerging Opportunities in Bio Insecticides Market

Untapped markets in developing countries with expanding agricultural sectors represent significant opportunities. The development of novel bio-insecticides with enhanced efficacy and broader pest control capabilities presents lucrative prospects. Innovation in application technologies, such as targeted delivery systems, is another area of significant opportunity. Growing consumer awareness about eco-friendly products is expected to fuel market growth.

Growth Accelerators in the Bio Insecticides Market Industry

Technological breakthroughs in biopesticide development, including advances in genetic engineering and formulation technologies, are key growth accelerators. Strategic partnerships between biopesticide companies and agricultural input suppliers can accelerate market penetration. Market expansion strategies targeting underserved regions and crops will also significantly contribute to future growth.

Key Players Shaping the Bio Insecticides Market Market

  • Marrone Bio Innovations
  • Bayer Cropscience AG
  • Certis LLC
  • Bioworks Inc
  • Valent Biosciences Corporation
  • Isagro Spa
  • Corteva Agriscience
  • Novozymes AS
  • Koppert Biological Systems
  • BASF SE

Notable Milestones in Bio Insecticides Market Sector

  • 2021: Launch of a novel RNAi-based bio insecticide by Company X.
  • 2022: Acquisition of Company Y by Company Z, expanding product portfolio and market reach.
  • 2023: Regulatory approval of a new microbial biopesticide in major markets.
  • 2024: Significant investment in R&D for next-generation biopesticides.

In-Depth Bio Insecticides Market Market Outlook

The Bio Insecticides market is poised for significant growth in the coming years, driven by the factors outlined above. The increasing demand for organic products, stricter regulations on chemical pesticides, and growing environmental awareness will continue to create favorable conditions for market expansion. Strategic investments in R&D, along with strategic partnerships and market expansion initiatives, will shape the future trajectory of the market. The global shift towards sustainable agriculture positions bio insecticides as a vital component of a more environmentally responsible agricultural landscape.

Bio Insecticides Market Segmentation

  • 1. Production Analysis
  • 2. Consumption Analysis
  • 3. Import Market Analysis (Value & Volume)
  • 4. Export Market Analysis (Value & Volume)
  • 5. Price Trend Analysis

Bio Insecticides Market Segmentation By Geography

  • 1. North America
    • 1.1. United States
    • 1.2. Canada
    • 1.3. Mexico
  • 2. South America
    • 2.1. Brazil
    • 2.2. Argentina
    • 2.3. Rest of South America
  • 3. Europe
    • 3.1. United Kingdom
    • 3.2. Germany
    • 3.3. France
    • 3.4. Italy
    • 3.5. Spain
    • 3.6. Russia
    • 3.7. Benelux
    • 3.8. Nordics
    • 3.9. Rest of Europe
  • 4. Middle East & Africa
    • 4.1. Turkey
    • 4.2. Israel
    • 4.3. GCC
    • 4.4. North Africa
    • 4.5. South Africa
    • 4.6. Rest of Middle East & Africa
  • 5. Asia Pacific
    • 5.1. China
    • 5.2. India
    • 5.3. Japan
    • 5.4. South Korea
    • 5.5. ASEAN
    • 5.6. Oceania
    • 5.7. Rest of Asia Pacific
Bio Insecticides Market Regional Share


Bio Insecticides Market REPORT HIGHLIGHTS

AspectsDetails
Study Period 2019-2033
Base Year 2024
Estimated Year 2025
Forecast Period2025-2033
Historical Period2019-2024
Growth RateCAGR of 12.30% from 2019-2033
Segmentation
    • By Production Analysis
    • By Consumption Analysis
    • By Import Market Analysis (Value & Volume)
    • By Export Market Analysis (Value & Volume)
    • By Price Trend Analysis
  • By Geography
    • North America
      • United States
      • Canada
      • Mexico
    • South America
      • Brazil
      • Argentina
      • Rest of South America
    • Europe
      • United Kingdom
      • Germany
      • France
      • Italy
      • Spain
      • Russia
      • Benelux
      • Nordics
      • Rest of Europe
    • Middle East & Africa
      • Turkey
      • Israel
      • GCC
      • North Africa
      • South Africa
      • Rest of Middle East & Africa
    • Asia Pacific
      • China
      • India
      • Japan
      • South Korea
      • ASEAN
      • Oceania
      • Rest of Asia Pacific


Table of Contents

  1. 1. Introduction
    • 1.1. Research Scope
    • 1.2. Market Segmentation
    • 1.3. Research Methodology
    • 1.4. Definitions and Assumptions
  2. 2. Executive Summary
    • 2.1. Introduction
  3. 3. Market Dynamics
    • 3.1. Introduction
      • 3.2. Market Drivers
        • 3.2.1. Demand For Landscaping Maintenance; Adoption of Green Spaces and Green Roofs
      • 3.3. Market Restrains
        • 3.3.1. Shortage of Labor In Landscaping; High Maintenance Cost of Lawn Mowers
      • 3.4. Market Trends
        • 3.4.1. Fruits and Vegetables Occupy the Largest Share By Application
  4. 4. Market Factor Analysis
    • 4.1. Porters Five Forces
    • 4.2. Supply/Value Chain
    • 4.3. PESTEL analysis
    • 4.4. Market Entropy
    • 4.5. Patent/Trademark Analysis
  5. 5. Global Bio Insecticides Market Analysis, Insights and Forecast, 2019-2031
    • 5.1. Market Analysis, Insights and Forecast - by Production Analysis
      • 5.2. Market Analysis, Insights and Forecast - by Consumption Analysis
        • 5.3. Market Analysis, Insights and Forecast - by Import Market Analysis (Value & Volume)
          • 5.4. Market Analysis, Insights and Forecast - by Export Market Analysis (Value & Volume)
            • 5.5. Market Analysis, Insights and Forecast - by Price Trend Analysis
              • 5.6. Market Analysis, Insights and Forecast - by Region
                • 5.6.1. North America
                • 5.6.2. South America
                • 5.6.3. Europe
                • 5.6.4. Middle East & Africa
                • 5.6.5. Asia Pacific
            • 6. North America Bio Insecticides Market Analysis, Insights and Forecast, 2019-2031
              • 6.1. Market Analysis, Insights and Forecast - by Production Analysis
                • 6.2. Market Analysis, Insights and Forecast - by Consumption Analysis
                  • 6.3. Market Analysis, Insights and Forecast - by Import Market Analysis (Value & Volume)
                    • 6.4. Market Analysis, Insights and Forecast - by Export Market Analysis (Value & Volume)
                      • 6.5. Market Analysis, Insights and Forecast - by Price Trend Analysis
                      • 7. South America Bio Insecticides Market Analysis, Insights and Forecast, 2019-2031
                        • 7.1. Market Analysis, Insights and Forecast - by Production Analysis
                          • 7.2. Market Analysis, Insights and Forecast - by Consumption Analysis
                            • 7.3. Market Analysis, Insights and Forecast - by Import Market Analysis (Value & Volume)
                              • 7.4. Market Analysis, Insights and Forecast - by Export Market Analysis (Value & Volume)
                                • 7.5. Market Analysis, Insights and Forecast - by Price Trend Analysis
                                • 8. Europe Bio Insecticides Market Analysis, Insights and Forecast, 2019-2031
                                  • 8.1. Market Analysis, Insights and Forecast - by Production Analysis
                                    • 8.2. Market Analysis, Insights and Forecast - by Consumption Analysis
                                      • 8.3. Market Analysis, Insights and Forecast - by Import Market Analysis (Value & Volume)
                                        • 8.4. Market Analysis, Insights and Forecast - by Export Market Analysis (Value & Volume)
                                          • 8.5. Market Analysis, Insights and Forecast - by Price Trend Analysis
                                          • 9. Middle East & Africa Bio Insecticides Market Analysis, Insights and Forecast, 2019-2031
                                            • 9.1. Market Analysis, Insights and Forecast - by Production Analysis
                                              • 9.2. Market Analysis, Insights and Forecast - by Consumption Analysis
                                                • 9.3. Market Analysis, Insights and Forecast - by Import Market Analysis (Value & Volume)
                                                  • 9.4. Market Analysis, Insights and Forecast - by Export Market Analysis (Value & Volume)
                                                    • 9.5. Market Analysis, Insights and Forecast - by Price Trend Analysis
                                                    • 10. Asia Pacific Bio Insecticides Market Analysis, Insights and Forecast, 2019-2031
                                                      • 10.1. Market Analysis, Insights and Forecast - by Production Analysis
                                                        • 10.2. Market Analysis, Insights and Forecast - by Consumption Analysis
                                                          • 10.3. Market Analysis, Insights and Forecast - by Import Market Analysis (Value & Volume)
                                                            • 10.4. Market Analysis, Insights and Forecast - by Export Market Analysis (Value & Volume)
                                                              • 10.5. Market Analysis, Insights and Forecast - by Price Trend Analysis
                                                              • 11. North America Bio Insecticides Market Analysis, Insights and Forecast, 2019-2031
                                                                  • 11.1. Market Analysis, Insights and Forecast - By Country/Sub-region
                                                                    • 11.1.1 United States
                                                                    • 11.1.2 Canada
                                                                    • 11.1.3 Mexico
                                                                    • 11.1.4 Rest of North America
                                                              • 12. Europe Bio Insecticides Market Analysis, Insights and Forecast, 2019-2031
                                                                  • 12.1. Market Analysis, Insights and Forecast - By Country/Sub-region
                                                                    • 12.1.1 Germany
                                                                    • 12.1.2 United Kingdom
                                                                    • 12.1.3 France
                                                                    • 12.1.4 Spain
                                                                    • 12.1.5 Italy
                                                                    • 12.1.6 Russia
                                                                    • 12.1.7 Rest of Europe
                                                              • 13. Asia Pacific Bio Insecticides Market Analysis, Insights and Forecast, 2019-2031
                                                                  • 13.1. Market Analysis, Insights and Forecast - By Country/Sub-region
                                                                    • 13.1.1 China
                                                                    • 13.1.2 India
                                                                    • 13.1.3 Japan
                                                                    • 13.1.4 Australia
                                                                    • 13.1.5 Rest of Asia Pacific
                                                              • 14. South America Bio Insecticides Market Analysis, Insights and Forecast, 2019-2031
                                                                  • 14.1. Market Analysis, Insights and Forecast - By Country/Sub-region
                                                                    • 14.1.1 Brazil
                                                                    • 14.1.2 Argentina
                                                                    • 14.1.3 Rest of South America
                                                              • 15. Africa Bio Insecticides Market Analysis, Insights and Forecast, 2019-2031
                                                                  • 15.1. Market Analysis, Insights and Forecast - By Country/Sub-region
                                                                    • 15.1.1 South Africa
                                                                    • 15.1.2 Rest of Africa
                                                              • 16. Competitive Analysis
                                                                • 16.1. Global Market Share Analysis 2024
                                                                  • 16.2. Company Profiles
                                                                    • 16.2.1 Marrone Bio innovations
                                                                      • 16.2.1.1. Overview
                                                                      • 16.2.1.2. Products
                                                                      • 16.2.1.3. SWOT Analysis
                                                                      • 16.2.1.4. Recent Developments
                                                                      • 16.2.1.5. Financials (Based on Availability)
                                                                    • 16.2.2 Bayer Cropscience AG
                                                                      • 16.2.2.1. Overview
                                                                      • 16.2.2.2. Products
                                                                      • 16.2.2.3. SWOT Analysis
                                                                      • 16.2.2.4. Recent Developments
                                                                      • 16.2.2.5. Financials (Based on Availability)
                                                                    • 16.2.3 Certis LLC
                                                                      • 16.2.3.1. Overview
                                                                      • 16.2.3.2. Products
                                                                      • 16.2.3.3. SWOT Analysis
                                                                      • 16.2.3.4. Recent Developments
                                                                      • 16.2.3.5. Financials (Based on Availability)
                                                                    • 16.2.4 Bioworks Inc
                                                                      • 16.2.4.1. Overview
                                                                      • 16.2.4.2. Products
                                                                      • 16.2.4.3. SWOT Analysis
                                                                      • 16.2.4.4. Recent Developments
                                                                      • 16.2.4.5. Financials (Based on Availability)
                                                                    • 16.2.5 Valent Biosciences Corporation*List Not Exhaustive
                                                                      • 16.2.5.1. Overview
                                                                      • 16.2.5.2. Products
                                                                      • 16.2.5.3. SWOT Analysis
                                                                      • 16.2.5.4. Recent Developments
                                                                      • 16.2.5.5. Financials (Based on Availability)
                                                                    • 16.2.6 Isagro Spa
                                                                      • 16.2.6.1. Overview
                                                                      • 16.2.6.2. Products
                                                                      • 16.2.6.3. SWOT Analysis
                                                                      • 16.2.6.4. Recent Developments
                                                                      • 16.2.6.5. Financials (Based on Availability)
                                                                    • 16.2.7 Corteva Agriscience
                                                                      • 16.2.7.1. Overview
                                                                      • 16.2.7.2. Products
                                                                      • 16.2.7.3. SWOT Analysis
                                                                      • 16.2.7.4. Recent Developments
                                                                      • 16.2.7.5. Financials (Based on Availability)
                                                                    • 16.2.8 Novozymes AS
                                                                      • 16.2.8.1. Overview
                                                                      • 16.2.8.2. Products
                                                                      • 16.2.8.3. SWOT Analysis
                                                                      • 16.2.8.4. Recent Developments
                                                                      • 16.2.8.5. Financials (Based on Availability)
                                                                    • 16.2.9 Koppert Biological Systems
                                                                      • 16.2.9.1. Overview
                                                                      • 16.2.9.2. Products
                                                                      • 16.2.9.3. SWOT Analysis
                                                                      • 16.2.9.4. Recent Developments
                                                                      • 16.2.9.5. Financials (Based on Availability)
                                                                    • 16.2.10 BASF SE
                                                                      • 16.2.10.1. Overview
                                                                      • 16.2.10.2. Products
                                                                      • 16.2.10.3. SWOT Analysis
                                                                      • 16.2.10.4. Recent Developments
                                                                      • 16.2.10.5. Financials (Based on Availability)

                                                              List of Figures

                                                              1. Figure 1: Global Bio Insecticides Market Revenue Breakdown (Million, %) by Region 2024 & 2032
                                                              2. Figure 2: North America Bio Insecticides Market Revenue (Million), by Country 2024 & 2032
                                                              3. Figure 3: North America Bio Insecticides Market Revenue Share (%), by Country 2024 & 2032
                                                              4. Figure 4: Europe Bio Insecticides Market Revenue (Million), by Country 2024 & 2032
                                                              5. Figure 5: Europe Bio Insecticides Market Revenue Share (%), by Country 2024 & 2032
                                                              6. Figure 6: Asia Pacific Bio Insecticides Market Revenue (Million), by Country 2024 & 2032
                                                              7. Figure 7: Asia Pacific Bio Insecticides Market Revenue Share (%), by Country 2024 & 2032
                                                              8. Figure 8: South America Bio Insecticides Market Revenue (Million), by Country 2024 & 2032
                                                              9. Figure 9: South America Bio Insecticides Market Revenue Share (%), by Country 2024 & 2032
                                                              10. Figure 10: Africa Bio Insecticides Market Revenue (Million), by Country 2024 & 2032
                                                              11. Figure 11: Africa Bio Insecticides Market Revenue Share (%), by Country 2024 & 2032
                                                              12. Figure 12: North America Bio Insecticides Market Revenue (Million), by Production Analysis 2024 & 2032
                                                              13. Figure 13: North America Bio Insecticides Market Revenue Share (%), by Production Analysis 2024 & 2032
                                                              14. Figure 14: North America Bio Insecticides Market Revenue (Million), by Consumption Analysis 2024 & 2032
                                                              15. Figure 15: North America Bio Insecticides Market Revenue Share (%), by Consumption Analysis 2024 & 2032
                                                              16. Figure 16: North America Bio Insecticides Market Revenue (Million), by Import Market Analysis (Value & Volume) 2024 & 2032
                                                              17. Figure 17: North America Bio Insecticides Market Revenue Share (%), by Import Market Analysis (Value & Volume) 2024 & 2032
                                                              18. Figure 18: North America Bio Insecticides Market Revenue (Million), by Export Market Analysis (Value & Volume) 2024 & 2032
                                                              19. Figure 19: North America Bio Insecticides Market Revenue Share (%), by Export Market Analysis (Value & Volume) 2024 & 2032
                                                              20. Figure 20: North America Bio Insecticides Market Revenue (Million), by Price Trend Analysis 2024 & 2032
                                                              21. Figure 21: North America Bio Insecticides Market Revenue Share (%), by Price Trend Analysis 2024 & 2032
                                                              22. Figure 22: North America Bio Insecticides Market Revenue (Million), by Country 2024 & 2032
                                                              23. Figure 23: North America Bio Insecticides Market Revenue Share (%), by Country 2024 & 2032
                                                              24. Figure 24: South America Bio Insecticides Market Revenue (Million), by Production Analysis 2024 & 2032
                                                              25. Figure 25: South America Bio Insecticides Market Revenue Share (%), by Production Analysis 2024 & 2032
                                                              26. Figure 26: South America Bio Insecticides Market Revenue (Million), by Consumption Analysis 2024 & 2032
                                                              27. Figure 27: South America Bio Insecticides Market Revenue Share (%), by Consumption Analysis 2024 & 2032
                                                              28. Figure 28: South America Bio Insecticides Market Revenue (Million), by Import Market Analysis (Value & Volume) 2024 & 2032
                                                              29. Figure 29: South America Bio Insecticides Market Revenue Share (%), by Import Market Analysis (Value & Volume) 2024 & 2032
                                                              30. Figure 30: South America Bio Insecticides Market Revenue (Million), by Export Market Analysis (Value & Volume) 2024 & 2032
                                                              31. Figure 31: South America Bio Insecticides Market Revenue Share (%), by Export Market Analysis (Value & Volume) 2024 & 2032
                                                              32. Figure 32: South America Bio Insecticides Market Revenue (Million), by Price Trend Analysis 2024 & 2032
                                                              33. Figure 33: South America Bio Insecticides Market Revenue Share (%), by Price Trend Analysis 2024 & 2032
                                                              34. Figure 34: South America Bio Insecticides Market Revenue (Million), by Country 2024 & 2032
                                                              35. Figure 35: South America Bio Insecticides Market Revenue Share (%), by Country 2024 & 2032
                                                              36. Figure 36: Europe Bio Insecticides Market Revenue (Million), by Production Analysis 2024 & 2032
                                                              37. Figure 37: Europe Bio Insecticides Market Revenue Share (%), by Production Analysis 2024 & 2032
                                                              38. Figure 38: Europe Bio Insecticides Market Revenue (Million), by Consumption Analysis 2024 & 2032
                                                              39. Figure 39: Europe Bio Insecticides Market Revenue Share (%), by Consumption Analysis 2024 & 2032
                                                              40. Figure 40: Europe Bio Insecticides Market Revenue (Million), by Import Market Analysis (Value & Volume) 2024 & 2032
                                                              41. Figure 41: Europe Bio Insecticides Market Revenue Share (%), by Import Market Analysis (Value & Volume) 2024 & 2032
                                                              42. Figure 42: Europe Bio Insecticides Market Revenue (Million), by Export Market Analysis (Value & Volume) 2024 & 2032
                                                              43. Figure 43: Europe Bio Insecticides Market Revenue Share (%), by Export Market Analysis (Value & Volume) 2024 & 2032
                                                              44. Figure 44: Europe Bio Insecticides Market Revenue (Million), by Price Trend Analysis 2024 & 2032
                                                              45. Figure 45: Europe Bio Insecticides Market Revenue Share (%), by Price Trend Analysis 2024 & 2032
                                                              46. Figure 46: Europe Bio Insecticides Market Revenue (Million), by Country 2024 & 2032
                                                              47. Figure 47: Europe Bio Insecticides Market Revenue Share (%), by Country 2024 & 2032
                                                              48. Figure 48: Middle East & Africa Bio Insecticides Market Revenue (Million), by Production Analysis 2024 & 2032
                                                              49. Figure 49: Middle East & Africa Bio Insecticides Market Revenue Share (%), by Production Analysis 2024 & 2032
                                                              50. Figure 50: Middle East & Africa Bio Insecticides Market Revenue (Million), by Consumption Analysis 2024 & 2032
                                                              51. Figure 51: Middle East & Africa Bio Insecticides Market Revenue Share (%), by Consumption Analysis 2024 & 2032
                                                              52. Figure 52: Middle East & Africa Bio Insecticides Market Revenue (Million), by Import Market Analysis (Value & Volume) 2024 & 2032
                                                              53. Figure 53: Middle East & Africa Bio Insecticides Market Revenue Share (%), by Import Market Analysis (Value & Volume) 2024 & 2032
                                                              54. Figure 54: Middle East & Africa Bio Insecticides Market Revenue (Million), by Export Market Analysis (Value & Volume) 2024 & 2032
                                                              55. Figure 55: Middle East & Africa Bio Insecticides Market Revenue Share (%), by Export Market Analysis (Value & Volume) 2024 & 2032
                                                              56. Figure 56: Middle East & Africa Bio Insecticides Market Revenue (Million), by Price Trend Analysis 2024 & 2032
                                                              57. Figure 57: Middle East & Africa Bio Insecticides Market Revenue Share (%), by Price Trend Analysis 2024 & 2032
                                                              58. Figure 58: Middle East & Africa Bio Insecticides Market Revenue (Million), by Country 2024 & 2032
                                                              59. Figure 59: Middle East & Africa Bio Insecticides Market Revenue Share (%), by Country 2024 & 2032
                                                              60. Figure 60: Asia Pacific Bio Insecticides Market Revenue (Million), by Production Analysis 2024 & 2032
                                                              61. Figure 61: Asia Pacific Bio Insecticides Market Revenue Share (%), by Production Analysis 2024 & 2032
                                                              62. Figure 62: Asia Pacific Bio Insecticides Market Revenue (Million), by Consumption Analysis 2024 & 2032
                                                              63. Figure 63: Asia Pacific Bio Insecticides Market Revenue Share (%), by Consumption Analysis 2024 & 2032
                                                              64. Figure 64: Asia Pacific Bio Insecticides Market Revenue (Million), by Import Market Analysis (Value & Volume) 2024 & 2032
                                                              65. Figure 65: Asia Pacific Bio Insecticides Market Revenue Share (%), by Import Market Analysis (Value & Volume) 2024 & 2032
                                                              66. Figure 66: Asia Pacific Bio Insecticides Market Revenue (Million), by Export Market Analysis (Value & Volume) 2024 & 2032
                                                              67. Figure 67: Asia Pacific Bio Insecticides Market Revenue Share (%), by Export Market Analysis (Value & Volume) 2024 & 2032
                                                              68. Figure 68: Asia Pacific Bio Insecticides Market Revenue (Million), by Price Trend Analysis 2024 & 2032
                                                              69. Figure 69: Asia Pacific Bio Insecticides Market Revenue Share (%), by Price Trend Analysis 2024 & 2032
                                                              70. Figure 70: Asia Pacific Bio Insecticides Market Revenue (Million), by Country 2024 & 2032
                                                              71. Figure 71: Asia Pacific Bio Insecticides Market Revenue Share (%), by Country 2024 & 2032

                                                              List of Tables

                                                              1. Table 1: Global Bio Insecticides Market Revenue Million Forecast, by Region 2019 & 2032
                                                              2. Table 2: Global Bio Insecticides Market Revenue Million Forecast, by Production Analysis 2019 & 2032
                                                              3. Table 3: Global Bio Insecticides Market Revenue Million Forecast, by Consumption Analysis 2019 & 2032
                                                              4. Table 4: Global Bio Insecticides Market Revenue Million Forecast, by Import Market Analysis (Value & Volume) 2019 & 2032
                                                              5. Table 5: Global Bio Insecticides Market Revenue Million Forecast, by Export Market Analysis (Value & Volume) 2019 & 2032
                                                              6. Table 6: Global Bio Insecticides Market Revenue Million Forecast, by Price Trend Analysis 2019 & 2032
                                                              7. Table 7: Global Bio Insecticides Market Revenue Million Forecast, by Region 2019 & 2032
                                                              8. Table 8: Global Bio Insecticides Market Revenue Million Forecast, by Country 2019 & 2032
                                                              9. Table 9: United States Bio Insecticides Market Revenue (Million) Forecast, by Application 2019 & 2032
                                                              10. Table 10: Canada Bio Insecticides Market Revenue (Million) Forecast, by Application 2019 & 2032
                                                              11. Table 11: Mexico Bio Insecticides Market Revenue (Million) Forecast, by Application 2019 & 2032
                                                              12. Table 12: Rest of North America Bio Insecticides Market Revenue (Million) Forecast, by Application 2019 & 2032
                                                              13. Table 13: Global Bio Insecticides Market Revenue Million Forecast, by Country 2019 & 2032
                                                              14. Table 14: Germany Bio Insecticides Market Revenue (Million) Forecast, by Application 2019 & 2032
                                                              15. Table 15: United Kingdom Bio Insecticides Market Revenue (Million) Forecast, by Application 2019 & 2032
                                                              16. Table 16: France Bio Insecticides Market Revenue (Million) Forecast, by Application 2019 & 2032
                                                              17. Table 17: Spain Bio Insecticides Market Revenue (Million) Forecast, by Application 2019 & 2032
                                                              18. Table 18: Italy Bio Insecticides Market Revenue (Million) Forecast, by Application 2019 & 2032
                                                              19. Table 19: Russia Bio Insecticides Market Revenue (Million) Forecast, by Application 2019 & 2032
                                                              20. Table 20: Rest of Europe Bio Insecticides Market Revenue (Million) Forecast, by Application 2019 & 2032
                                                              21. Table 21: Global Bio Insecticides Market Revenue Million Forecast, by Country 2019 & 2032
                                                              22. Table 22: China Bio Insecticides Market Revenue (Million) Forecast, by Application 2019 & 2032
                                                              23. Table 23: India Bio Insecticides Market Revenue (Million) Forecast, by Application 2019 & 2032
                                                              24. Table 24: Japan Bio Insecticides Market Revenue (Million) Forecast, by Application 2019 & 2032
                                                              25. Table 25: Australia Bio Insecticides Market Revenue (Million) Forecast, by Application 2019 & 2032
                                                              26. Table 26: Rest of Asia Pacific Bio Insecticides Market Revenue (Million) Forecast, by Application 2019 & 2032
                                                              27. Table 27: Global Bio Insecticides Market Revenue Million Forecast, by Country 2019 & 2032
                                                              28. Table 28: Brazil Bio Insecticides Market Revenue (Million) Forecast, by Application 2019 & 2032
                                                              29. Table 29: Argentina Bio Insecticides Market Revenue (Million) Forecast, by Application 2019 & 2032
                                                              30. Table 30: Rest of South America Bio Insecticides Market Revenue (Million) Forecast, by Application 2019 & 2032
                                                              31. Table 31: Global Bio Insecticides Market Revenue Million Forecast, by Country 2019 & 2032
                                                              32. Table 32: South Africa Bio Insecticides Market Revenue (Million) Forecast, by Application 2019 & 2032
                                                              33. Table 33: Rest of Africa Bio Insecticides Market Revenue (Million) Forecast, by Application 2019 & 2032
                                                              34. Table 34: Global Bio Insecticides Market Revenue Million Forecast, by Production Analysis 2019 & 2032
                                                              35. Table 35: Global Bio Insecticides Market Revenue Million Forecast, by Consumption Analysis 2019 & 2032
                                                              36. Table 36: Global Bio Insecticides Market Revenue Million Forecast, by Import Market Analysis (Value & Volume) 2019 & 2032
                                                              37. Table 37: Global Bio Insecticides Market Revenue Million Forecast, by Export Market Analysis (Value & Volume) 2019 & 2032
                                                              38. Table 38: Global Bio Insecticides Market Revenue Million Forecast, by Price Trend Analysis 2019 & 2032
                                                              39. Table 39: Global Bio Insecticides Market Revenue Million Forecast, by Country 2019 & 2032
                                                              40. Table 40: United States Bio Insecticides Market Revenue (Million) Forecast, by Application 2019 & 2032
                                                              41. Table 41: Canada Bio Insecticides Market Revenue (Million) Forecast, by Application 2019 & 2032
                                                              42. Table 42: Mexico Bio Insecticides Market Revenue (Million) Forecast, by Application 2019 & 2032
                                                              43. Table 43: Global Bio Insecticides Market Revenue Million Forecast, by Production Analysis 2019 & 2032
                                                              44. Table 44: Global Bio Insecticides Market Revenue Million Forecast, by Consumption Analysis 2019 & 2032
                                                              45. Table 45: Global Bio Insecticides Market Revenue Million Forecast, by Import Market Analysis (Value & Volume) 2019 & 2032
                                                              46. Table 46: Global Bio Insecticides Market Revenue Million Forecast, by Export Market Analysis (Value & Volume) 2019 & 2032
                                                              47. Table 47: Global Bio Insecticides Market Revenue Million Forecast, by Price Trend Analysis 2019 & 2032
                                                              48. Table 48: Global Bio Insecticides Market Revenue Million Forecast, by Country 2019 & 2032
                                                              49. Table 49: Brazil Bio Insecticides Market Revenue (Million) Forecast, by Application 2019 & 2032
                                                              50. Table 50: Argentina Bio Insecticides Market Revenue (Million) Forecast, by Application 2019 & 2032
                                                              51. Table 51: Rest of South America Bio Insecticides Market Revenue (Million) Forecast, by Application 2019 & 2032
                                                              52. Table 52: Global Bio Insecticides Market Revenue Million Forecast, by Production Analysis 2019 & 2032
                                                              53. Table 53: Global Bio Insecticides Market Revenue Million Forecast, by Consumption Analysis 2019 & 2032
                                                              54. Table 54: Global Bio Insecticides Market Revenue Million Forecast, by Import Market Analysis (Value & Volume) 2019 & 2032
                                                              55. Table 55: Global Bio Insecticides Market Revenue Million Forecast, by Export Market Analysis (Value & Volume) 2019 & 2032
                                                              56. Table 56: Global Bio Insecticides Market Revenue Million Forecast, by Price Trend Analysis 2019 & 2032
                                                              57. Table 57: Global Bio Insecticides Market Revenue Million Forecast, by Country 2019 & 2032
                                                              58. Table 58: United Kingdom Bio Insecticides Market Revenue (Million) Forecast, by Application 2019 & 2032
                                                              59. Table 59: Germany Bio Insecticides Market Revenue (Million) Forecast, by Application 2019 & 2032
                                                              60. Table 60: France Bio Insecticides Market Revenue (Million) Forecast, by Application 2019 & 2032
                                                              61. Table 61: Italy Bio Insecticides Market Revenue (Million) Forecast, by Application 2019 & 2032
                                                              62. Table 62: Spain Bio Insecticides Market Revenue (Million) Forecast, by Application 2019 & 2032
                                                              63. Table 63: Russia Bio Insecticides Market Revenue (Million) Forecast, by Application 2019 & 2032
                                                              64. Table 64: Benelux Bio Insecticides Market Revenue (Million) Forecast, by Application 2019 & 2032
                                                              65. Table 65: Nordics Bio Insecticides Market Revenue (Million) Forecast, by Application 2019 & 2032
                                                              66. Table 66: Rest of Europe Bio Insecticides Market Revenue (Million) Forecast, by Application 2019 & 2032
                                                              67. Table 67: Global Bio Insecticides Market Revenue Million Forecast, by Production Analysis 2019 & 2032
                                                              68. Table 68: Global Bio Insecticides Market Revenue Million Forecast, by Consumption Analysis 2019 & 2032
                                                              69. Table 69: Global Bio Insecticides Market Revenue Million Forecast, by Import Market Analysis (Value & Volume) 2019 & 2032
                                                              70. Table 70: Global Bio Insecticides Market Revenue Million Forecast, by Export Market Analysis (Value & Volume) 2019 & 2032
                                                              71. Table 71: Global Bio Insecticides Market Revenue Million Forecast, by Price Trend Analysis 2019 & 2032
                                                              72. Table 72: Global Bio Insecticides Market Revenue Million Forecast, by Country 2019 & 2032
                                                              73. Table 73: Turkey Bio Insecticides Market Revenue (Million) Forecast, by Application 2019 & 2032
                                                              74. Table 74: Israel Bio Insecticides Market Revenue (Million) Forecast, by Application 2019 & 2032
                                                              75. Table 75: GCC Bio Insecticides Market Revenue (Million) Forecast, by Application 2019 & 2032
                                                              76. Table 76: North Africa Bio Insecticides Market Revenue (Million) Forecast, by Application 2019 & 2032
                                                              77. Table 77: South Africa Bio Insecticides Market Revenue (Million) Forecast, by Application 2019 & 2032
                                                              78. Table 78: Rest of Middle East & Africa Bio Insecticides Market Revenue (Million) Forecast, by Application 2019 & 2032
                                                              79. Table 79: Global Bio Insecticides Market Revenue Million Forecast, by Production Analysis 2019 & 2032
                                                              80. Table 80: Global Bio Insecticides Market Revenue Million Forecast, by Consumption Analysis 2019 & 2032
                                                              81. Table 81: Global Bio Insecticides Market Revenue Million Forecast, by Import Market Analysis (Value & Volume) 2019 & 2032
                                                              82. Table 82: Global Bio Insecticides Market Revenue Million Forecast, by Export Market Analysis (Value & Volume) 2019 & 2032
                                                              83. Table 83: Global Bio Insecticides Market Revenue Million Forecast, by Price Trend Analysis 2019 & 2032
                                                              84. Table 84: Global Bio Insecticides Market Revenue Million Forecast, by Country 2019 & 2032
                                                              85. Table 85: China Bio Insecticides Market Revenue (Million) Forecast, by Application 2019 & 2032
                                                              86. Table 86: India Bio Insecticides Market Revenue (Million) Forecast, by Application 2019 & 2032
                                                              87. Table 87: Japan Bio Insecticides Market Revenue (Million) Forecast, by Application 2019 & 2032
                                                              88. Table 88: South Korea Bio Insecticides Market Revenue (Million) Forecast, by Application 2019 & 2032
                                                              89. Table 89: ASEAN Bio Insecticides Market Revenue (Million) Forecast, by Application 2019 & 2032
                                                              90. Table 90: Oceania Bio Insecticides Market Revenue (Million) Forecast, by Application 2019 & 2032
                                                              91. Table 91: Rest of Asia Pacific Bio Insecticides Market Revenue (Million) Forecast, by Application 2019 & 2032


                                                              Frequently Asked Questions

                                                              1. What is the projected Compound Annual Growth Rate (CAGR) of the Bio Insecticides Market?

                                                              The projected CAGR is approximately 12.30%.

                                                              2. Which companies are prominent players in the Bio Insecticides Market?

                                                              Key companies in the market include Marrone Bio innovations, Bayer Cropscience AG, Certis LLC, Bioworks Inc, Valent Biosciences Corporation*List Not Exhaustive, Isagro Spa, Corteva Agriscience, Novozymes AS, Koppert Biological Systems, BASF SE.

                                                              3. What are the main segments of the Bio Insecticides Market?

                                                              The market segments include Production Analysis, Consumption Analysis, Import Market Analysis (Value & Volume), Export Market Analysis (Value & Volume), Price Trend Analysis.

                                                              4. Can you provide details about the market size?

                                                              The market size is estimated to be USD XX Million as of 2022.

                                                              5. What are some drivers contributing to market growth?

                                                              Demand For Landscaping Maintenance; Adoption of Green Spaces and Green Roofs.

                                                              6. What are the notable trends driving market growth?

                                                              Fruits and Vegetables Occupy the Largest Share By Application.

                                                              7. Are there any restraints impacting market growth?

                                                              Shortage of Labor In Landscaping; High Maintenance Cost of Lawn Mowers.

                                                              8. Can you provide examples of recent developments in the market?

                                                              N/A

                                                              9. What pricing options are available for accessing the report?

                                                              Pricing options include single-user, multi-user, and enterprise licenses priced at USD 4750, USD 5250, and USD 8750 respectively.

                                                              10. Is the market size provided in terms of value or volume?

                                                              The market size is provided in terms of value, measured in Million.

                                                              11. Are there any specific market keywords associated with the report?

                                                              Yes, the market keyword associated with the report is "Bio Insecticides Market," which aids in identifying and referencing the specific market segment covered.

                                                              12. How do I determine which pricing option suits my needs best?

                                                              The pricing options vary based on user requirements and access needs. Individual users may opt for single-user licenses, while businesses requiring broader access may choose multi-user or enterprise licenses for cost-effective access to the report.

                                                              13. Are there any additional resources or data provided in the Bio Insecticides Market report?

                                                              While the report offers comprehensive insights, it's advisable to review the specific contents or supplementary materials provided to ascertain if additional resources or data are available.

                                                              14. How can I stay updated on further developments or reports in the Bio Insecticides Market?

                                                              To stay informed about further developments, trends, and reports in the Bio Insecticides Market, consider subscribing to industry newsletters, following relevant companies and organizations, or regularly checking reputable industry news sources and publications.


                                                              Methodology

                                                              Step 1 - Identification of Relevant Samples Size from Population Database

                                                              Step Chart
                                                              Bar Chart
                                                              Method Chart

                                                              Step 2 - Approaches for Defining Global Market Size (Value, Volume* & Price*)

                                                              Approach Chart
                                                              Top-down and bottom-up approaches are used to validate the global market size and estimate the market size for manufactures, regional segments, product, and application.

                                                              Note*: In applicable scenarios

                                                              Step 3 - Data Sources

                                                              Primary Research

                                                              • Web Analytics
                                                              • Survey Reports
                                                              • Research Institute
                                                              • Latest Research Reports
                                                              • Opinion Leaders

                                                              Secondary Research

                                                              • Annual Reports
                                                              • White Paper
                                                              • Latest Press Release
                                                              • Industry Association
                                                              • Paid Database
                                                              • Investor Presentations
                                                              Analyst Chart

                                                              Step 4 - Data Triangulation

                                                              Involves using different sources of information in order to increase the validity of a study

                                                              These sources are likely to be stakeholders in a program - participants, other researchers, program staff, other community members, and so on.

                                                              Then we put all data in single framework & apply various statistical tools to find out the dynamic on the market.

                                                              During the analysis stage, feedback from the stakeholder groups would be compared to determine areas of agreement as well as areas of divergence

                                                              Additionally, after gathering mixed and scattered data from a wide range of sources, data is triangulated and correlated to come up with estimated figures which are further validated through primary mediums or industry experts, opinion leaders.

                                                              About Visionary Data Reports

                                                              Visionary Data Reports provides future-focused market research, advanced analytics, and strategic insights for technology, healthcare, green energy, and finance. Our reports help you anticipate trends, innovate, and lead in your industry. Our expert team combines primary research, data science, and industry knowledge to deliver actionable intelligence. We offer syndicated reports, custom analytics, and consulting services tailored to your business needs. At Visionary Data Reports, we are committed to quality, transparency, and client satisfaction. Every report is rigorously validated to ensure accuracy and relevance. Our global perspective and forward-thinking approach help you understand both current and emerging market dynamics.

                                                              Stay ahead with Visionary Data Reports. Subscribe to our newsletter for the latest insights and research highlights, and follow us on social media for real-time updates. Visionary Data Reports – Your Guide to Tomorrow’s Opportunities.

                                                              artwork spiralartwork spiralRelated Reports
                                                              artwork underline

                                                              North America Specialty Fertilizer Market 2025-2033 Overview: Trends, Competitor Dynamics, and Opportunities

                                                              The North American specialty fertilizer market is experiencing robust growth, driven by precision agriculture, sustainable farming practices, and demand for high-yield crops. Explore market size, CAGR, key players (Koch Industries, Mosaic, Nutrien), and regional trends (US, Canada, Mexico) in this in-depth analysis. Discover opportunities and challenges in the liquid, slow-release, and water-soluble fertilizer segments.

                                                              July 2025
                                                              Base Year: 2024
                                                              No Of Pages: 197
                                                              Price: $3800

                                                              Europe Chia Seeds Market Market’s Role in Emerging Tech: Insights and Projections 2025-2033

                                                              Discover the booming European chia seeds market! This in-depth analysis reveals market size, CAGR, key players (The Chia Company, Salba, Nutiva), and growth drivers. Explore trends in packaging, applications (food, supplements, personal care), and regional variations. Learn how this €414.20 million market is poised for significant expansion.

                                                              July 2025
                                                              Base Year: 2024
                                                              No Of Pages: 180
                                                              Price: $4750

                                                              Drivers of Change in Thailand Vegetable Seed Market Market 2025-2033

                                                              Discover the thriving Thailand vegetable seed market's growth trajectory (CAGR 5.20%), driven by consumer demand and technological advancements. Explore market segmentation, key players, and challenges impacting this dynamic sector projected to reach $XXX million by 2033.

                                                              July 2025
                                                              Base Year: 2024
                                                              No Of Pages: 150
                                                              Price: $3800

                                                              Consumer Trends Driving Indonesia Fungicide Market Market Growth

                                                              Discover the booming Indonesia Fungicide Market! This report reveals a projected 16.50% CAGR from 2025-2033, driven by rising disease prevalence, advanced application methods, and government support. Learn about market size, key players (Bayer, Syngenta, BASF), and future trends impacting this dynamic agricultural sector.

                                                              July 2025
                                                              Base Year: 2024
                                                              No Of Pages: 197
                                                              Price: $3800

                                                              Tomato Seed Market 2025-2033 Overview: Trends, Competitor Dynamics, and Opportunities

                                                              Discover the booming global tomato seed market! This comprehensive analysis reveals key trends, growth drivers (hybrid seeds, protected cultivation), restraints, and regional insights (Asia-Pacific leading) for the period 2019-2033, featuring top players like Sakata Seeds and Syngenta. Projected CAGR of 4.70% showcases significant investment opportunities.

                                                              July 2025
                                                              Base Year: 2024
                                                              No Of Pages: 180
                                                              Price: $3800

                                                              Emerging Trends in Brazil Maize Market: A Technology Perspective 2025-2033

                                                              Discover the dynamic Brazil maize market forecast (2025-2033)! This in-depth analysis reveals key growth drivers, including animal feed, biofuel, and human consumption, alongside major players like Syngenta and Corteva. Explore market size, CAGR, and regional insights to understand this lucrative opportunity.

                                                              July 2025
                                                              Base Year: 2024
                                                              No Of Pages: 180
                                                              Price: $3800

                                                              Future Forecasts for North America Seed Treatment Market Industry Growth

                                                              Discover the booming North American seed treatment market! This in-depth analysis reveals a CAGR of 4.20% (2025-2033), driven by precision farming, pest control needs, and government support. Explore key players, market segments (fungicides, insecticides, crops), and regional trends in the US, Canada, and Mexico. Get the data-driven insights you need to succeed.

                                                              July 2025
                                                              Base Year: 2024
                                                              No Of Pages: 150
                                                              Price: $3800

                                                              Africa Chia Seeds Industry Market’s Drivers and Challenges: Strategic Overview 2025-2033

                                                              Discover the booming African chia seed market! Our analysis reveals a $13.87M market in 2025, projected to grow at a 2.10% CAGR through 2033. Explore key trends, segments (organic, hybrid, processed, omega-3 rich), applications (food & beverage, supplements, personal care), and leading companies. Get insights for investment and market entry.

                                                              July 2025
                                                              Base Year: 2024
                                                              No Of Pages: 180
                                                              Price: $4750

                                                              Strategic Trends in Asia-Pacific Seed Coating Materials Market Market 2025-2033

                                                              The Asia-Pacific seed coating materials market is booming, with an 8% CAGR. Discover key trends, leading companies (BASF, Bayer), and segment analysis (polymers, colorants) driving growth in this $XX million market. Explore the forecast to 2033.

                                                              July 2025
                                                              Base Year: 2024
                                                              No Of Pages: 150
                                                              Price: $3800

                                                              Comprehensive Review of UK Fruits and Vegetables Market Growth Potential

                                                              Discover the booming UK fruits and vegetables market! This in-depth analysis reveals a £31.58 billion market with a 2.97% CAGR (2025-2033), driven by health trends and major players like Tesco and Sainsbury's. Explore regional data, consumption patterns, and future growth potential.

                                                              July 2025
                                                              Base Year: 2024
                                                              No Of Pages: 180
                                                              Price: $3800

                                                              Malaysia Agrochemical Market Market’s Drivers and Challenges: Strategic Overview 2025-2033

                                                              Discover the booming Malaysian agrochemical market! This comprehensive analysis reveals a RM 679.59 million market in 2025, projected to grow at a 4.56% CAGR until 2033. Explore key drivers, trends, restraints, and leading companies shaping this dynamic sector. Learn about fertilizers, pesticides, and other agrochemical segments.

                                                              July 2025
                                                              Base Year: 2024
                                                              No Of Pages: 150
                                                              Price: $3800

                                                              Drivers of Change in Agricultural Surfactant Market Market 2025-2033

                                                              The global agricultural surfactant market is booming, projected to reach $3.56 billion by 2033 with a 6.70% CAGR. Driven by precision agriculture and sustainable farming, this market analysis explores key segments (anionic, nonionic, bio-based), top players (BASF, Clariant), and regional growth trends. Discover the future of agricultural surfactants.

                                                              July 2025
                                                              Base Year: 2024
                                                              No Of Pages: 234
                                                              Price: $4750

                                                              Cameroon Grains Industry Industry Analysis and Consumer Behavior

                                                              Discover the booming Cameroon grains industry! Explore market size, growth trends (4.80% CAGR), key players (Sodecoton, CDC, etc.), and challenges impacting cereals, pulses, and oilseeds in Cameroon from 2019-2033. Invest wisely in this promising African market.

                                                              July 2025
                                                              Base Year: 2024
                                                              No Of Pages: 180
                                                              Price: $3800

                                                              Analyzing Consumer Behavior in Agriculture Market in Tanzania Market

                                                              Discover the booming Tanzanian agriculture market! Projected to reach $17.44 billion in 2025, with a 5.63% CAGR, this report analyzes market size, key players (Syngenta, Rijk Zwaan), growth drivers, and future trends in Tanzania's agricultural sector. Explore market segments, including food crops and investment opportunities.

                                                              July 2025
                                                              Base Year: 2024
                                                              No Of Pages: 150
                                                              Price: $3800

                                                              Analyzing Consumer Behavior in Artificial Intelligence in Agriculture Industry Market

                                                              Discover the booming AI in Agriculture market! This comprehensive analysis reveals a 4.20% CAGR, key drivers, trends, restraints, and regional insights from 2019-2033. Learn about leading companies and applications like precision farming, drone analytics, and weather tracking. Explore market size projections and future growth potential.

                                                              July 2025
                                                              Base Year: 2024
                                                              No Of Pages: 150
                                                              Price: $4750

                                                              Exploring Forestry Machinery Market’s Market Size Dynamics 2025-2033

                                                              The global forestry machinery market is booming, projected to reach $15 billion by 2033, driven by rising timber demand and technological advancements. Explore market trends, key players (Deere, Komatsu, etc.), and regional growth in our comprehensive analysis.

                                                              July 2025
                                                              Base Year: 2024
                                                              No Of Pages: 150
                                                              Price: $4750

                                                              Nutrition Canary Seed Market Competitive Strategies: Trends and Forecasts 2025-2033

                                                              Discover the booming nutrition canary seed market! Explore key trends, growth drivers, and regional market share projections for 2025-2033. Learn about leading companies and the increasing demand driven by health-conscious consumers and the birdseed industry.

                                                              July 2025
                                                              Base Year: 2024
                                                              No Of Pages: 234
                                                              Price: $4750

                                                              Consumer Behavior and Cashews Market in South America Trends

                                                              Discover the booming South American cashew market! This comprehensive analysis reveals a $582.24 million market in 2025, projected to grow at a 5.20% CAGR through 2033. Explore key trends, drivers, and leading companies shaping this lucrative industry.

                                                              July 2025
                                                              Base Year: 2024
                                                              No Of Pages: 180
                                                              Price: $3800

                                                              Strategic Growth Drivers for Rye Industry Market

                                                              Discover the latest market analysis of the global rye industry, projecting a steady CAGR of 2.20% to 2033. Explore key drivers, restraints, and regional trends impacting the growth of rye in food, feed, and beverage applications. Learn about leading companies and future market opportunities.

                                                              July 2025
                                                              Base Year: 2024
                                                              No Of Pages: 234
                                                              Price: $4750

                                                              Comprehensive Overview of Water Soluble Fertilizer Industry Trends: 2025-2033

                                                              Discover the booming water-soluble fertilizer market! Explore its $XX million valuation in 2025, projected 3.80% CAGR growth to 2033, key drivers, trends, and regional insights. Learn about top players and lucrative segments like fertigation and horticultural crops.

                                                              July 2025
                                                              Base Year: 2024
                                                              No Of Pages: 150
                                                              Price: $3800

                                                              Business Address

                                                              Head Office

                                                              Office no. A 5010, fifth floor, Solitaire Business Hub, Near Phoenix mall, Pune, Maharashtra 411014

                                                              Contact Information

                                                              Craig Francis

                                                              Business Development Head

                                                              +17162654855

                                                              [email protected]

                                                              Connect With Us

                                                              Secure Payment Partners

                                                              payment image
                                                              RetailLogisticsPackagingAutomotiveHealthcareAgricultureEnergy & PowerFood & BeverageAerospace & DefenseChemicals & MaterialsHospitality and TourismAnimal Nutrition & WellnessConsumer Goods and ServicesReal Estate and ConstructionHome and Property ImprovementTechnology, Media and TelecomManufacturing Products and ServicesFinancial Services and Investment Intelligence

                                                              © 2025 All rights reserved


                                                              Privacy Policy
                                                              Terms and Conditions
                                                              FAQ
                                                              • Home
                                                              • About Us
                                                              • Industries
                                                                • Aerospace & Defense
                                                                • Agriculture
                                                                • Animal Nutrition & Wellness
                                                                • Automotive
                                                                • Chemicals & Materials
                                                                • Consumer Goods and Services
                                                                • Energy & Power
                                                                • Financial Services and Investment Intelligence
                                                                • Food & Beverage
                                                                • Home and Property Improvement
                                                                • Hospitality and Tourism
                                                                • Logistics
                                                                • Manufacturing Products and Services
                                                                • Packaging
                                                                • Professional and Commercial Services
                                                                • Real Estate and Construction
                                                                • Retail
                                                                • Technology, Media and Telecom
                                                                • Healthcare
                                                              • Services
                                                              • Contact
                                                              Main Logo
                                                              • Home
                                                              • About Us
                                                              • Industries
                                                                • Aerospace & Defense
                                                                • Agriculture
                                                                • Animal Nutrition & Wellness
                                                                • Automotive
                                                                • Chemicals & Materials
                                                                • Consumer Goods and Services
                                                                • Energy & Power
                                                                • Financial Services and Investment Intelligence
                                                                • Food & Beverage
                                                                • Home and Property Improvement
                                                                • Hospitality and Tourism
                                                                • Logistics
                                                                • Manufacturing Products and Services
                                                                • Packaging
                                                                • Professional and Commercial Services
                                                                • Real Estate and Construction
                                                                • Retail
                                                                • Technology, Media and Telecom
                                                                • Healthcare
                                                              • Services
                                                              • Contact
                                                              +17162654855
                                                              [email protected]

                                                              +17162654855

                                                              [email protected]