

Key Insights
The global bio-based resins market is poised for substantial expansion, driven by escalating environmental consciousness and increasing regulatory mandates against petroleum-based plastics. Projected to achieve a Compound Annual Growth Rate (CAGR) of 9%, the market is anticipated to grow from an estimated $1.4 billion in 2025 to reach significant valuations by 2033. Key growth drivers include robust demand for sustainable packaging across the food & beverage, cosmetic, and pharmaceutical sectors, alongside expanding applications in textiles, consumer goods, and automotive components. The inherent biodegradability and comparable performance of bio-based resins to conventional plastics make them an attractive sustainable alternative. Major segments, led by Polylactic Acid (PLA) due to its versatility and biodegradability, are complemented by emerging players like Bio-polyethylene Terephthalate (Bio-PET) and Polyhydroxyalkanoate (PHA) in specialized applications. North America and Europe currently lead market adoption, supported by strong regulatory frameworks and high consumer awareness, while the Asia-Pacific region is projected for significant growth owing to its expanding manufacturing base and rising disposable incomes. Challenges include higher production costs and the need for continued technological advancements in performance and processing.
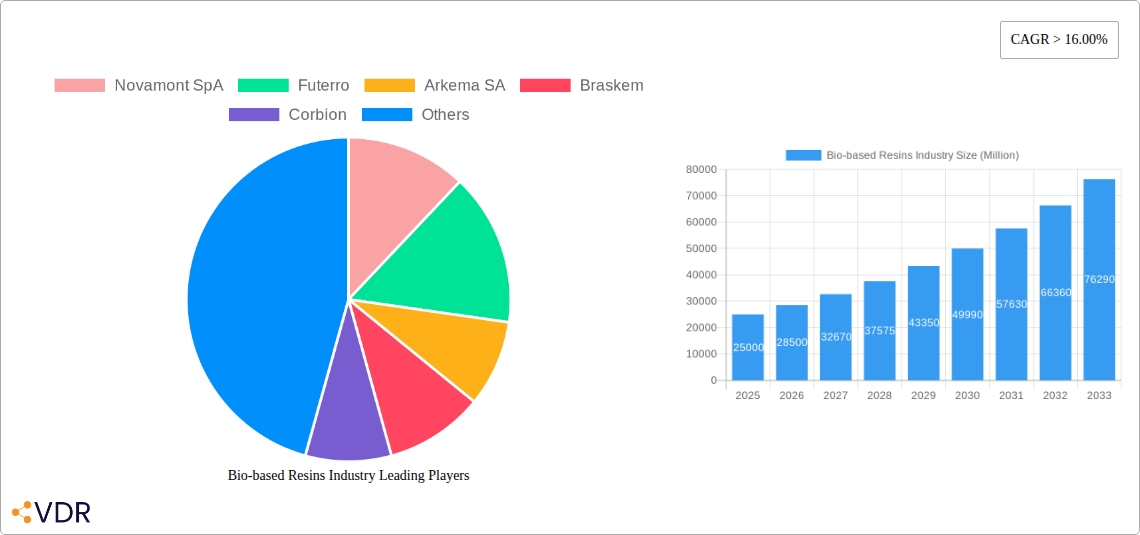
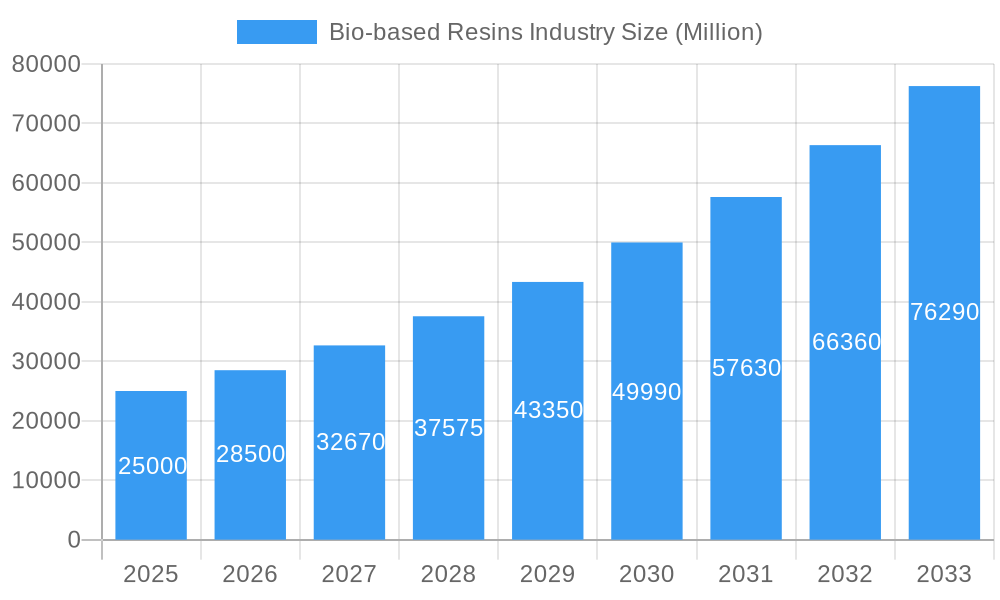
Bio-based Resins Industry Market Size (In Billion)
The competitive landscape features both established chemical giants and dedicated bio-based resin innovators. Key players are actively pursuing advancements in bio-based resin properties through research and development, strategic alliances, and collaborations with downstream users to accelerate market penetration. Future growth hinges on addressing cost competitiveness, enhancing scalability, and broadening application areas. Investments in R&D to overcome performance limitations and secure raw material availability are critical for sustaining this upward trajectory. The market's continued growth is underpinned by the persistent global drive for sustainable solutions and ongoing technological progress.
Bio-based Resins Industry Company Market Share
Bio-based Resins Market Report: 2019-2033
This comprehensive report provides an in-depth analysis of the bio-based resins market, encompassing market dynamics, growth trends, regional analysis, product landscape, challenges, opportunities, and key players. The study period spans from 2019 to 2033, with 2025 serving as the base and estimated year. The forecast period covers 2025-2033, and the historical period encompasses 2019-2024. This report is crucial for industry professionals, investors, and researchers seeking a thorough understanding of this rapidly evolving market segment. The market is segmented by type (Biodegradable Starch Blends, Polylactic Acid (PLA), Bio-polyethylene Terephthalate (Bio-PET), Polyhydroxyalkanoate (PHA), Bio-polyethylene (Bio-PE), Biodegradable Polyesters, Other Types) and application (Packaging, Textiles, Consumer Goods, Automotive and Transportation, Agriculture and Horticulture, Building and Construction, Electrical and Electronics, Other Applications). Key players analyzed include Novamont SpA, Futerro, Arkema SA, Braskem, Corbion, BASF SE, Trinseo, Biotec, Yield10 Bioscience Inc, DuPont, Minima, Natureworks LLC, and Danimer Scientific.
Bio-based Resins Industry Market Dynamics & Structure
The bio-based resins market is characterized by increasing market concentration, driven by technological advancements and strategic mergers and acquisitions (M&A). The global market size in 2025 is estimated at xx Million. Technological innovation, particularly in PLA and PHA production, is a major driver, while regulatory frameworks promoting sustainability influence market growth. Bio-based resins face competition from traditional petrochemical-based resins; however, the growing awareness of environmental concerns is shifting consumer preferences. The market is witnessing a rise in M&A activity, with larger players acquiring smaller companies to expand their product portfolios and market share.
- Market Concentration: Moderately concentrated, with top 5 players holding approximately xx% market share in 2025.
- Technological Innovation: Focus on improving biodegradability, biocompatibility, and cost-effectiveness of bio-based resins.
- Regulatory Framework: Increasingly stringent regulations promoting the use of sustainable materials are driving market growth.
- Competitive Substitutes: Traditional petrochemical-based resins remain major competitors.
- End-User Demographics: Growing consumer demand for eco-friendly products is a key factor.
- M&A Trends: Increased M&A activity, with xx major deals recorded between 2019 and 2024.
Bio-based Resins Industry Growth Trends & Insights
The bio-based resins market is experiencing substantial growth, driven by factors such as increasing environmental awareness, stringent government regulations, and the rising demand for sustainable packaging solutions. The market is projected to witness a Compound Annual Growth Rate (CAGR) of xx% during the forecast period (2025-2033), reaching xx Million by 2033. The adoption rate of bio-based resins is increasing steadily across various end-use sectors. Technological advancements, such as the development of novel bio-based polymers with enhanced properties, are further accelerating market growth. Shifting consumer preferences towards eco-friendly products are contributing to increased market penetration. Technological disruptions like advancements in bio-manufacturing processes are expected to further boost the market.
Dominant Regions, Countries, or Segments in Bio-based Resins Industry
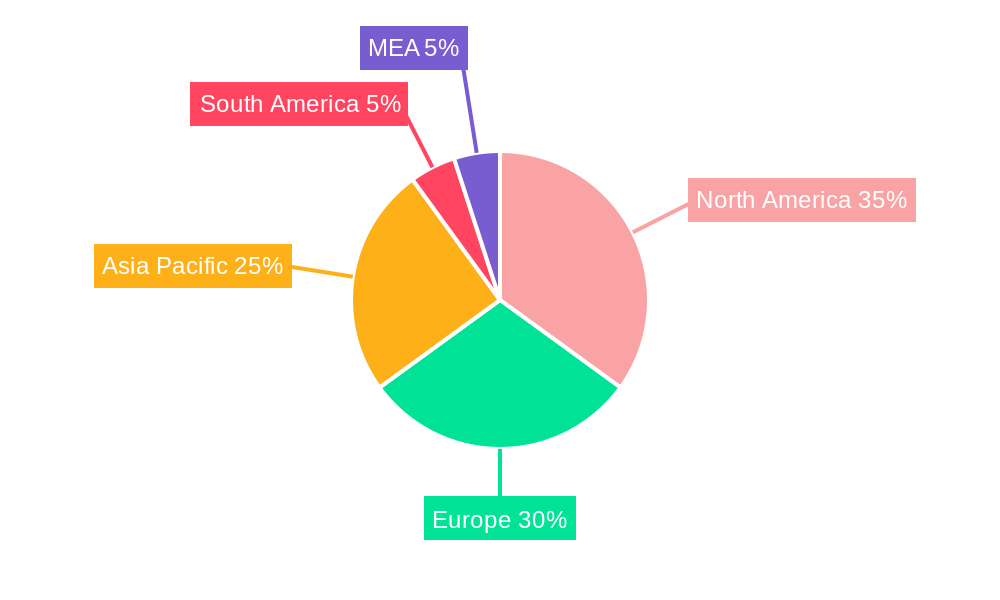
North America and Europe are currently the dominant regions in the bio-based resins market, driven by strong environmental regulations and a high awareness of sustainability. Within these regions, the packaging segment holds the largest market share, followed by the consumer goods and textiles segments. Asia-Pacific is projected to witness the fastest growth in the forecast period due to increasing industrialization and rising disposable incomes.
- Leading Region: North America (xx% market share in 2025).
- Leading Application Segment: Packaging (xx% market share in 2025).
- Fastest-Growing Region: Asia-Pacific (projected CAGR of xx% during 2025-2033).
- Key Drivers: Stringent environmental regulations in North America and Europe, growing demand for sustainable packaging solutions globally, and increasing investments in research and development.
Bio-based Resins Industry Product Landscape
The bio-based resins market offers a diverse range of products, including biodegradable starch blends, PLA, Bio-PET, PHA, Bio-PE, and biodegradable polyesters. These resins are used in various applications, exhibiting unique selling propositions such as biodegradability, compostability, and renewability. Technological advancements focus on enhancing the material properties, such as strength, flexibility, and processability, while reducing production costs.
Key Drivers, Barriers & Challenges in Bio-based Resins Industry
Key Drivers:
- Increasing environmental concerns and government regulations favoring bio-based materials.
- Growing demand for sustainable packaging solutions across various industries.
- Technological advancements leading to improved performance and cost-effectiveness.
Key Challenges:
- Higher production costs compared to petrochemical-based resins.
- Limited availability of suitable feedstocks.
- Concerns about the scalability and reliability of bio-based resin production.
- Supply chain limitations, impacting consistent supply and cost efficiency. This resulted in a xx% price fluctuation in 2024.
Emerging Opportunities in Bio-based Resins Industry
Emerging opportunities include expanding into untapped markets like bio-based textiles and construction materials. Innovation in application development, such as biodegradable electronics and advanced agricultural films, offers significant potential. Evolving consumer preferences towards sustainable and ethically sourced products are creating new market niches.
Growth Accelerators in the Bio-based Resins Industry
Long-term growth is fueled by technological breakthroughs in bio-based polymer synthesis, resulting in higher performance materials at competitive prices. Strategic partnerships between resin producers and end-users are driving market adoption. Expansion into new geographic markets, particularly in developing economies, promises significant growth potential.
Key Players Shaping the Bio-based Resins Industry Market
- Novamont SpA
- Futerro
- Arkema SA
- Braskem
- Corbion
- BASF SE
- Trinseo
- Biotec
- Yield10 Bioscience Inc
- DuPont
- Minima
- Natureworks LLC
- Danimer Scientific
Notable Milestones in Bio-based Resins Industry Sector
- 2022 Q4: Natureworks LLC launched a new PLA resin with improved heat resistance.
- 2023 Q1: BASF SE announced a strategic partnership with a leading packaging company to develop bio-based packaging solutions.
- 2024 Q3: A significant merger between two key players in the Bio-PET segment led to increased market consolidation.
In-Depth Bio-based Resins Industry Market Outlook
The future of the bio-based resins market is bright, with continued growth driven by technological advancements, increased consumer awareness, and supportive government policies. Strategic investments in research and development, coupled with the development of innovative applications, will further unlock the market's potential. The market is expected to experience a period of sustained growth, creating significant opportunities for both established players and new entrants.
Bio-based Resins Industry Segmentation
-
1. Type
- 1.1. Biodegradable Starch Blends
- 1.2. Polylactic Acid (PLA)
- 1.3. Bio-polyethylene Terephthalate (Bio-PET)
- 1.4. Polyhydroxyalkanoate (PHA)
- 1.5. Bio-polyethylene (Bio-PE)
- 1.6. Biodegradable Polyesters
- 1.7. Other Types
-
2. Application
-
2.1. Packaging
- 2.1.1. Rigid
- 2.1.2. Flexible
- 2.2. Textiles
- 2.3. Consumer Goods
- 2.4. Automotive and Transportation
- 2.5. Agriculture and Horticulture
- 2.6. Building and Construction
- 2.7. Electrical and Electronics
- 2.8. Other Applications
-
2.1. Packaging
Bio-based Resins Industry Segmentation By Geography
-
1. Asia Pacific
- 1.1. China
- 1.2. India
- 1.3. Japan
- 1.4. South Korea
- 1.5. Rest of Asia Pacific
-
2. North America
- 2.1. United States
- 2.2. Canada
- 2.3. Mexico
-
3. Europe
- 3.1. Germany
- 3.2. United Kingdom
- 3.3. France
- 3.4. Italy
- 3.5. Rest of Europe
-
4. South America
- 4.1. Brazil
- 4.2. Argentina
- 4.3. Rest of South America
- 5. Middle East
-
6. Saudi Arabia
- 6.1. South Africa
- 6.2. Rest of Middle East
Bio-based Resins Industry Regional Market Share
Geographic Coverage of Bio-based Resins Industry
Bio-based Resins Industry REPORT HIGHLIGHTS
| Aspects | Details |
|---|---|
| Study Period | 2020-2034 |
| Base Year | 2025 |
| Estimated Year | 2026 |
| Forecast Period | 2026-2034 |
| Historical Period | 2020-2025 |
| Growth Rate | CAGR of 9% from 2020-2034 |
| Segmentation |
|
Table of Contents
- 1. Introduction
- 1.1. Research Scope
- 1.2. Market Segmentation
- 1.3. Research Objective
- 1.4. Definitions and Assumptions
- 2. Executive Summary
- 2.1. Market Snapshot
- 3. Market Dynamics
- 3.1. Market Drivers
- 3.2. Market Restrains
- 3.3. Market Trends
- 3.4. Market Opportunities
- 4. Market Factor Analysis
- 4.1. Porters Five Forces
- 4.1.1. Bargaining Power of Suppliers
- 4.1.2. Bargaining Power of Buyers
- 4.1.3. Threat of New Entrants
- 4.1.4. Threat of Substitutes
- 4.1.5. Competitive Rivalry
- 4.2. PESTEL analysis
- 4.3. BCG Analysis
- 4.3.1. Stars (High Growth, High Market Share)
- 4.3.2. Cash Cows (Low Growth, High Market Share)
- 4.3.3. Question Mark (High Growth, Low Market Share)
- 4.3.4. Dogs (Low Growth, Low Market Share)
- 4.4. Ansoff Matrix Analysis
- 4.5. Supply Chain Analysis
- 4.6. Regulatory Landscape
- 4.7. Current Market Potential and Opportunity Assessment (TAM–SAM–SOM Framework)
- 4.8. VDR Analyst Note
- 4.1. Porters Five Forces
- 5. Market Analysis, Insights and Forecast 2021-2033
- 5.1. Market Analysis, Insights and Forecast - by Type
- 5.1.1. Biodegradable Starch Blends
- 5.1.2. Polylactic Acid (PLA)
- 5.1.3. Bio-polyethylene Terephthalate (Bio-PET)
- 5.1.4. Polyhydroxyalkanoate (PHA)
- 5.1.5. Bio-polyethylene (Bio-PE)
- 5.1.6. Biodegradable Polyesters
- 5.1.7. Other Types
- 5.2. Market Analysis, Insights and Forecast - by Application
- 5.2.1. Packaging
- 5.2.1.1. Rigid
- 5.2.1.2. Flexible
- 5.2.2. Textiles
- 5.2.3. Consumer Goods
- 5.2.4. Automotive and Transportation
- 5.2.5. Agriculture and Horticulture
- 5.2.6. Building and Construction
- 5.2.7. Electrical and Electronics
- 5.2.8. Other Applications
- 5.2.1. Packaging
- 5.3. Market Analysis, Insights and Forecast - by Region
- 5.3.1. Asia Pacific
- 5.3.2. North America
- 5.3.3. Europe
- 5.3.4. South America
- 5.3.5. Middle East
- 5.3.6. Saudi Arabia
- 5.1. Market Analysis, Insights and Forecast - by Type
- 6. Global Bio-based Resins Industry Analysis, Insights and Forecast, 2021-2033
- 6.1. Market Analysis, Insights and Forecast - by Type
- 6.1.1. Biodegradable Starch Blends
- 6.1.2. Polylactic Acid (PLA)
- 6.1.3. Bio-polyethylene Terephthalate (Bio-PET)
- 6.1.4. Polyhydroxyalkanoate (PHA)
- 6.1.5. Bio-polyethylene (Bio-PE)
- 6.1.6. Biodegradable Polyesters
- 6.1.7. Other Types
- 6.2. Market Analysis, Insights and Forecast - by Application
- 6.2.1. Packaging
- 6.2.1.1. Rigid
- 6.2.1.2. Flexible
- 6.2.2. Textiles
- 6.2.3. Consumer Goods
- 6.2.4. Automotive and Transportation
- 6.2.5. Agriculture and Horticulture
- 6.2.6. Building and Construction
- 6.2.7. Electrical and Electronics
- 6.2.8. Other Applications
- 6.2.1. Packaging
- 6.1. Market Analysis, Insights and Forecast - by Type
- 7. Asia Pacific Bio-based Resins Industry Analysis, Insights and Forecast, 2021-2033
- 7.1. Market Analysis, Insights and Forecast - by Type
- 7.1.1. Biodegradable Starch Blends
- 7.1.2. Polylactic Acid (PLA)
- 7.1.3. Bio-polyethylene Terephthalate (Bio-PET)
- 7.1.4. Polyhydroxyalkanoate (PHA)
- 7.1.5. Bio-polyethylene (Bio-PE)
- 7.1.6. Biodegradable Polyesters
- 7.1.7. Other Types
- 7.2. Market Analysis, Insights and Forecast - by Application
- 7.2.1. Packaging
- 7.2.1.1. Rigid
- 7.2.1.2. Flexible
- 7.2.2. Textiles
- 7.2.3. Consumer Goods
- 7.2.4. Automotive and Transportation
- 7.2.5. Agriculture and Horticulture
- 7.2.6. Building and Construction
- 7.2.7. Electrical and Electronics
- 7.2.8. Other Applications
- 7.2.1. Packaging
- 7.1. Market Analysis, Insights and Forecast - by Type
- 8. North America Bio-based Resins Industry Analysis, Insights and Forecast, 2021-2033
- 8.1. Market Analysis, Insights and Forecast - by Type
- 8.1.1. Biodegradable Starch Blends
- 8.1.2. Polylactic Acid (PLA)
- 8.1.3. Bio-polyethylene Terephthalate (Bio-PET)
- 8.1.4. Polyhydroxyalkanoate (PHA)
- 8.1.5. Bio-polyethylene (Bio-PE)
- 8.1.6. Biodegradable Polyesters
- 8.1.7. Other Types
- 8.2. Market Analysis, Insights and Forecast - by Application
- 8.2.1. Packaging
- 8.2.1.1. Rigid
- 8.2.1.2. Flexible
- 8.2.2. Textiles
- 8.2.3. Consumer Goods
- 8.2.4. Automotive and Transportation
- 8.2.5. Agriculture and Horticulture
- 8.2.6. Building and Construction
- 8.2.7. Electrical and Electronics
- 8.2.8. Other Applications
- 8.2.1. Packaging
- 8.1. Market Analysis, Insights and Forecast - by Type
- 9. Europe Bio-based Resins Industry Analysis, Insights and Forecast, 2021-2033
- 9.1. Market Analysis, Insights and Forecast - by Type
- 9.1.1. Biodegradable Starch Blends
- 9.1.2. Polylactic Acid (PLA)
- 9.1.3. Bio-polyethylene Terephthalate (Bio-PET)
- 9.1.4. Polyhydroxyalkanoate (PHA)
- 9.1.5. Bio-polyethylene (Bio-PE)
- 9.1.6. Biodegradable Polyesters
- 9.1.7. Other Types
- 9.2. Market Analysis, Insights and Forecast - by Application
- 9.2.1. Packaging
- 9.2.1.1. Rigid
- 9.2.1.2. Flexible
- 9.2.2. Textiles
- 9.2.3. Consumer Goods
- 9.2.4. Automotive and Transportation
- 9.2.5. Agriculture and Horticulture
- 9.2.6. Building and Construction
- 9.2.7. Electrical and Electronics
- 9.2.8. Other Applications
- 9.2.1. Packaging
- 9.1. Market Analysis, Insights and Forecast - by Type
- 10. South America Bio-based Resins Industry Analysis, Insights and Forecast, 2021-2033
- 10.1. Market Analysis, Insights and Forecast - by Type
- 10.1.1. Biodegradable Starch Blends
- 10.1.2. Polylactic Acid (PLA)
- 10.1.3. Bio-polyethylene Terephthalate (Bio-PET)
- 10.1.4. Polyhydroxyalkanoate (PHA)
- 10.1.5. Bio-polyethylene (Bio-PE)
- 10.1.6. Biodegradable Polyesters
- 10.1.7. Other Types
- 10.2. Market Analysis, Insights and Forecast - by Application
- 10.2.1. Packaging
- 10.2.1.1. Rigid
- 10.2.1.2. Flexible
- 10.2.2. Textiles
- 10.2.3. Consumer Goods
- 10.2.4. Automotive and Transportation
- 10.2.5. Agriculture and Horticulture
- 10.2.6. Building and Construction
- 10.2.7. Electrical and Electronics
- 10.2.8. Other Applications
- 10.2.1. Packaging
- 10.1. Market Analysis, Insights and Forecast - by Type
- 11. Middle East Bio-based Resins Industry Analysis, Insights and Forecast, 2021-2033
- 11.1. Market Analysis, Insights and Forecast - by Type
- 11.1.1. Biodegradable Starch Blends
- 11.1.2. Polylactic Acid (PLA)
- 11.1.3. Bio-polyethylene Terephthalate (Bio-PET)
- 11.1.4. Polyhydroxyalkanoate (PHA)
- 11.1.5. Bio-polyethylene (Bio-PE)
- 11.1.6. Biodegradable Polyesters
- 11.1.7. Other Types
- 11.2. Market Analysis, Insights and Forecast - by Application
- 11.2.1. Packaging
- 11.2.1.1. Rigid
- 11.2.1.2. Flexible
- 11.2.2. Textiles
- 11.2.3. Consumer Goods
- 11.2.4. Automotive and Transportation
- 11.2.5. Agriculture and Horticulture
- 11.2.6. Building and Construction
- 11.2.7. Electrical and Electronics
- 11.2.8. Other Applications
- 11.2.1. Packaging
- 11.1. Market Analysis, Insights and Forecast - by Type
- 12. Saudi Arabia Bio-based Resins Industry Analysis, Insights and Forecast, 2021-2033
- 12.1. Market Analysis, Insights and Forecast - by Type
- 12.1.1. Biodegradable Starch Blends
- 12.1.2. Polylactic Acid (PLA)
- 12.1.3. Bio-polyethylene Terephthalate (Bio-PET)
- 12.1.4. Polyhydroxyalkanoate (PHA)
- 12.1.5. Bio-polyethylene (Bio-PE)
- 12.1.6. Biodegradable Polyesters
- 12.1.7. Other Types
- 12.2. Market Analysis, Insights and Forecast - by Application
- 12.2.1. Packaging
- 12.2.1.1. Rigid
- 12.2.1.2. Flexible
- 12.2.2. Textiles
- 12.2.3. Consumer Goods
- 12.2.4. Automotive and Transportation
- 12.2.5. Agriculture and Horticulture
- 12.2.6. Building and Construction
- 12.2.7. Electrical and Electronics
- 12.2.8. Other Applications
- 12.2.1. Packaging
- 12.1. Market Analysis, Insights and Forecast - by Type
- 13. Competitive Analysis
- 13.1. Company Profiles
- 13.1.1 Novamont SpA
- 13.1.1.1. Company Overview
- 13.1.1.2. Products
- 13.1.1.3. Company Financials
- 13.1.1.4. SWOT Analysis
- 13.1.2 Futerro
- 13.1.2.1. Company Overview
- 13.1.2.2. Products
- 13.1.2.3. Company Financials
- 13.1.2.4. SWOT Analysis
- 13.1.3 Arkema SA
- 13.1.3.1. Company Overview
- 13.1.3.2. Products
- 13.1.3.3. Company Financials
- 13.1.3.4. SWOT Analysis
- 13.1.4 Braskem
- 13.1.4.1. Company Overview
- 13.1.4.2. Products
- 13.1.4.3. Company Financials
- 13.1.4.4. SWOT Analysis
- 13.1.5 Corbion
- 13.1.5.1. Company Overview
- 13.1.5.2. Products
- 13.1.5.3. Company Financials
- 13.1.5.4. SWOT Analysis
- 13.1.6 BASF SE
- 13.1.6.1. Company Overview
- 13.1.6.2. Products
- 13.1.6.3. Company Financials
- 13.1.6.4. SWOT Analysis
- 13.1.7 Trinseo
- 13.1.7.1. Company Overview
- 13.1.7.2. Products
- 13.1.7.3. Company Financials
- 13.1.7.4. SWOT Analysis
- 13.1.8 Biotec
- 13.1.8.1. Company Overview
- 13.1.8.2. Products
- 13.1.8.3. Company Financials
- 13.1.8.4. SWOT Analysis
- 13.1.9 Yield10 Bioscience Inc
- 13.1.9.1. Company Overview
- 13.1.9.2. Products
- 13.1.9.3. Company Financials
- 13.1.9.4. SWOT Analysis
- 13.1.10 DuPont
- 13.1.10.1. Company Overview
- 13.1.10.2. Products
- 13.1.10.3. Company Financials
- 13.1.10.4. SWOT Analysis
- 13.1.11 Minima
- 13.1.11.1. Company Overview
- 13.1.11.2. Products
- 13.1.11.3. Company Financials
- 13.1.11.4. SWOT Analysis
- 13.1.12 Natureworks LLC
- 13.1.12.1. Company Overview
- 13.1.12.2. Products
- 13.1.12.3. Company Financials
- 13.1.12.4. SWOT Analysis
- 13.1.13 Danimer Scientific
- 13.1.13.1. Company Overview
- 13.1.13.2. Products
- 13.1.13.3. Company Financials
- 13.1.13.4. SWOT Analysis
- 13.1.1 Novamont SpA
- 13.2. Market Entropy
- 13.2.1 Company's Key Areas Served
- 13.2.2 Recent Developments
- 13.3. Company Market Share Analysis 2025
- 13.3.1 Top 5 Companies Market Share Analysis
- 13.3.2 Top 3 Companies Market Share Analysis
- 13.4. List of Potential Customers
- 14. Research Methodology
List of Figures
- Figure 1: Global Bio-based Resins Industry Revenue Breakdown (billion, %) by Region 2025 & 2033
- Figure 2: Global Bio-based Resins Industry Volume Breakdown (K Tons, %) by Region 2025 & 2033
- Figure 3: Asia Pacific Bio-based Resins Industry Revenue (billion), by Type 2025 & 2033
- Figure 4: Asia Pacific Bio-based Resins Industry Volume (K Tons), by Type 2025 & 2033
- Figure 5: Asia Pacific Bio-based Resins Industry Revenue Share (%), by Type 2025 & 2033
- Figure 6: Asia Pacific Bio-based Resins Industry Volume Share (%), by Type 2025 & 2033
- Figure 7: Asia Pacific Bio-based Resins Industry Revenue (billion), by Application 2025 & 2033
- Figure 8: Asia Pacific Bio-based Resins Industry Volume (K Tons), by Application 2025 & 2033
- Figure 9: Asia Pacific Bio-based Resins Industry Revenue Share (%), by Application 2025 & 2033
- Figure 10: Asia Pacific Bio-based Resins Industry Volume Share (%), by Application 2025 & 2033
- Figure 11: Asia Pacific Bio-based Resins Industry Revenue (billion), by Country 2025 & 2033
- Figure 12: Asia Pacific Bio-based Resins Industry Volume (K Tons), by Country 2025 & 2033
- Figure 13: Asia Pacific Bio-based Resins Industry Revenue Share (%), by Country 2025 & 2033
- Figure 14: Asia Pacific Bio-based Resins Industry Volume Share (%), by Country 2025 & 2033
- Figure 15: North America Bio-based Resins Industry Revenue (billion), by Type 2025 & 2033
- Figure 16: North America Bio-based Resins Industry Volume (K Tons), by Type 2025 & 2033
- Figure 17: North America Bio-based Resins Industry Revenue Share (%), by Type 2025 & 2033
- Figure 18: North America Bio-based Resins Industry Volume Share (%), by Type 2025 & 2033
- Figure 19: North America Bio-based Resins Industry Revenue (billion), by Application 2025 & 2033
- Figure 20: North America Bio-based Resins Industry Volume (K Tons), by Application 2025 & 2033
- Figure 21: North America Bio-based Resins Industry Revenue Share (%), by Application 2025 & 2033
- Figure 22: North America Bio-based Resins Industry Volume Share (%), by Application 2025 & 2033
- Figure 23: North America Bio-based Resins Industry Revenue (billion), by Country 2025 & 2033
- Figure 24: North America Bio-based Resins Industry Volume (K Tons), by Country 2025 & 2033
- Figure 25: North America Bio-based Resins Industry Revenue Share (%), by Country 2025 & 2033
- Figure 26: North America Bio-based Resins Industry Volume Share (%), by Country 2025 & 2033
- Figure 27: Europe Bio-based Resins Industry Revenue (billion), by Type 2025 & 2033
- Figure 28: Europe Bio-based Resins Industry Volume (K Tons), by Type 2025 & 2033
- Figure 29: Europe Bio-based Resins Industry Revenue Share (%), by Type 2025 & 2033
- Figure 30: Europe Bio-based Resins Industry Volume Share (%), by Type 2025 & 2033
- Figure 31: Europe Bio-based Resins Industry Revenue (billion), by Application 2025 & 2033
- Figure 32: Europe Bio-based Resins Industry Volume (K Tons), by Application 2025 & 2033
- Figure 33: Europe Bio-based Resins Industry Revenue Share (%), by Application 2025 & 2033
- Figure 34: Europe Bio-based Resins Industry Volume Share (%), by Application 2025 & 2033
- Figure 35: Europe Bio-based Resins Industry Revenue (billion), by Country 2025 & 2033
- Figure 36: Europe Bio-based Resins Industry Volume (K Tons), by Country 2025 & 2033
- Figure 37: Europe Bio-based Resins Industry Revenue Share (%), by Country 2025 & 2033
- Figure 38: Europe Bio-based Resins Industry Volume Share (%), by Country 2025 & 2033
- Figure 39: South America Bio-based Resins Industry Revenue (billion), by Type 2025 & 2033
- Figure 40: South America Bio-based Resins Industry Volume (K Tons), by Type 2025 & 2033
- Figure 41: South America Bio-based Resins Industry Revenue Share (%), by Type 2025 & 2033
- Figure 42: South America Bio-based Resins Industry Volume Share (%), by Type 2025 & 2033
- Figure 43: South America Bio-based Resins Industry Revenue (billion), by Application 2025 & 2033
- Figure 44: South America Bio-based Resins Industry Volume (K Tons), by Application 2025 & 2033
- Figure 45: South America Bio-based Resins Industry Revenue Share (%), by Application 2025 & 2033
- Figure 46: South America Bio-based Resins Industry Volume Share (%), by Application 2025 & 2033
- Figure 47: South America Bio-based Resins Industry Revenue (billion), by Country 2025 & 2033
- Figure 48: South America Bio-based Resins Industry Volume (K Tons), by Country 2025 & 2033
- Figure 49: South America Bio-based Resins Industry Revenue Share (%), by Country 2025 & 2033
- Figure 50: South America Bio-based Resins Industry Volume Share (%), by Country 2025 & 2033
- Figure 51: Middle East Bio-based Resins Industry Revenue (billion), by Type 2025 & 2033
- Figure 52: Middle East Bio-based Resins Industry Volume (K Tons), by Type 2025 & 2033
- Figure 53: Middle East Bio-based Resins Industry Revenue Share (%), by Type 2025 & 2033
- Figure 54: Middle East Bio-based Resins Industry Volume Share (%), by Type 2025 & 2033
- Figure 55: Middle East Bio-based Resins Industry Revenue (billion), by Application 2025 & 2033
- Figure 56: Middle East Bio-based Resins Industry Volume (K Tons), by Application 2025 & 2033
- Figure 57: Middle East Bio-based Resins Industry Revenue Share (%), by Application 2025 & 2033
- Figure 58: Middle East Bio-based Resins Industry Volume Share (%), by Application 2025 & 2033
- Figure 59: Middle East Bio-based Resins Industry Revenue (billion), by Country 2025 & 2033
- Figure 60: Middle East Bio-based Resins Industry Volume (K Tons), by Country 2025 & 2033
- Figure 61: Middle East Bio-based Resins Industry Revenue Share (%), by Country 2025 & 2033
- Figure 62: Middle East Bio-based Resins Industry Volume Share (%), by Country 2025 & 2033
- Figure 63: Saudi Arabia Bio-based Resins Industry Revenue (billion), by Type 2025 & 2033
- Figure 64: Saudi Arabia Bio-based Resins Industry Volume (K Tons), by Type 2025 & 2033
- Figure 65: Saudi Arabia Bio-based Resins Industry Revenue Share (%), by Type 2025 & 2033
- Figure 66: Saudi Arabia Bio-based Resins Industry Volume Share (%), by Type 2025 & 2033
- Figure 67: Saudi Arabia Bio-based Resins Industry Revenue (billion), by Application 2025 & 2033
- Figure 68: Saudi Arabia Bio-based Resins Industry Volume (K Tons), by Application 2025 & 2033
- Figure 69: Saudi Arabia Bio-based Resins Industry Revenue Share (%), by Application 2025 & 2033
- Figure 70: Saudi Arabia Bio-based Resins Industry Volume Share (%), by Application 2025 & 2033
- Figure 71: Saudi Arabia Bio-based Resins Industry Revenue (billion), by Country 2025 & 2033
- Figure 72: Saudi Arabia Bio-based Resins Industry Volume (K Tons), by Country 2025 & 2033
- Figure 73: Saudi Arabia Bio-based Resins Industry Revenue Share (%), by Country 2025 & 2033
- Figure 74: Saudi Arabia Bio-based Resins Industry Volume Share (%), by Country 2025 & 2033
List of Tables
- Table 1: Global Bio-based Resins Industry Revenue billion Forecast, by Type 2020 & 2033
- Table 2: Global Bio-based Resins Industry Volume K Tons Forecast, by Type 2020 & 2033
- Table 3: Global Bio-based Resins Industry Revenue billion Forecast, by Application 2020 & 2033
- Table 4: Global Bio-based Resins Industry Volume K Tons Forecast, by Application 2020 & 2033
- Table 5: Global Bio-based Resins Industry Revenue billion Forecast, by Region 2020 & 2033
- Table 6: Global Bio-based Resins Industry Volume K Tons Forecast, by Region 2020 & 2033
- Table 7: Global Bio-based Resins Industry Revenue billion Forecast, by Type 2020 & 2033
- Table 8: Global Bio-based Resins Industry Volume K Tons Forecast, by Type 2020 & 2033
- Table 9: Global Bio-based Resins Industry Revenue billion Forecast, by Application 2020 & 2033
- Table 10: Global Bio-based Resins Industry Volume K Tons Forecast, by Application 2020 & 2033
- Table 11: Global Bio-based Resins Industry Revenue billion Forecast, by Country 2020 & 2033
- Table 12: Global Bio-based Resins Industry Volume K Tons Forecast, by Country 2020 & 2033
- Table 13: China Bio-based Resins Industry Revenue (billion) Forecast, by Application 2020 & 2033
- Table 14: China Bio-based Resins Industry Volume (K Tons) Forecast, by Application 2020 & 2033
- Table 15: India Bio-based Resins Industry Revenue (billion) Forecast, by Application 2020 & 2033
- Table 16: India Bio-based Resins Industry Volume (K Tons) Forecast, by Application 2020 & 2033
- Table 17: Japan Bio-based Resins Industry Revenue (billion) Forecast, by Application 2020 & 2033
- Table 18: Japan Bio-based Resins Industry Volume (K Tons) Forecast, by Application 2020 & 2033
- Table 19: South Korea Bio-based Resins Industry Revenue (billion) Forecast, by Application 2020 & 2033
- Table 20: South Korea Bio-based Resins Industry Volume (K Tons) Forecast, by Application 2020 & 2033
- Table 21: Rest of Asia Pacific Bio-based Resins Industry Revenue (billion) Forecast, by Application 2020 & 2033
- Table 22: Rest of Asia Pacific Bio-based Resins Industry Volume (K Tons) Forecast, by Application 2020 & 2033
- Table 23: Global Bio-based Resins Industry Revenue billion Forecast, by Type 2020 & 2033
- Table 24: Global Bio-based Resins Industry Volume K Tons Forecast, by Type 2020 & 2033
- Table 25: Global Bio-based Resins Industry Revenue billion Forecast, by Application 2020 & 2033
- Table 26: Global Bio-based Resins Industry Volume K Tons Forecast, by Application 2020 & 2033
- Table 27: Global Bio-based Resins Industry Revenue billion Forecast, by Country 2020 & 2033
- Table 28: Global Bio-based Resins Industry Volume K Tons Forecast, by Country 2020 & 2033
- Table 29: United States Bio-based Resins Industry Revenue (billion) Forecast, by Application 2020 & 2033
- Table 30: United States Bio-based Resins Industry Volume (K Tons) Forecast, by Application 2020 & 2033
- Table 31: Canada Bio-based Resins Industry Revenue (billion) Forecast, by Application 2020 & 2033
- Table 32: Canada Bio-based Resins Industry Volume (K Tons) Forecast, by Application 2020 & 2033
- Table 33: Mexico Bio-based Resins Industry Revenue (billion) Forecast, by Application 2020 & 2033
- Table 34: Mexico Bio-based Resins Industry Volume (K Tons) Forecast, by Application 2020 & 2033
- Table 35: Global Bio-based Resins Industry Revenue billion Forecast, by Type 2020 & 2033
- Table 36: Global Bio-based Resins Industry Volume K Tons Forecast, by Type 2020 & 2033
- Table 37: Global Bio-based Resins Industry Revenue billion Forecast, by Application 2020 & 2033
- Table 38: Global Bio-based Resins Industry Volume K Tons Forecast, by Application 2020 & 2033
- Table 39: Global Bio-based Resins Industry Revenue billion Forecast, by Country 2020 & 2033
- Table 40: Global Bio-based Resins Industry Volume K Tons Forecast, by Country 2020 & 2033
- Table 41: Germany Bio-based Resins Industry Revenue (billion) Forecast, by Application 2020 & 2033
- Table 42: Germany Bio-based Resins Industry Volume (K Tons) Forecast, by Application 2020 & 2033
- Table 43: United Kingdom Bio-based Resins Industry Revenue (billion) Forecast, by Application 2020 & 2033
- Table 44: United Kingdom Bio-based Resins Industry Volume (K Tons) Forecast, by Application 2020 & 2033
- Table 45: France Bio-based Resins Industry Revenue (billion) Forecast, by Application 2020 & 2033
- Table 46: France Bio-based Resins Industry Volume (K Tons) Forecast, by Application 2020 & 2033
- Table 47: Italy Bio-based Resins Industry Revenue (billion) Forecast, by Application 2020 & 2033
- Table 48: Italy Bio-based Resins Industry Volume (K Tons) Forecast, by Application 2020 & 2033
- Table 49: Rest of Europe Bio-based Resins Industry Revenue (billion) Forecast, by Application 2020 & 2033
- Table 50: Rest of Europe Bio-based Resins Industry Volume (K Tons) Forecast, by Application 2020 & 2033
- Table 51: Global Bio-based Resins Industry Revenue billion Forecast, by Type 2020 & 2033
- Table 52: Global Bio-based Resins Industry Volume K Tons Forecast, by Type 2020 & 2033
- Table 53: Global Bio-based Resins Industry Revenue billion Forecast, by Application 2020 & 2033
- Table 54: Global Bio-based Resins Industry Volume K Tons Forecast, by Application 2020 & 2033
- Table 55: Global Bio-based Resins Industry Revenue billion Forecast, by Country 2020 & 2033
- Table 56: Global Bio-based Resins Industry Volume K Tons Forecast, by Country 2020 & 2033
- Table 57: Brazil Bio-based Resins Industry Revenue (billion) Forecast, by Application 2020 & 2033
- Table 58: Brazil Bio-based Resins Industry Volume (K Tons) Forecast, by Application 2020 & 2033
- Table 59: Argentina Bio-based Resins Industry Revenue (billion) Forecast, by Application 2020 & 2033
- Table 60: Argentina Bio-based Resins Industry Volume (K Tons) Forecast, by Application 2020 & 2033
- Table 61: Rest of South America Bio-based Resins Industry Revenue (billion) Forecast, by Application 2020 & 2033
- Table 62: Rest of South America Bio-based Resins Industry Volume (K Tons) Forecast, by Application 2020 & 2033
- Table 63: Global Bio-based Resins Industry Revenue billion Forecast, by Type 2020 & 2033
- Table 64: Global Bio-based Resins Industry Volume K Tons Forecast, by Type 2020 & 2033
- Table 65: Global Bio-based Resins Industry Revenue billion Forecast, by Application 2020 & 2033
- Table 66: Global Bio-based Resins Industry Volume K Tons Forecast, by Application 2020 & 2033
- Table 67: Global Bio-based Resins Industry Revenue billion Forecast, by Country 2020 & 2033
- Table 68: Global Bio-based Resins Industry Volume K Tons Forecast, by Country 2020 & 2033
- Table 69: Global Bio-based Resins Industry Revenue billion Forecast, by Type 2020 & 2033
- Table 70: Global Bio-based Resins Industry Volume K Tons Forecast, by Type 2020 & 2033
- Table 71: Global Bio-based Resins Industry Revenue billion Forecast, by Application 2020 & 2033
- Table 72: Global Bio-based Resins Industry Volume K Tons Forecast, by Application 2020 & 2033
- Table 73: Global Bio-based Resins Industry Revenue billion Forecast, by Country 2020 & 2033
- Table 74: Global Bio-based Resins Industry Volume K Tons Forecast, by Country 2020 & 2033
- Table 75: South Africa Bio-based Resins Industry Revenue (billion) Forecast, by Application 2020 & 2033
- Table 76: South Africa Bio-based Resins Industry Volume (K Tons) Forecast, by Application 2020 & 2033
- Table 77: Rest of Middle East Bio-based Resins Industry Revenue (billion) Forecast, by Application 2020 & 2033
- Table 78: Rest of Middle East Bio-based Resins Industry Volume (K Tons) Forecast, by Application 2020 & 2033
Frequently Asked Questions
1. What is the projected Compound Annual Growth Rate (CAGR) of the Bio-based Resins Industry?
The projected CAGR is approximately 9%.
2. Which companies are prominent players in the Bio-based Resins Industry?
Key companies in the market include Novamont SpA, Futerro, Arkema SA, Braskem, Corbion, BASF SE, Trinseo, Biotec, Yield10 Bioscience Inc, DuPont, Minima, Natureworks LLC, Danimer Scientific.
3. What are the main segments of the Bio-based Resins Industry?
The market segments include Type, Application.
4. Can you provide details about the market size?
The market size is estimated to be USD 1.4 billion as of 2022.
5. What are some drivers contributing to market growth?
; Environmental Factors Encouraging a Paradigm Shift; Surging Demand for Bioplastics in Flexible Packaging.
6. What are the notable trends driving market growth?
Flexible Packaging Segment to Dominate the Market Demand.
7. Are there any restraints impacting market growth?
; Lack of Awareness and High Cost Association; Availability of Cheaper Alternatives.
8. Can you provide examples of recent developments in the market?
N/A
9. What pricing options are available for accessing the report?
Pricing options include single-user, multi-user, and enterprise licenses priced at USD 4750, USD 5250, and USD 8750 respectively.
10. Is the market size provided in terms of value or volume?
The market size is provided in terms of value, measured in billion and volume, measured in K Tons.
11. Are there any specific market keywords associated with the report?
Yes, the market keyword associated with the report is "Bio-based Resins Industry," which aids in identifying and referencing the specific market segment covered.
12. How do I determine which pricing option suits my needs best?
The pricing options vary based on user requirements and access needs. Individual users may opt for single-user licenses, while businesses requiring broader access may choose multi-user or enterprise licenses for cost-effective access to the report.
13. Are there any additional resources or data provided in the Bio-based Resins Industry report?
While the report offers comprehensive insights, it's advisable to review the specific contents or supplementary materials provided to ascertain if additional resources or data are available.
14. How can I stay updated on further developments or reports in the Bio-based Resins Industry?
To stay informed about further developments, trends, and reports in the Bio-based Resins Industry, consider subscribing to industry newsletters, following relevant companies and organizations, or regularly checking reputable industry news sources and publications.
Methodology
Step 1 - Identification of Relevant Samples Size from Population Database


Step 2 - Approaches for Defining Global Market Size (Value, Volume* & Price*)

Note*: In applicable scenarios
Step 3 - Data Sources
Primary Research
- Web Analytics
- Survey Reports
- Research Institute
- Latest Research Reports
- Opinion Leaders
Secondary Research
- Annual Reports
- White Paper
- Latest Press Release
- Industry Association
- Paid Database
- Investor Presentations

Step 4 - Data Triangulation
Involves using different sources of information in order to increase the validity of a study
These sources are likely to be stakeholders in a program - participants, other researchers, program staff, other community members, and so on.
Then we put all data in single framework & apply various statistical tools to find out the dynamic on the market.
During the analysis stage, feedback from the stakeholder groups would be compared to determine areas of agreement as well as areas of divergence