
Key Insights
The global Bidirectional Power Supply market is set for substantial growth, with an estimated market size of $10.96 billion by 2025. The market is projected to expand at a Compound Annual Growth Rate (CAGR) of 11.65% between 2025 and 2033. This expansion is driven by the increasing demand for sophisticated testing and simulation across industries such as automotive, aerospace, and renewable energy. The growing complexity of electronic devices and stringent validation requirements are accelerating the adoption of bidirectional power supplies for their advanced control and flexibility in power management. Key applications like battery testing, electric vehicle (EV) charging infrastructure, and grid-tied power systems are major growth catalysts. The programmable segment currently leads the market due to its superior features and adaptability.
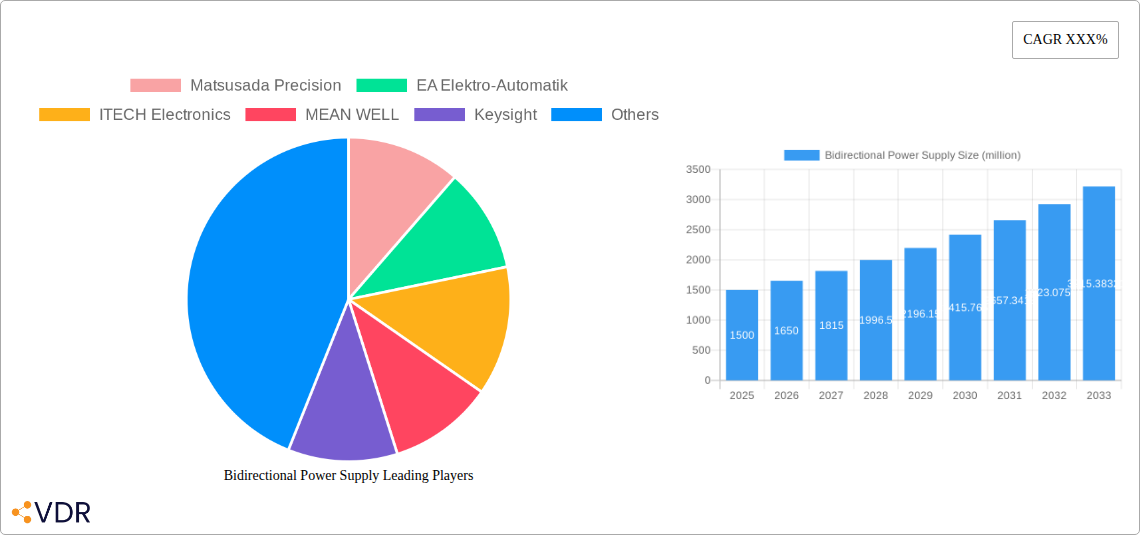
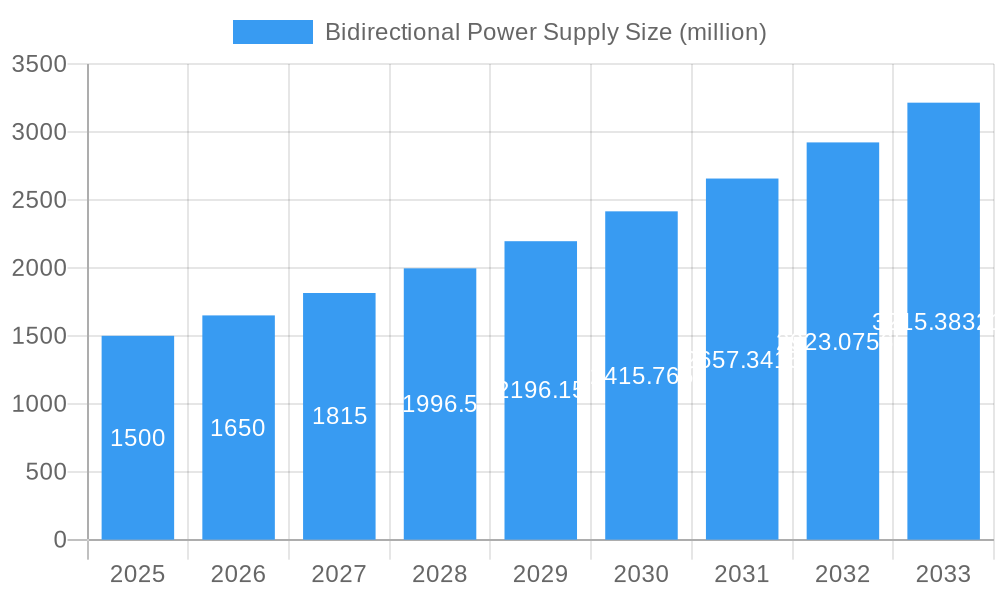
Bidirectional Power Supply Market Size (In Billion)

Emerging trends including the integration of AI and ML for optimized testing and predictive maintenance, alongside the adoption of high-power density and modular solutions, are further shaping market dynamics. The renewable energy sector, with its focus on grid integration and energy storage, represents a significant opportunity. However, high initial costs and the requirement for specialized technical expertise pose challenges. Despite these factors, continuous innovation and a widening application scope, supported by key industry players, are expected to ensure a robust growth trajectory for the Bidirectional Power Supply market.
Bidirectional Power Supply Company Market Share
Bidirectional Power Supply Market Analysis: Dynamics, Growth, and Future Outlook (2019–2033)
This comprehensive report provides an in-depth analysis of the global bidirectional power supply market, offering critical insights into market dynamics, growth trajectories, regional dominance, product innovation, and key player strategies. The study spans from 2019 to 2033, with a base year of 2025, and includes a detailed forecast period from 2025–2033.
Bidirectional Power Supply Market Dynamics & Structure
The bidirectional power supply market exhibits a moderate to high concentration, with key players continuously investing in research and development to stay ahead. Technological innovation is a primary driver, fueled by the increasing demand for energy storage systems, electric vehicle (EV) charging infrastructure, and advanced testing applications. Regulatory frameworks, particularly those promoting renewable energy integration and emissions reduction, indirectly bolster market growth. Competitive product substitutes, such as unidirectional power supplies with advanced control capabilities, pose a challenge but are often outperformed in applications requiring energy feedback. End-user demographics are shifting towards industrial, automotive, and renewable energy sectors, with a growing preference for intelligent, compact, and highly efficient solutions. Mergers and acquisitions (M&A) trends indicate a strategic consolidation, with larger entities acquiring innovative startups to expand their product portfolios and market reach. For instance, the past few years have seen an estimated 35 M&A deals in the broader power electronics sector, with a notable portion impacting bidirectional power supply capabilities. Innovation barriers include the complexity of control algorithms for seamless power flow and the high cost of specialized components.
- Market Concentration: Moderate to High
- Technological Innovation Drivers: Energy storage, EV charging, advanced testing
- Regulatory Frameworks: Renewable energy integration, emissions standards
- Competitive Product Substitutes: Advanced unidirectional supplies
- End-User Demographics: Industrial, Automotive, Renewable Energy
- M&A Trends: Strategic consolidation, acquisition of startups
- Innovation Barriers: Control algorithm complexity, component costs
Bidirectional Power Supply Growth Trends & Insights
The global bidirectional power supply market is poised for substantial growth, driven by an escalating need for advanced power management solutions across diverse industries. The market size is projected to expand from an estimated $1.2 billion in 2025 to over $3.5 billion by 2033, exhibiting a robust Compound Annual Growth Rate (CAGR) of approximately 14%. This impressive expansion is underpinned by several converging trends. The rapid proliferation of electric vehicles (EVs) necessitates sophisticated charging solutions that not only supply power but also facilitate vehicle-to-grid (V2G) and vehicle-to-home (V2H) capabilities, creating a significant demand for bidirectional power supplies. Furthermore, the burgeoning renewable energy sector, particularly solar and wind power, requires efficient energy storage systems to manage intermittent generation, further driving the adoption of bidirectional power technologies.
Technological disruptions are at the forefront of this growth. Advancements in power semiconductor technologies, such as Gallium Nitride (GaN) and Silicon Carbide (SiC), are enabling the development of more efficient, compact, and higher-power-density bidirectional power supplies. These innovations are critical for meeting the evolving performance requirements of applications like grid-tied energy storage systems and industrial automation. Consumer behavior is also evolving; a growing awareness of energy efficiency and the desire for grid independence are compelling individuals and businesses to invest in smart energy solutions, often incorporating bidirectional power flow. The market penetration of bidirectional power supplies, while still relatively nascent in some consumer-facing applications, is rapidly increasing in industrial and commercial segments. The ability of these supplies to both draw and deliver power offers unparalleled flexibility in managing energy assets, optimizing consumption, and enhancing grid stability. For instance, in the battery testing segment, bidirectional power supplies allow for efficient charge/discharge cycling, significantly reducing testing times and energy waste. This adaptability and efficiency are key differentiators fueling the market's upward trajectory. The adoption rates are expected to accelerate as economies of scale reduce manufacturing costs and as more standardized protocols for grid integration emerge.
Dominant Regions, Countries, or Segments in Bidirectional Power Supply
The Application segment of Electric Vehicle Charging Infrastructure is currently the dominant force driving growth in the global bidirectional power supply market. This dominance is a confluence of strong economic policies, substantial infrastructure investments, and rapidly evolving consumer preferences. North America and Europe are leading regions, with the United States and Germany emerging as key countries within these regions, spearheading the adoption of bidirectional power supplies for EV charging.
In the United States, federal and state incentives for EV adoption and charging infrastructure development have created a fertile ground for bidirectional power supply integration. The push for smart grid technologies and the increasing integration of renewable energy sources into the grid further amplify the need for bidirectional capabilities, enabling V2G functionalities that can stabilize the grid and provide ancillary services. Market share for bidirectional power supplies in this application segment is estimated to be around 30% of the total market value in 2025, with an anticipated growth rate of over 15% CAGR through 2033.
Germany, a pioneer in renewable energy and automotive innovation, also exhibits significant market leadership. Its stringent emissions regulations and ambitious targets for EV penetration are driving substantial investments in bidirectional charging solutions. The country's robust industrial base, with leading automotive manufacturers and power electronics companies, further fuels demand and innovation in this sector. The parent market for EV charging infrastructure is valued at approximately $15 billion in 2025, with the bidirectional power supply segment within it holding a substantial and growing share.
The growth potential in this segment is further bolstered by:
- Government Mandates and Subsidies: Policies encouraging EV sales and the development of charging networks.
- Technological Advancements: Development of faster and more efficient bidirectional chargers.
- Grid Modernization Initiatives: Efforts to create more resilient and flexible power grids.
- Consumer Demand for Smart Energy: Growing interest in V2G and V2H applications for cost savings and energy independence.
The parent market, encompassing all EV charging solutions, is projected to reach over $40 billion by 2033. Within this, the child market specifically for bidirectional power supplies for EV charging is expected to outpace the overall market, reaching an estimated $8 billion by 2033. This strong performance is attributed to the inherent advantages bidirectional power offers in optimizing energy flow, reducing peak demand charges for consumers, and providing valuable grid services. The increasing complexity of EV battery management systems also necessitates bidirectional power supplies for sophisticated testing and calibration procedures during manufacturing and maintenance.
Bidirectional Power Supply Product Landscape
The bidirectional power supply product landscape is characterized by continuous innovation, focusing on enhanced efficiency, greater power density, and advanced communication protocols. Key product innovations include modular designs allowing for scalability, integrated energy storage capabilities, and sophisticated software for intelligent energy management and grid interaction. Applications range from precise battery testing and simulation for automotive and renewable energy sectors to sophisticated grid simulation for research and development and advanced power regeneration in industrial automation. Performance metrics such as high power conversion efficiency (often exceeding 95%), fast transient response, and wide voltage/current ranges are becoming standard. Unique selling propositions lie in their ability to accurately emulate real-world load conditions and return energy to the grid, reducing operational costs and environmental impact.
Key Drivers, Barriers & Challenges in Bidirectional Power Supply
Key Drivers:
The bidirectional power supply market is propelled by several key drivers. The escalating adoption of electric vehicles (EVs) is a primary catalyst, necessitating V2G and V2H capabilities for charging and energy management. The growing global emphasis on renewable energy integration, particularly solar and wind power, fuels demand for bidirectional power supplies in energy storage systems to balance intermittent generation. Furthermore, the advancement of battery technologies and the need for sophisticated battery testing and simulation solutions significantly contribute to market expansion. Increased investment in grid modernization and smart grid initiatives, aiming to enhance power reliability and efficiency, also presents substantial opportunities.
Key Barriers & Challenges:
Despite robust growth, the market faces several challenges. The high initial cost of bidirectional power supplies compared to their unidirectional counterparts remains a significant barrier to widespread adoption, especially in cost-sensitive applications. Complex control algorithms and integration challenges can hinder seamless implementation, requiring specialized expertise. Supply chain disruptions for critical components, such as power semiconductors, can lead to production delays and increased costs. Stringent regulatory compliance for grid interconnection and safety standards can also add to development and certification expenses. Competitive pressures from established unidirectional power supply manufacturers evolving their offerings and the emergence of new market entrants also present hurdles. The estimated impact of supply chain issues has led to a projected cost increase of 5-10% in the short term.
Emerging Opportunities in Bidirectional Power Supply
Emerging opportunities in the bidirectional power supply sector are diverse and promising. The expansion of the microgrid market, which requires robust bidirectional power flow for localized energy management and resilience, presents a significant growth avenue. The increasing demand for advanced simulation and testing solutions in aerospace, defense, and telecommunications for testing complex power systems and components is another key area. Furthermore, the development of smart home energy management systems that integrate with renewable energy sources and EV charging offers a burgeoning consumer-focused market. The untapped potential in developing nations, as they invest in renewable energy and EV infrastructure, also represents a substantial future opportunity.
Growth Accelerators in the Bidirectional Power Supply Industry
Several catalysts are accelerating long-term growth in the bidirectional power supply industry. Technological breakthroughs in power electronics, particularly the wider adoption of GaN and SiC semiconductors, are enabling higher efficiency, smaller form factors, and lower costs. Strategic partnerships between power supply manufacturers, automotive companies, and utility providers are crucial for developing standardized V2G protocols and driving market adoption. Market expansion strategies, including penetration into emerging economies and the development of application-specific solutions for niche markets like portable power stations, will further fuel growth. Continuous innovation in software for intelligent energy management and grid services will also be a key accelerator.
Key Players Shaping the Bidirectional Power Supply Market
- Matsusada Precision
- EA Elektro-Automatik
- ITECH Electronics
- MEAN WELL
- Keysight
- KIKUSUI ELECTRONICS
- CINERGIA
- RECOM Power
- Chroma ATE
- Adaptive Power Systems
- Rohde & Schwarz
- ET System Electronic GmbH
- ETPS (Elba Electronics)
- Delta Elektronika
- Power4Test GmbH
- Regatron AG
Notable Milestones in Bidirectional Power Supply Sector
- 2020: Launch of advanced GaN-based bidirectional power modules enabling higher efficiency and power density.
- 2021: Major automotive manufacturers announce increased investment in V2G pilot programs, boosting demand for compatible bidirectional chargers.
- 2022: Several key players release new product lines specifically targeting the renewable energy storage market with enhanced grid interaction capabilities.
- 2023: Standardization bodies release updated guidelines for V2G communication protocols, facilitating wider interoperability and adoption.
- 2024: Significant advancements in software platforms for bidirectional power supply management, enabling more intelligent grid services and energy optimization.
In-Depth Bidirectional Power Supply Market Outlook
The future outlook for the bidirectional power supply market is exceptionally bright, fueled by a confluence of technological innovation, supportive government policies, and evolving industry demands. Growth accelerators such as the maturation of V2G technology, the increasing integration of distributed energy resources, and the development of smart grids will solidify the market’s upward trajectory. Strategic opportunities lie in addressing the growing need for reliable and efficient power solutions in sectors like industrial automation, aerospace, and telecommunications. Continuous investment in R&D, focusing on cost reduction, enhanced performance, and intelligent control systems, will be paramount for market leaders to capitalize on the projected substantial market expansion over the forecast period. The estimated market value for bidirectional power supplies is expected to surpass $7 billion by 2033.
Bidirectional Power Supply Segmentation
-
1. Application
- 1.1. undefined
-
2. Type
- 2.1. undefined
Bidirectional Power Supply Segmentation By Geography
- 1. undefined
- 2. undefined
- 3. undefined
- 4. undefined
- 5. undefined
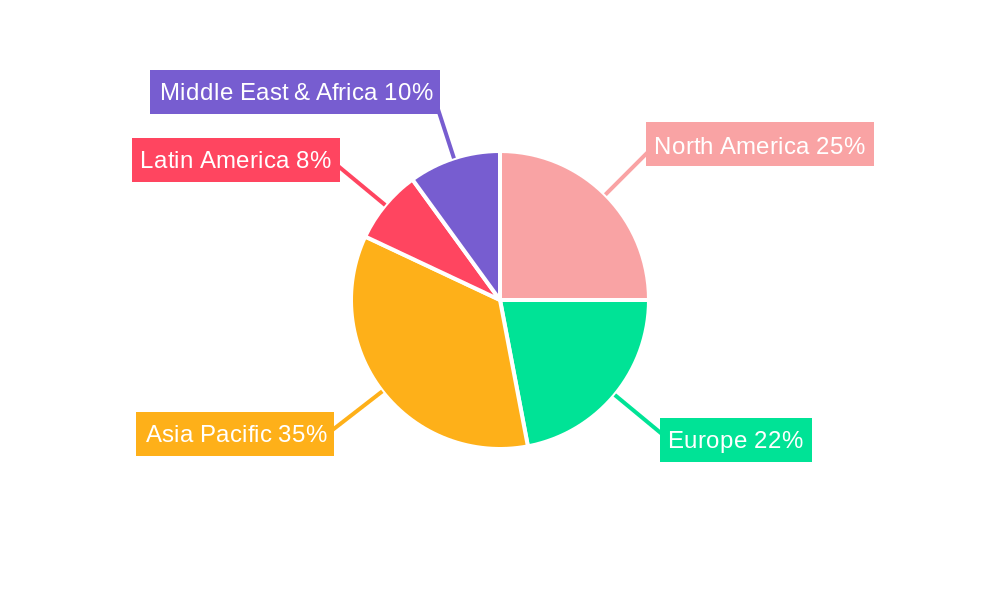
Bidirectional Power Supply Regional Market Share
Geographic Coverage of Bidirectional Power Supply
Bidirectional Power Supply REPORT HIGHLIGHTS
| Aspects | Details |
|---|---|
| Study Period | 2020-2034 |
| Base Year | 2025 |
| Estimated Year | 2026 |
| Forecast Period | 2026-2034 |
| Historical Period | 2020-2025 |
| Growth Rate | CAGR of 11.65% from 2020-2034 |
| Segmentation |
|
Table of Contents
- 1. Introduction
- 1.1. Research Scope
- 1.2. Market Segmentation
- 1.3. Research Methodology
- 1.4. Definitions and Assumptions
- 2. Executive Summary
- 2.1. Introduction
- 3. Market Dynamics
- 3.1. Introduction
- 3.2. Market Drivers
- 3.3. Market Restrains
- 3.4. Market Trends
- 4. Market Factor Analysis
- 4.1. Porters Five Forces
- 4.2. Supply/Value Chain
- 4.3. PESTEL analysis
- 4.4. Market Entropy
- 4.5. Patent/Trademark Analysis
- 5. Global Bidirectional Power Supply Analysis, Insights and Forecast, 2020-2032
- 5.1. Market Analysis, Insights and Forecast - by Application
- 5.1.1.
- 5.2. Market Analysis, Insights and Forecast - by Type
- 5.2.1.
- 5.3. Market Analysis, Insights and Forecast - by Region
- 5.3.1.
- 5.3.2.
- 5.3.3.
- 5.3.4.
- 5.3.5.
- 5.1. Market Analysis, Insights and Forecast - by Application
- 6. undefined Bidirectional Power Supply Analysis, Insights and Forecast, 2020-2032
- 6.1. Market Analysis, Insights and Forecast - by Application
- 6.1.1.
- 6.2. Market Analysis, Insights and Forecast - by Type
- 6.2.1.
- 6.1. Market Analysis, Insights and Forecast - by Application
- 7. undefined Bidirectional Power Supply Analysis, Insights and Forecast, 2020-2032
- 7.1. Market Analysis, Insights and Forecast - by Application
- 7.1.1.
- 7.2. Market Analysis, Insights and Forecast - by Type
- 7.2.1.
- 7.1. Market Analysis, Insights and Forecast - by Application
- 8. undefined Bidirectional Power Supply Analysis, Insights and Forecast, 2020-2032
- 8.1. Market Analysis, Insights and Forecast - by Application
- 8.1.1.
- 8.2. Market Analysis, Insights and Forecast - by Type
- 8.2.1.
- 8.1. Market Analysis, Insights and Forecast - by Application
- 9. undefined Bidirectional Power Supply Analysis, Insights and Forecast, 2020-2032
- 9.1. Market Analysis, Insights and Forecast - by Application
- 9.1.1.
- 9.2. Market Analysis, Insights and Forecast - by Type
- 9.2.1.
- 9.1. Market Analysis, Insights and Forecast - by Application
- 10. undefined Bidirectional Power Supply Analysis, Insights and Forecast, 2020-2032
- 10.1. Market Analysis, Insights and Forecast - by Application
- 10.1.1.
- 10.2. Market Analysis, Insights and Forecast - by Type
- 10.2.1.
- 10.1. Market Analysis, Insights and Forecast - by Application
- 11. Competitive Analysis
- 11.1. Global Market Share Analysis 2025
- 11.2. Company Profiles
- 11.2.1 Matsusada Precision
- 11.2.1.1. Overview
- 11.2.1.2. Products
- 11.2.1.3. SWOT Analysis
- 11.2.1.4. Recent Developments
- 11.2.1.5. Financials (Based on Availability)
- 11.2.2 EA Elektro-Automatik
- 11.2.2.1. Overview
- 11.2.2.2. Products
- 11.2.2.3. SWOT Analysis
- 11.2.2.4. Recent Developments
- 11.2.2.5. Financials (Based on Availability)
- 11.2.3 ITECH Electronics
- 11.2.3.1. Overview
- 11.2.3.2. Products
- 11.2.3.3. SWOT Analysis
- 11.2.3.4. Recent Developments
- 11.2.3.5. Financials (Based on Availability)
- 11.2.4 MEAN WELL
- 11.2.4.1. Overview
- 11.2.4.2. Products
- 11.2.4.3. SWOT Analysis
- 11.2.4.4. Recent Developments
- 11.2.4.5. Financials (Based on Availability)
- 11.2.5 Keysight
- 11.2.5.1. Overview
- 11.2.5.2. Products
- 11.2.5.3. SWOT Analysis
- 11.2.5.4. Recent Developments
- 11.2.5.5. Financials (Based on Availability)
- 11.2.6 KIKUSUI ELECTRONICS
- 11.2.6.1. Overview
- 11.2.6.2. Products
- 11.2.6.3. SWOT Analysis
- 11.2.6.4. Recent Developments
- 11.2.6.5. Financials (Based on Availability)
- 11.2.7 CINERGIA
- 11.2.7.1. Overview
- 11.2.7.2. Products
- 11.2.7.3. SWOT Analysis
- 11.2.7.4. Recent Developments
- 11.2.7.5. Financials (Based on Availability)
- 11.2.8 RECOM Power
- 11.2.8.1. Overview
- 11.2.8.2. Products
- 11.2.8.3. SWOT Analysis
- 11.2.8.4. Recent Developments
- 11.2.8.5. Financials (Based on Availability)
- 11.2.9 Chroma ATE
- 11.2.9.1. Overview
- 11.2.9.2. Products
- 11.2.9.3. SWOT Analysis
- 11.2.9.4. Recent Developments
- 11.2.9.5. Financials (Based on Availability)
- 11.2.10 Adaptive Power Systems
- 11.2.10.1. Overview
- 11.2.10.2. Products
- 11.2.10.3. SWOT Analysis
- 11.2.10.4. Recent Developments
- 11.2.10.5. Financials (Based on Availability)
- 11.2.11 Rohde & Schwarz
- 11.2.11.1. Overview
- 11.2.11.2. Products
- 11.2.11.3. SWOT Analysis
- 11.2.11.4. Recent Developments
- 11.2.11.5. Financials (Based on Availability)
- 11.2.12 ET System Electronic GmbH
- 11.2.12.1. Overview
- 11.2.12.2. Products
- 11.2.12.3. SWOT Analysis
- 11.2.12.4. Recent Developments
- 11.2.12.5. Financials (Based on Availability)
- 11.2.13 ETPS (Elba Electronics)
- 11.2.13.1. Overview
- 11.2.13.2. Products
- 11.2.13.3. SWOT Analysis
- 11.2.13.4. Recent Developments
- 11.2.13.5. Financials (Based on Availability)
- 11.2.14 Delta Elektronika
- 11.2.14.1. Overview
- 11.2.14.2. Products
- 11.2.14.3. SWOT Analysis
- 11.2.14.4. Recent Developments
- 11.2.14.5. Financials (Based on Availability)
- 11.2.15 Power4Test GmbH
- 11.2.15.1. Overview
- 11.2.15.2. Products
- 11.2.15.3. SWOT Analysis
- 11.2.15.4. Recent Developments
- 11.2.15.5. Financials (Based on Availability)
- 11.2.16 Regatron AG
- 11.2.16.1. Overview
- 11.2.16.2. Products
- 11.2.16.3. SWOT Analysis
- 11.2.16.4. Recent Developments
- 11.2.16.5. Financials (Based on Availability)
- 11.2.1 Matsusada Precision
List of Figures
- Figure 1: Global Bidirectional Power Supply Revenue Breakdown (billion, %) by Region 2025 & 2033
- Figure 2: Global Bidirectional Power Supply Volume Breakdown (K, %) by Region 2025 & 2033
- Figure 3: undefined Bidirectional Power Supply Revenue (billion), by Application 2025 & 2033
- Figure 4: undefined Bidirectional Power Supply Volume (K), by Application 2025 & 2033
- Figure 5: undefined Bidirectional Power Supply Revenue Share (%), by Application 2025 & 2033
- Figure 6: undefined Bidirectional Power Supply Volume Share (%), by Application 2025 & 2033
- Figure 7: undefined Bidirectional Power Supply Revenue (billion), by Type 2025 & 2033
- Figure 8: undefined Bidirectional Power Supply Volume (K), by Type 2025 & 2033
- Figure 9: undefined Bidirectional Power Supply Revenue Share (%), by Type 2025 & 2033
- Figure 10: undefined Bidirectional Power Supply Volume Share (%), by Type 2025 & 2033
- Figure 11: undefined Bidirectional Power Supply Revenue (billion), by Country 2025 & 2033
- Figure 12: undefined Bidirectional Power Supply Volume (K), by Country 2025 & 2033
- Figure 13: undefined Bidirectional Power Supply Revenue Share (%), by Country 2025 & 2033
- Figure 14: undefined Bidirectional Power Supply Volume Share (%), by Country 2025 & 2033
- Figure 15: undefined Bidirectional Power Supply Revenue (billion), by Application 2025 & 2033
- Figure 16: undefined Bidirectional Power Supply Volume (K), by Application 2025 & 2033
- Figure 17: undefined Bidirectional Power Supply Revenue Share (%), by Application 2025 & 2033
- Figure 18: undefined Bidirectional Power Supply Volume Share (%), by Application 2025 & 2033
- Figure 19: undefined Bidirectional Power Supply Revenue (billion), by Type 2025 & 2033
- Figure 20: undefined Bidirectional Power Supply Volume (K), by Type 2025 & 2033
- Figure 21: undefined Bidirectional Power Supply Revenue Share (%), by Type 2025 & 2033
- Figure 22: undefined Bidirectional Power Supply Volume Share (%), by Type 2025 & 2033
- Figure 23: undefined Bidirectional Power Supply Revenue (billion), by Country 2025 & 2033
- Figure 24: undefined Bidirectional Power Supply Volume (K), by Country 2025 & 2033
- Figure 25: undefined Bidirectional Power Supply Revenue Share (%), by Country 2025 & 2033
- Figure 26: undefined Bidirectional Power Supply Volume Share (%), by Country 2025 & 2033
- Figure 27: undefined Bidirectional Power Supply Revenue (billion), by Application 2025 & 2033
- Figure 28: undefined Bidirectional Power Supply Volume (K), by Application 2025 & 2033
- Figure 29: undefined Bidirectional Power Supply Revenue Share (%), by Application 2025 & 2033
- Figure 30: undefined Bidirectional Power Supply Volume Share (%), by Application 2025 & 2033
- Figure 31: undefined Bidirectional Power Supply Revenue (billion), by Type 2025 & 2033
- Figure 32: undefined Bidirectional Power Supply Volume (K), by Type 2025 & 2033
- Figure 33: undefined Bidirectional Power Supply Revenue Share (%), by Type 2025 & 2033
- Figure 34: undefined Bidirectional Power Supply Volume Share (%), by Type 2025 & 2033
- Figure 35: undefined Bidirectional Power Supply Revenue (billion), by Country 2025 & 2033
- Figure 36: undefined Bidirectional Power Supply Volume (K), by Country 2025 & 2033
- Figure 37: undefined Bidirectional Power Supply Revenue Share (%), by Country 2025 & 2033
- Figure 38: undefined Bidirectional Power Supply Volume Share (%), by Country 2025 & 2033
- Figure 39: undefined Bidirectional Power Supply Revenue (billion), by Application 2025 & 2033
- Figure 40: undefined Bidirectional Power Supply Volume (K), by Application 2025 & 2033
- Figure 41: undefined Bidirectional Power Supply Revenue Share (%), by Application 2025 & 2033
- Figure 42: undefined Bidirectional Power Supply Volume Share (%), by Application 2025 & 2033
- Figure 43: undefined Bidirectional Power Supply Revenue (billion), by Type 2025 & 2033
- Figure 44: undefined Bidirectional Power Supply Volume (K), by Type 2025 & 2033
- Figure 45: undefined Bidirectional Power Supply Revenue Share (%), by Type 2025 & 2033
- Figure 46: undefined Bidirectional Power Supply Volume Share (%), by Type 2025 & 2033
- Figure 47: undefined Bidirectional Power Supply Revenue (billion), by Country 2025 & 2033
- Figure 48: undefined Bidirectional Power Supply Volume (K), by Country 2025 & 2033
- Figure 49: undefined Bidirectional Power Supply Revenue Share (%), by Country 2025 & 2033
- Figure 50: undefined Bidirectional Power Supply Volume Share (%), by Country 2025 & 2033
- Figure 51: undefined Bidirectional Power Supply Revenue (billion), by Application 2025 & 2033
- Figure 52: undefined Bidirectional Power Supply Volume (K), by Application 2025 & 2033
- Figure 53: undefined Bidirectional Power Supply Revenue Share (%), by Application 2025 & 2033
- Figure 54: undefined Bidirectional Power Supply Volume Share (%), by Application 2025 & 2033
- Figure 55: undefined Bidirectional Power Supply Revenue (billion), by Type 2025 & 2033
- Figure 56: undefined Bidirectional Power Supply Volume (K), by Type 2025 & 2033
- Figure 57: undefined Bidirectional Power Supply Revenue Share (%), by Type 2025 & 2033
- Figure 58: undefined Bidirectional Power Supply Volume Share (%), by Type 2025 & 2033
- Figure 59: undefined Bidirectional Power Supply Revenue (billion), by Country 2025 & 2033
- Figure 60: undefined Bidirectional Power Supply Volume (K), by Country 2025 & 2033
- Figure 61: undefined Bidirectional Power Supply Revenue Share (%), by Country 2025 & 2033
- Figure 62: undefined Bidirectional Power Supply Volume Share (%), by Country 2025 & 2033
List of Tables
- Table 1: Global Bidirectional Power Supply Revenue billion Forecast, by Application 2020 & 2033
- Table 2: Global Bidirectional Power Supply Volume K Forecast, by Application 2020 & 2033
- Table 3: Global Bidirectional Power Supply Revenue billion Forecast, by Type 2020 & 2033
- Table 4: Global Bidirectional Power Supply Volume K Forecast, by Type 2020 & 2033
- Table 5: Global Bidirectional Power Supply Revenue billion Forecast, by Region 2020 & 2033
- Table 6: Global Bidirectional Power Supply Volume K Forecast, by Region 2020 & 2033
- Table 7: Global Bidirectional Power Supply Revenue billion Forecast, by Application 2020 & 2033
- Table 8: Global Bidirectional Power Supply Volume K Forecast, by Application 2020 & 2033
- Table 9: Global Bidirectional Power Supply Revenue billion Forecast, by Type 2020 & 2033
- Table 10: Global Bidirectional Power Supply Volume K Forecast, by Type 2020 & 2033
- Table 11: Global Bidirectional Power Supply Revenue billion Forecast, by Country 2020 & 2033
- Table 12: Global Bidirectional Power Supply Volume K Forecast, by Country 2020 & 2033
- Table 13: Global Bidirectional Power Supply Revenue billion Forecast, by Application 2020 & 2033
- Table 14: Global Bidirectional Power Supply Volume K Forecast, by Application 2020 & 2033
- Table 15: Global Bidirectional Power Supply Revenue billion Forecast, by Type 2020 & 2033
- Table 16: Global Bidirectional Power Supply Volume K Forecast, by Type 2020 & 2033
- Table 17: Global Bidirectional Power Supply Revenue billion Forecast, by Country 2020 & 2033
- Table 18: Global Bidirectional Power Supply Volume K Forecast, by Country 2020 & 2033
- Table 19: Global Bidirectional Power Supply Revenue billion Forecast, by Application 2020 & 2033
- Table 20: Global Bidirectional Power Supply Volume K Forecast, by Application 2020 & 2033
- Table 21: Global Bidirectional Power Supply Revenue billion Forecast, by Type 2020 & 2033
- Table 22: Global Bidirectional Power Supply Volume K Forecast, by Type 2020 & 2033
- Table 23: Global Bidirectional Power Supply Revenue billion Forecast, by Country 2020 & 2033
- Table 24: Global Bidirectional Power Supply Volume K Forecast, by Country 2020 & 2033
- Table 25: Global Bidirectional Power Supply Revenue billion Forecast, by Application 2020 & 2033
- Table 26: Global Bidirectional Power Supply Volume K Forecast, by Application 2020 & 2033
- Table 27: Global Bidirectional Power Supply Revenue billion Forecast, by Type 2020 & 2033
- Table 28: Global Bidirectional Power Supply Volume K Forecast, by Type 2020 & 2033
- Table 29: Global Bidirectional Power Supply Revenue billion Forecast, by Country 2020 & 2033
- Table 30: Global Bidirectional Power Supply Volume K Forecast, by Country 2020 & 2033
- Table 31: Global Bidirectional Power Supply Revenue billion Forecast, by Application 2020 & 2033
- Table 32: Global Bidirectional Power Supply Volume K Forecast, by Application 2020 & 2033
- Table 33: Global Bidirectional Power Supply Revenue billion Forecast, by Type 2020 & 2033
- Table 34: Global Bidirectional Power Supply Volume K Forecast, by Type 2020 & 2033
- Table 35: Global Bidirectional Power Supply Revenue billion Forecast, by Country 2020 & 2033
- Table 36: Global Bidirectional Power Supply Volume K Forecast, by Country 2020 & 2033
Frequently Asked Questions
1. What is the projected Compound Annual Growth Rate (CAGR) of the Bidirectional Power Supply?
The projected CAGR is approximately 11.65%.
2. Which companies are prominent players in the Bidirectional Power Supply?
Key companies in the market include Matsusada Precision, EA Elektro-Automatik, ITECH Electronics, MEAN WELL, Keysight, KIKUSUI ELECTRONICS, CINERGIA, RECOM Power, Chroma ATE, Adaptive Power Systems, Rohde & Schwarz, ET System Electronic GmbH, ETPS (Elba Electronics), Delta Elektronika, Power4Test GmbH, Regatron AG.
3. What are the main segments of the Bidirectional Power Supply?
The market segments include Application, Type.
4. Can you provide details about the market size?
The market size is estimated to be USD 10.96 billion as of 2022.
5. What are some drivers contributing to market growth?
N/A
6. What are the notable trends driving market growth?
N/A
7. Are there any restraints impacting market growth?
N/A
8. Can you provide examples of recent developments in the market?
N/A
9. What pricing options are available for accessing the report?
Pricing options include single-user, multi-user, and enterprise licenses priced at USD 3950.00, USD 5925.00, and USD 7900.00 respectively.
10. Is the market size provided in terms of value or volume?
The market size is provided in terms of value, measured in billion and volume, measured in K.
11. Are there any specific market keywords associated with the report?
Yes, the market keyword associated with the report is "Bidirectional Power Supply," which aids in identifying and referencing the specific market segment covered.
12. How do I determine which pricing option suits my needs best?
The pricing options vary based on user requirements and access needs. Individual users may opt for single-user licenses, while businesses requiring broader access may choose multi-user or enterprise licenses for cost-effective access to the report.
13. Are there any additional resources or data provided in the Bidirectional Power Supply report?
While the report offers comprehensive insights, it's advisable to review the specific contents or supplementary materials provided to ascertain if additional resources or data are available.
14. How can I stay updated on further developments or reports in the Bidirectional Power Supply?
To stay informed about further developments, trends, and reports in the Bidirectional Power Supply, consider subscribing to industry newsletters, following relevant companies and organizations, or regularly checking reputable industry news sources and publications.
Methodology
Step 1 - Identification of Relevant Samples Size from Population Database


Step 2 - Approaches for Defining Global Market Size (Value, Volume* & Price*)

Note*: In applicable scenarios
Step 3 - Data Sources
Primary Research
- Web Analytics
- Survey Reports
- Research Institute
- Latest Research Reports
- Opinion Leaders
Secondary Research
- Annual Reports
- White Paper
- Latest Press Release
- Industry Association
- Paid Database
- Investor Presentations

Step 4 - Data Triangulation
Involves using different sources of information in order to increase the validity of a study
These sources are likely to be stakeholders in a program - participants, other researchers, program staff, other community members, and so on.
Then we put all data in single framework & apply various statistical tools to find out the dynamic on the market.
During the analysis stage, feedback from the stakeholder groups would be compared to determine areas of agreement as well as areas of divergence

