
Key Insights
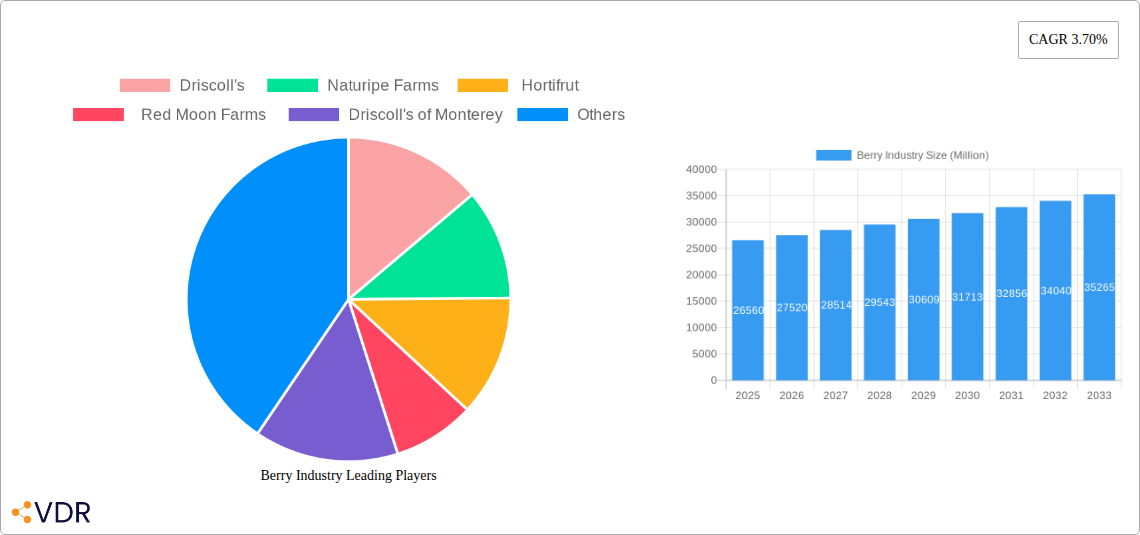
The global berry industry, valued at $26.56 billion in 2025, is poised for significant growth, projected to expand at a compound annual growth rate (CAGR) of 3.70% from 2025 to 2033. This expansion is driven by several key factors. Increasing consumer awareness of the health benefits associated with berries – rich in antioxidants and vitamins – fuels demand for fresh, frozen, and processed berry products across diverse applications. The rising popularity of functional foods and beverages, incorporating berries for their nutritional value, further stimulates market growth. Growth in the food and beverage industry, particularly in segments like yogurt, breakfast cereals, and smoothies, significantly contributes to berry consumption. Furthermore, the expanding retail sector, with increased availability of berries in supermarkets and specialty stores, enhances market accessibility. While challenges exist, such as seasonal production limitations and price fluctuations, technological advancements in berry cultivation and preservation are mitigating these concerns. The industry is also witnessing a rise in innovative product formats, including ready-to-eat berry bowls and convenient frozen berry packs, catering to evolving consumer preferences for convenience and healthy snacking options.
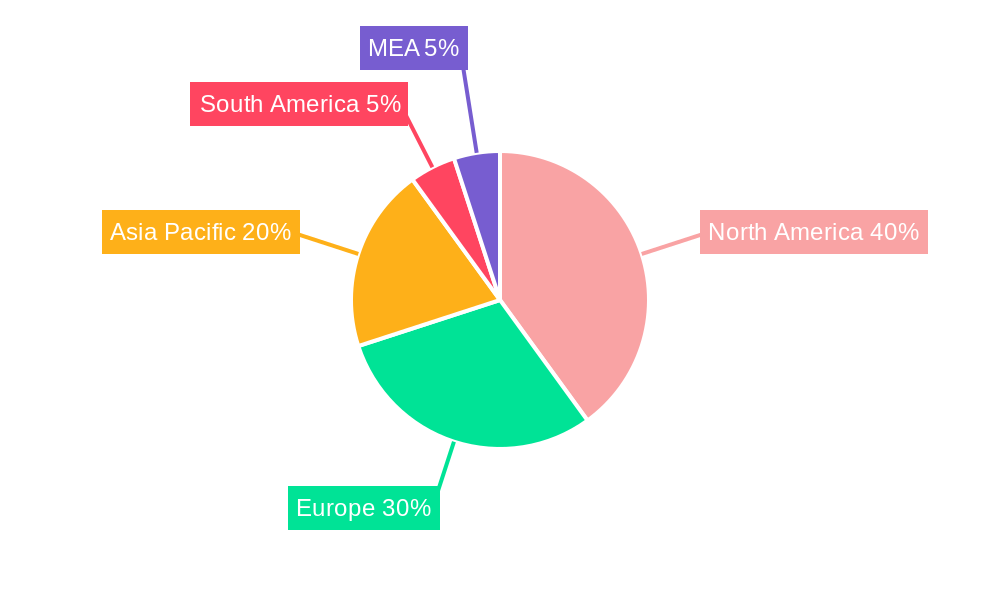
Regional variations in market performance are expected. North America, particularly the United States and Canada, holds a substantial market share due to high per capita consumption and established berry production infrastructure. Europe and Asia Pacific are also key regions, demonstrating robust growth potential driven by increasing disposable incomes and changing dietary habits. However, market entry barriers, such as stringent regulations and high transportation costs, may impact growth in certain emerging markets. The competitive landscape is characterized by both large multinational corporations and smaller regional producers, each vying for market share through product innovation, brand building, and strategic partnerships. The berry industry’s future trajectory indicates considerable growth opportunities, especially with the continued emphasis on healthy eating, convenience, and sustainable farming practices.
Berry Industry Market Report: 2019-2033
This comprehensive report provides a detailed analysis of the global berry industry, encompassing market dynamics, growth trends, key players, and future outlook. The study period covers 2019-2033, with 2025 as the base and estimated year. The report segments the market by type (Fresh, Frozen, Dried, Processed) and application (Food & Beverage, Retail, Healthcare), offering granular insights into each segment's performance and potential. This report is invaluable for industry professionals, investors, and stakeholders seeking a deep understanding of this dynamic market.
Berry Industry Market Dynamics & Structure
The global berry market is characterized by a moderately concentrated structure, with major players like Driscoll's, Naturipe Farms, and Hortifrut holding significant market share. Technological innovation, particularly in breeding, cultivation, and processing, is a key driver, while stringent regulatory frameworks concerning food safety and sustainability influence market dynamics. Competitive substitutes, such as other fruits and processed foods, exert pressure on berry consumption. End-user demographics, notably increasing health consciousness and demand for convenient, healthy snacks, are shaping market demand. M&A activity has been moderate in recent years, with deals primarily focused on expanding geographic reach and product portfolios.
- Market Concentration: The top 5 players hold approximately xx% of the global market share (2025 estimate).
- Technological Innovation: Focus on improved berry varieties, automation in harvesting and processing, and extended shelf-life technologies.
- Regulatory Framework: Stringent food safety standards and sustainable farming practices are key considerations.
- Competitive Substitutes: Other fruits (e.g., bananas, apples) and processed snacks compete for consumer spending.
- M&A Activity: xx M&A deals recorded between 2019-2024, with an average deal value of $xx million.
Berry Industry Growth Trends & Insights
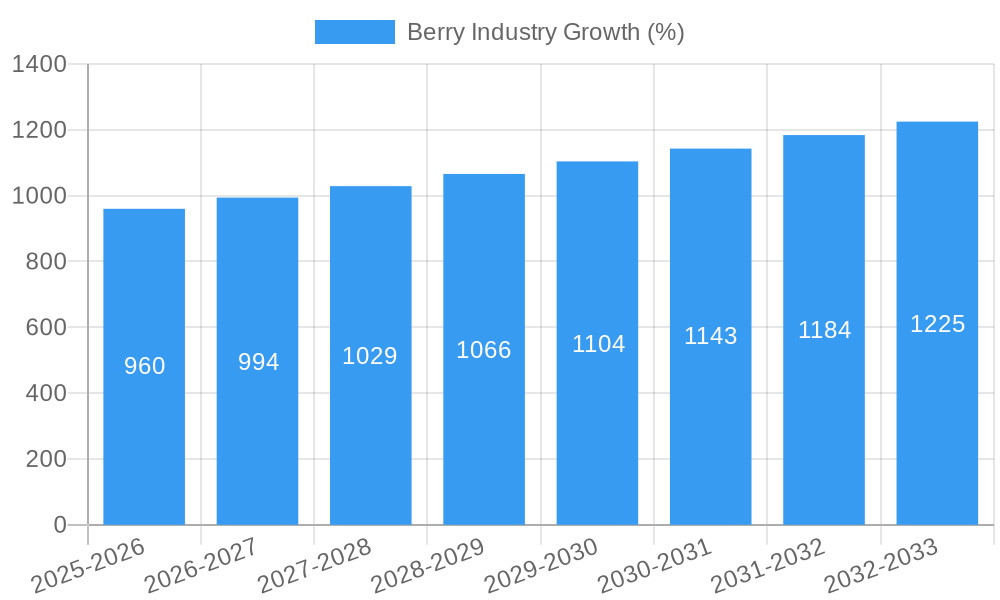
The global berry market experienced robust growth during the historical period (2019-2024), driven by factors such as increasing consumer demand for healthy foods, rising disposable incomes in emerging markets, and the introduction of innovative berry products. The market is expected to continue its expansion during the forecast period (2025-2033), albeit at a slightly moderated pace. Technological disruptions, such as precision agriculture and improved processing techniques, will enhance efficiency and product quality, further fueling market growth. Consumer behavior is shifting towards premium and convenient berry products, creating opportunities for value-added offerings.
- Market Size (2025): $xx Billion
- CAGR (2025-2033): xx%
- Market Penetration (2025): xx% in key markets
- Key Growth Drivers: Health consciousness, rising disposable incomes, product innovation
Dominant Regions, Countries, or Segments in Berry Industry
North America and Europe currently dominate the global berry market, driven by high per capita consumption, strong consumer demand for fresh and processed berries, and well-established distribution networks. Within the type segments, fresh berries account for the largest share, followed by frozen berries. The Food & Beverage industry remains the key application, leveraging berries for value addition in various products.
- Leading Region: North America (holds xx% market share in 2025)
- Key Drivers (North America): High disposable incomes, well-established retail infrastructure, strong demand for fresh berries.
- Fastest-Growing Segment: Processed berry products (driven by convenience and increasing demand for functional foods)
- High Growth Potential: Emerging markets in Asia and Latin America offering significant growth potential
Berry Industry Product Landscape
The berry product landscape is continuously evolving, with innovations focused on enhancing taste, extending shelf life, and providing added nutritional value. New berry varieties with improved flavor profiles and enhanced nutritional content are continuously being developed. Furthermore, processed berry products, such as jams, jellies, and frozen berry blends, are gaining popularity due to their convenience and versatility. These advancements are accompanied by technological improvements in cultivation, packaging, and processing, further enhancing product quality and minimizing waste.
Key Drivers, Barriers & Challenges in Berry Industry
Key Drivers: Growing health consciousness among consumers, increasing demand for functional foods, innovation in berry varieties and processing technologies, and rising disposable incomes in emerging markets.
Challenges & Restraints: Supply chain disruptions, weather variability affecting yields, stringent regulatory requirements increasing compliance costs, and intense competition among berry producers and suppliers. These factors can lead to price volatility and reduced profitability for some players. Estimated annual loss due to weather variability: $xx million (2024 estimate).
Emerging Opportunities in Berry Industry
Emerging opportunities lie in tapping into the growing demand for organic and sustainably produced berries, exploring innovative applications in nutraceuticals and functional foods, and penetrating untapped markets in developing countries. The increasing popularity of plant-based diets and the growing interest in convenient, healthy snacks present further opportunities for growth.
Growth Accelerators in the Berry Industry
Technological advancements such as precision agriculture and improved processing techniques are key catalysts driving long-term growth. Strategic partnerships, especially between berry producers and food manufacturers, can accelerate market expansion and product innovation. Efforts to improve supply chain efficiency and sustainability will further enhance the industry's competitiveness and growth prospects.
Key Players Shaping the Berry Industry Market
- Driscoll's
- Naturipe Farms
- Hortifrut
- Red Moon Farms
- Driscoll's of Monterey
Notable Milestones in Berry Industry Sector
- May 2022: Driscoll's launched Tropical Bliss, a new premium strawberry line.
- October 2023: Naturipe Farms launched the “Sweet Selections” premium berries line.
In-Depth Berry Industry Market Outlook
The global berry market is poised for sustained growth over the forecast period, driven by the aforementioned factors. Strategic investments in innovation, supply chain optimization, and market expansion will be crucial for success in this competitive landscape. Companies focusing on sustainability and offering high-quality, convenient products will be well-positioned to capitalize on future market opportunities. The continued focus on premiumization and value-added products will also be key drivers of growth.
Berry Industry Segmentation
- 1. Production Analysis
- 2. Consumption Analysis
- 3. Import Market Analysis (Value & Volume)
- 4. Export Market Analysis (Value & Volume)
- 5. Price Trend Analysis
Berry Industry Segmentation By Geography
-
1. North America
- 1.1. United States
- 1.2. Canada
-
2. Europe
- 2.1. Germany
- 2.2. United Kingdom
- 2.3. France
- 2.4. Spain
- 2.5. Netherlands
- 2.6. Poland
-
3. Asia Pacific
- 3.1. China
- 3.2. Australia
- 3.3. India
- 3.4. Japan
-
4. South America
- 4.1. Brazil
- 4.2. Argentina
-
5. Africa
- 5.1. South Africa
- 5.2. Egypt
Berry Industry REPORT HIGHLIGHTS
| Aspects | Details |
|---|---|
| Study Period | 2019-2033 |
| Base Year | 2024 |
| Estimated Year | 2025 |
| Forecast Period | 2025-2033 |
| Historical Period | 2019-2024 |
| Growth Rate | CAGR of 3.70% from 2019-2033 |
| Segmentation |
|
Table of Contents
- 1. Introduction
- 1.1. Research Scope
- 1.2. Market Segmentation
- 1.3. Research Methodology
- 1.4. Definitions and Assumptions
- 2. Executive Summary
- 2.1. Introduction
- 3. Market Dynamics
- 3.1. Introduction
- 3.2. Market Drivers
- 3.2.1. Increasing Berry Consumption for Health Benefits; Increasing Adoption of High-Technology Farm Practices; Growing Usage of Berries in the Food and Beverage Industries
- 3.3. Market Restrains
- 3.3.1. High Production Cost Involved in Berry Production; Increasing Disease and Pest Infestations
- 3.4. Market Trends
- 3.4.1. Increasing Export of Berries from United States is Driving the Market
- 4. Market Factor Analysis
- 4.1. Porters Five Forces
- 4.2. Supply/Value Chain
- 4.3. PESTEL analysis
- 4.4. Market Entropy
- 4.5. Patent/Trademark Analysis
- 5. Global Berry Industry Analysis, Insights and Forecast, 2019-2031
- 5.1. Market Analysis, Insights and Forecast - by Production Analysis
- 5.2. Market Analysis, Insights and Forecast - by Consumption Analysis
- 5.3. Market Analysis, Insights and Forecast - by Import Market Analysis (Value & Volume)
- 5.4. Market Analysis, Insights and Forecast - by Export Market Analysis (Value & Volume)
- 5.5. Market Analysis, Insights and Forecast - by Price Trend Analysis
- 5.6. Market Analysis, Insights and Forecast - by Region
- 5.6.1. North America
- 5.6.2. Europe
- 5.6.3. Asia Pacific
- 5.6.4. South America
- 5.6.5. Africa
- 5.1. Market Analysis, Insights and Forecast - by Production Analysis
- 6. North America Berry Industry Analysis, Insights and Forecast, 2019-2031
- 6.1. Market Analysis, Insights and Forecast - by Production Analysis
- 6.2. Market Analysis, Insights and Forecast - by Consumption Analysis
- 6.3. Market Analysis, Insights and Forecast - by Import Market Analysis (Value & Volume)
- 6.4. Market Analysis, Insights and Forecast - by Export Market Analysis (Value & Volume)
- 6.5. Market Analysis, Insights and Forecast - by Price Trend Analysis
- 6.1. Market Analysis, Insights and Forecast - by Production Analysis
- 7. Europe Berry Industry Analysis, Insights and Forecast, 2019-2031
- 7.1. Market Analysis, Insights and Forecast - by Production Analysis
- 7.2. Market Analysis, Insights and Forecast - by Consumption Analysis
- 7.3. Market Analysis, Insights and Forecast - by Import Market Analysis (Value & Volume)
- 7.4. Market Analysis, Insights and Forecast - by Export Market Analysis (Value & Volume)
- 7.5. Market Analysis, Insights and Forecast - by Price Trend Analysis
- 7.1. Market Analysis, Insights and Forecast - by Production Analysis
- 8. Asia Pacific Berry Industry Analysis, Insights and Forecast, 2019-2031
- 8.1. Market Analysis, Insights and Forecast - by Production Analysis
- 8.2. Market Analysis, Insights and Forecast - by Consumption Analysis
- 8.3. Market Analysis, Insights and Forecast - by Import Market Analysis (Value & Volume)
- 8.4. Market Analysis, Insights and Forecast - by Export Market Analysis (Value & Volume)
- 8.5. Market Analysis, Insights and Forecast - by Price Trend Analysis
- 8.1. Market Analysis, Insights and Forecast - by Production Analysis
- 9. South America Berry Industry Analysis, Insights and Forecast, 2019-2031
- 9.1. Market Analysis, Insights and Forecast - by Production Analysis
- 9.2. Market Analysis, Insights and Forecast - by Consumption Analysis
- 9.3. Market Analysis, Insights and Forecast - by Import Market Analysis (Value & Volume)
- 9.4. Market Analysis, Insights and Forecast - by Export Market Analysis (Value & Volume)
- 9.5. Market Analysis, Insights and Forecast - by Price Trend Analysis
- 9.1. Market Analysis, Insights and Forecast - by Production Analysis
- 10. Africa Berry Industry Analysis, Insights and Forecast, 2019-2031
- 10.1. Market Analysis, Insights and Forecast - by Production Analysis
- 10.2. Market Analysis, Insights and Forecast - by Consumption Analysis
- 10.3. Market Analysis, Insights and Forecast - by Import Market Analysis (Value & Volume)
- 10.4. Market Analysis, Insights and Forecast - by Export Market Analysis (Value & Volume)
- 10.5. Market Analysis, Insights and Forecast - by Price Trend Analysis
- 10.1. Market Analysis, Insights and Forecast - by Production Analysis
- 11. North America Berry Industry Analysis, Insights and Forecast, 2019-2031
- 11.1. Market Analysis, Insights and Forecast - By Country/Sub-region
- 11.1.1 United States
- 11.1.2 Canada
- 11.1.3 Mexico
- 12. Europe Berry Industry Analysis, Insights and Forecast, 2019-2031
- 12.1. Market Analysis, Insights and Forecast - By Country/Sub-region
- 12.1.1 Germany
- 12.1.2 United Kingdom
- 12.1.3 France
- 12.1.4 Spain
- 12.1.5 Italy
- 12.1.6 Spain
- 12.1.7 Belgium
- 12.1.8 Netherland
- 12.1.9 Nordics
- 12.1.10 Rest of Europe
- 13. Asia Pacific Berry Industry Analysis, Insights and Forecast, 2019-2031
- 13.1. Market Analysis, Insights and Forecast - By Country/Sub-region
- 13.1.1 China
- 13.1.2 Japan
- 13.1.3 India
- 13.1.4 South Korea
- 13.1.5 Southeast Asia
- 13.1.6 Australia
- 13.1.7 Indonesia
- 13.1.8 Phillipes
- 13.1.9 Singapore
- 13.1.10 Thailandc
- 13.1.11 Rest of Asia Pacific
- 14. South America Berry Industry Analysis, Insights and Forecast, 2019-2031
- 14.1. Market Analysis, Insights and Forecast - By Country/Sub-region
- 14.1.1 Brazil
- 14.1.2 Argentina
- 14.1.3 Peru
- 14.1.4 Chile
- 14.1.5 Colombia
- 14.1.6 Ecuador
- 14.1.7 Venezuela
- 14.1.8 Rest of South America
- 15. MEA Berry Industry Analysis, Insights and Forecast, 2019-2031
- 15.1. Market Analysis, Insights and Forecast - By Country/Sub-region
- 15.1.1 United Arab Emirates
- 15.1.2 Saudi Arabia
- 15.1.3 South Africa
- 15.1.4 Rest of Middle East and Africa
- 16. Competitive Analysis
- 16.1. Global Market Share Analysis 2024
- 16.2. Company Profiles
- 16.2.1 Driscoll's
- 16.2.1.1. Overview
- 16.2.1.2. Products
- 16.2.1.3. SWOT Analysis
- 16.2.1.4. Recent Developments
- 16.2.1.5. Financials (Based on Availability)
- 16.2.2 Naturipe Farms
- 16.2.2.1. Overview
- 16.2.2.2. Products
- 16.2.2.3. SWOT Analysis
- 16.2.2.4. Recent Developments
- 16.2.2.5. Financials (Based on Availability)
- 16.2.3 Hortifrut
- 16.2.3.1. Overview
- 16.2.3.2. Products
- 16.2.3.3. SWOT Analysis
- 16.2.3.4. Recent Developments
- 16.2.3.5. Financials (Based on Availability)
- 16.2.4 Red Moon Farms
- 16.2.4.1. Overview
- 16.2.4.2. Products
- 16.2.4.3. SWOT Analysis
- 16.2.4.4. Recent Developments
- 16.2.4.5. Financials (Based on Availability)
- 16.2.5 Driscoll's of Monterey
- 16.2.5.1. Overview
- 16.2.5.2. Products
- 16.2.5.3. SWOT Analysis
- 16.2.5.4. Recent Developments
- 16.2.5.5. Financials (Based on Availability)
- 16.2.1 Driscoll's
List of Figures
- Figure 1: Global Berry Industry Revenue Breakdown (Million, %) by Region 2024 & 2032
- Figure 2: North America Berry Industry Revenue (Million), by Country 2024 & 2032
- Figure 3: North America Berry Industry Revenue Share (%), by Country 2024 & 2032
- Figure 4: Europe Berry Industry Revenue (Million), by Country 2024 & 2032
- Figure 5: Europe Berry Industry Revenue Share (%), by Country 2024 & 2032
- Figure 6: Asia Pacific Berry Industry Revenue (Million), by Country 2024 & 2032
- Figure 7: Asia Pacific Berry Industry Revenue Share (%), by Country 2024 & 2032
- Figure 8: South America Berry Industry Revenue (Million), by Country 2024 & 2032
- Figure 9: South America Berry Industry Revenue Share (%), by Country 2024 & 2032
- Figure 10: MEA Berry Industry Revenue (Million), by Country 2024 & 2032
- Figure 11: MEA Berry Industry Revenue Share (%), by Country 2024 & 2032
- Figure 12: North America Berry Industry Revenue (Million), by Production Analysis 2024 & 2032
- Figure 13: North America Berry Industry Revenue Share (%), by Production Analysis 2024 & 2032
- Figure 14: North America Berry Industry Revenue (Million), by Consumption Analysis 2024 & 2032
- Figure 15: North America Berry Industry Revenue Share (%), by Consumption Analysis 2024 & 2032
- Figure 16: North America Berry Industry Revenue (Million), by Import Market Analysis (Value & Volume) 2024 & 2032
- Figure 17: North America Berry Industry Revenue Share (%), by Import Market Analysis (Value & Volume) 2024 & 2032
- Figure 18: North America Berry Industry Revenue (Million), by Export Market Analysis (Value & Volume) 2024 & 2032
- Figure 19: North America Berry Industry Revenue Share (%), by Export Market Analysis (Value & Volume) 2024 & 2032
- Figure 20: North America Berry Industry Revenue (Million), by Price Trend Analysis 2024 & 2032
- Figure 21: North America Berry Industry Revenue Share (%), by Price Trend Analysis 2024 & 2032
- Figure 22: North America Berry Industry Revenue (Million), by Country 2024 & 2032
- Figure 23: North America Berry Industry Revenue Share (%), by Country 2024 & 2032
- Figure 24: Europe Berry Industry Revenue (Million), by Production Analysis 2024 & 2032
- Figure 25: Europe Berry Industry Revenue Share (%), by Production Analysis 2024 & 2032
- Figure 26: Europe Berry Industry Revenue (Million), by Consumption Analysis 2024 & 2032
- Figure 27: Europe Berry Industry Revenue Share (%), by Consumption Analysis 2024 & 2032
- Figure 28: Europe Berry Industry Revenue (Million), by Import Market Analysis (Value & Volume) 2024 & 2032
- Figure 29: Europe Berry Industry Revenue Share (%), by Import Market Analysis (Value & Volume) 2024 & 2032
- Figure 30: Europe Berry Industry Revenue (Million), by Export Market Analysis (Value & Volume) 2024 & 2032
- Figure 31: Europe Berry Industry Revenue Share (%), by Export Market Analysis (Value & Volume) 2024 & 2032
- Figure 32: Europe Berry Industry Revenue (Million), by Price Trend Analysis 2024 & 2032
- Figure 33: Europe Berry Industry Revenue Share (%), by Price Trend Analysis 2024 & 2032
- Figure 34: Europe Berry Industry Revenue (Million), by Country 2024 & 2032
- Figure 35: Europe Berry Industry Revenue Share (%), by Country 2024 & 2032
- Figure 36: Asia Pacific Berry Industry Revenue (Million), by Production Analysis 2024 & 2032
- Figure 37: Asia Pacific Berry Industry Revenue Share (%), by Production Analysis 2024 & 2032
- Figure 38: Asia Pacific Berry Industry Revenue (Million), by Consumption Analysis 2024 & 2032
- Figure 39: Asia Pacific Berry Industry Revenue Share (%), by Consumption Analysis 2024 & 2032
- Figure 40: Asia Pacific Berry Industry Revenue (Million), by Import Market Analysis (Value & Volume) 2024 & 2032
- Figure 41: Asia Pacific Berry Industry Revenue Share (%), by Import Market Analysis (Value & Volume) 2024 & 2032
- Figure 42: Asia Pacific Berry Industry Revenue (Million), by Export Market Analysis (Value & Volume) 2024 & 2032
- Figure 43: Asia Pacific Berry Industry Revenue Share (%), by Export Market Analysis (Value & Volume) 2024 & 2032
- Figure 44: Asia Pacific Berry Industry Revenue (Million), by Price Trend Analysis 2024 & 2032
- Figure 45: Asia Pacific Berry Industry Revenue Share (%), by Price Trend Analysis 2024 & 2032
- Figure 46: Asia Pacific Berry Industry Revenue (Million), by Country 2024 & 2032
- Figure 47: Asia Pacific Berry Industry Revenue Share (%), by Country 2024 & 2032
- Figure 48: South America Berry Industry Revenue (Million), by Production Analysis 2024 & 2032
- Figure 49: South America Berry Industry Revenue Share (%), by Production Analysis 2024 & 2032
- Figure 50: South America Berry Industry Revenue (Million), by Consumption Analysis 2024 & 2032
- Figure 51: South America Berry Industry Revenue Share (%), by Consumption Analysis 2024 & 2032
- Figure 52: South America Berry Industry Revenue (Million), by Import Market Analysis (Value & Volume) 2024 & 2032
- Figure 53: South America Berry Industry Revenue Share (%), by Import Market Analysis (Value & Volume) 2024 & 2032
- Figure 54: South America Berry Industry Revenue (Million), by Export Market Analysis (Value & Volume) 2024 & 2032
- Figure 55: South America Berry Industry Revenue Share (%), by Export Market Analysis (Value & Volume) 2024 & 2032
- Figure 56: South America Berry Industry Revenue (Million), by Price Trend Analysis 2024 & 2032
- Figure 57: South America Berry Industry Revenue Share (%), by Price Trend Analysis 2024 & 2032
- Figure 58: South America Berry Industry Revenue (Million), by Country 2024 & 2032
- Figure 59: South America Berry Industry Revenue Share (%), by Country 2024 & 2032
- Figure 60: Africa Berry Industry Revenue (Million), by Production Analysis 2024 & 2032
- Figure 61: Africa Berry Industry Revenue Share (%), by Production Analysis 2024 & 2032
- Figure 62: Africa Berry Industry Revenue (Million), by Consumption Analysis 2024 & 2032
- Figure 63: Africa Berry Industry Revenue Share (%), by Consumption Analysis 2024 & 2032
- Figure 64: Africa Berry Industry Revenue (Million), by Import Market Analysis (Value & Volume) 2024 & 2032
- Figure 65: Africa Berry Industry Revenue Share (%), by Import Market Analysis (Value & Volume) 2024 & 2032
- Figure 66: Africa Berry Industry Revenue (Million), by Export Market Analysis (Value & Volume) 2024 & 2032
- Figure 67: Africa Berry Industry Revenue Share (%), by Export Market Analysis (Value & Volume) 2024 & 2032
- Figure 68: Africa Berry Industry Revenue (Million), by Price Trend Analysis 2024 & 2032
- Figure 69: Africa Berry Industry Revenue Share (%), by Price Trend Analysis 2024 & 2032
- Figure 70: Africa Berry Industry Revenue (Million), by Country 2024 & 2032
- Figure 71: Africa Berry Industry Revenue Share (%), by Country 2024 & 2032
List of Tables
- Table 1: Global Berry Industry Revenue Million Forecast, by Region 2019 & 2032
- Table 2: Global Berry Industry Revenue Million Forecast, by Production Analysis 2019 & 2032
- Table 3: Global Berry Industry Revenue Million Forecast, by Consumption Analysis 2019 & 2032
- Table 4: Global Berry Industry Revenue Million Forecast, by Import Market Analysis (Value & Volume) 2019 & 2032
- Table 5: Global Berry Industry Revenue Million Forecast, by Export Market Analysis (Value & Volume) 2019 & 2032
- Table 6: Global Berry Industry Revenue Million Forecast, by Price Trend Analysis 2019 & 2032
- Table 7: Global Berry Industry Revenue Million Forecast, by Region 2019 & 2032
- Table 8: Global Berry Industry Revenue Million Forecast, by Country 2019 & 2032
- Table 9: United States Berry Industry Revenue (Million) Forecast, by Application 2019 & 2032
- Table 10: Canada Berry Industry Revenue (Million) Forecast, by Application 2019 & 2032
- Table 11: Mexico Berry Industry Revenue (Million) Forecast, by Application 2019 & 2032
- Table 12: Global Berry Industry Revenue Million Forecast, by Country 2019 & 2032
- Table 13: Germany Berry Industry Revenue (Million) Forecast, by Application 2019 & 2032
- Table 14: United Kingdom Berry Industry Revenue (Million) Forecast, by Application 2019 & 2032
- Table 15: France Berry Industry Revenue (Million) Forecast, by Application 2019 & 2032
- Table 16: Spain Berry Industry Revenue (Million) Forecast, by Application 2019 & 2032
- Table 17: Italy Berry Industry Revenue (Million) Forecast, by Application 2019 & 2032
- Table 18: Spain Berry Industry Revenue (Million) Forecast, by Application 2019 & 2032
- Table 19: Belgium Berry Industry Revenue (Million) Forecast, by Application 2019 & 2032
- Table 20: Netherland Berry Industry Revenue (Million) Forecast, by Application 2019 & 2032
- Table 21: Nordics Berry Industry Revenue (Million) Forecast, by Application 2019 & 2032
- Table 22: Rest of Europe Berry Industry Revenue (Million) Forecast, by Application 2019 & 2032
- Table 23: Global Berry Industry Revenue Million Forecast, by Country 2019 & 2032
- Table 24: China Berry Industry Revenue (Million) Forecast, by Application 2019 & 2032
- Table 25: Japan Berry Industry Revenue (Million) Forecast, by Application 2019 & 2032
- Table 26: India Berry Industry Revenue (Million) Forecast, by Application 2019 & 2032
- Table 27: South Korea Berry Industry Revenue (Million) Forecast, by Application 2019 & 2032
- Table 28: Southeast Asia Berry Industry Revenue (Million) Forecast, by Application 2019 & 2032
- Table 29: Australia Berry Industry Revenue (Million) Forecast, by Application 2019 & 2032
- Table 30: Indonesia Berry Industry Revenue (Million) Forecast, by Application 2019 & 2032
- Table 31: Phillipes Berry Industry Revenue (Million) Forecast, by Application 2019 & 2032
- Table 32: Singapore Berry Industry Revenue (Million) Forecast, by Application 2019 & 2032
- Table 33: Thailandc Berry Industry Revenue (Million) Forecast, by Application 2019 & 2032
- Table 34: Rest of Asia Pacific Berry Industry Revenue (Million) Forecast, by Application 2019 & 2032
- Table 35: Global Berry Industry Revenue Million Forecast, by Country 2019 & 2032
- Table 36: Brazil Berry Industry Revenue (Million) Forecast, by Application 2019 & 2032
- Table 37: Argentina Berry Industry Revenue (Million) Forecast, by Application 2019 & 2032
- Table 38: Peru Berry Industry Revenue (Million) Forecast, by Application 2019 & 2032
- Table 39: Chile Berry Industry Revenue (Million) Forecast, by Application 2019 & 2032
- Table 40: Colombia Berry Industry Revenue (Million) Forecast, by Application 2019 & 2032
- Table 41: Ecuador Berry Industry Revenue (Million) Forecast, by Application 2019 & 2032
- Table 42: Venezuela Berry Industry Revenue (Million) Forecast, by Application 2019 & 2032
- Table 43: Rest of South America Berry Industry Revenue (Million) Forecast, by Application 2019 & 2032
- Table 44: Global Berry Industry Revenue Million Forecast, by Country 2019 & 2032
- Table 45: United Arab Emirates Berry Industry Revenue (Million) Forecast, by Application 2019 & 2032
- Table 46: Saudi Arabia Berry Industry Revenue (Million) Forecast, by Application 2019 & 2032
- Table 47: South Africa Berry Industry Revenue (Million) Forecast, by Application 2019 & 2032
- Table 48: Rest of Middle East and Africa Berry Industry Revenue (Million) Forecast, by Application 2019 & 2032
- Table 49: Global Berry Industry Revenue Million Forecast, by Production Analysis 2019 & 2032
- Table 50: Global Berry Industry Revenue Million Forecast, by Consumption Analysis 2019 & 2032
- Table 51: Global Berry Industry Revenue Million Forecast, by Import Market Analysis (Value & Volume) 2019 & 2032
- Table 52: Global Berry Industry Revenue Million Forecast, by Export Market Analysis (Value & Volume) 2019 & 2032
- Table 53: Global Berry Industry Revenue Million Forecast, by Price Trend Analysis 2019 & 2032
- Table 54: Global Berry Industry Revenue Million Forecast, by Country 2019 & 2032
- Table 55: United States Berry Industry Revenue (Million) Forecast, by Application 2019 & 2032
- Table 56: Canada Berry Industry Revenue (Million) Forecast, by Application 2019 & 2032
- Table 57: Global Berry Industry Revenue Million Forecast, by Production Analysis 2019 & 2032
- Table 58: Global Berry Industry Revenue Million Forecast, by Consumption Analysis 2019 & 2032
- Table 59: Global Berry Industry Revenue Million Forecast, by Import Market Analysis (Value & Volume) 2019 & 2032
- Table 60: Global Berry Industry Revenue Million Forecast, by Export Market Analysis (Value & Volume) 2019 & 2032
- Table 61: Global Berry Industry Revenue Million Forecast, by Price Trend Analysis 2019 & 2032
- Table 62: Global Berry Industry Revenue Million Forecast, by Country 2019 & 2032
- Table 63: Germany Berry Industry Revenue (Million) Forecast, by Application 2019 & 2032
- Table 64: United Kingdom Berry Industry Revenue (Million) Forecast, by Application 2019 & 2032
- Table 65: France Berry Industry Revenue (Million) Forecast, by Application 2019 & 2032
- Table 66: Spain Berry Industry Revenue (Million) Forecast, by Application 2019 & 2032
- Table 67: Netherlands Berry Industry Revenue (Million) Forecast, by Application 2019 & 2032
- Table 68: Poland Berry Industry Revenue (Million) Forecast, by Application 2019 & 2032
- Table 69: Global Berry Industry Revenue Million Forecast, by Production Analysis 2019 & 2032
- Table 70: Global Berry Industry Revenue Million Forecast, by Consumption Analysis 2019 & 2032
- Table 71: Global Berry Industry Revenue Million Forecast, by Import Market Analysis (Value & Volume) 2019 & 2032
- Table 72: Global Berry Industry Revenue Million Forecast, by Export Market Analysis (Value & Volume) 2019 & 2032
- Table 73: Global Berry Industry Revenue Million Forecast, by Price Trend Analysis 2019 & 2032
- Table 74: Global Berry Industry Revenue Million Forecast, by Country 2019 & 2032
- Table 75: China Berry Industry Revenue (Million) Forecast, by Application 2019 & 2032
- Table 76: Australia Berry Industry Revenue (Million) Forecast, by Application 2019 & 2032
- Table 77: India Berry Industry Revenue (Million) Forecast, by Application 2019 & 2032
- Table 78: Japan Berry Industry Revenue (Million) Forecast, by Application 2019 & 2032
- Table 79: Global Berry Industry Revenue Million Forecast, by Production Analysis 2019 & 2032
- Table 80: Global Berry Industry Revenue Million Forecast, by Consumption Analysis 2019 & 2032
- Table 81: Global Berry Industry Revenue Million Forecast, by Import Market Analysis (Value & Volume) 2019 & 2032
- Table 82: Global Berry Industry Revenue Million Forecast, by Export Market Analysis (Value & Volume) 2019 & 2032
- Table 83: Global Berry Industry Revenue Million Forecast, by Price Trend Analysis 2019 & 2032
- Table 84: Global Berry Industry Revenue Million Forecast, by Country 2019 & 2032
- Table 85: Brazil Berry Industry Revenue (Million) Forecast, by Application 2019 & 2032
- Table 86: Argentina Berry Industry Revenue (Million) Forecast, by Application 2019 & 2032
- Table 87: Global Berry Industry Revenue Million Forecast, by Production Analysis 2019 & 2032
- Table 88: Global Berry Industry Revenue Million Forecast, by Consumption Analysis 2019 & 2032
- Table 89: Global Berry Industry Revenue Million Forecast, by Import Market Analysis (Value & Volume) 2019 & 2032
- Table 90: Global Berry Industry Revenue Million Forecast, by Export Market Analysis (Value & Volume) 2019 & 2032
- Table 91: Global Berry Industry Revenue Million Forecast, by Price Trend Analysis 2019 & 2032
- Table 92: Global Berry Industry Revenue Million Forecast, by Country 2019 & 2032
- Table 93: South Africa Berry Industry Revenue (Million) Forecast, by Application 2019 & 2032
- Table 94: Egypt Berry Industry Revenue (Million) Forecast, by Application 2019 & 2032
Frequently Asked Questions
1. What is the projected Compound Annual Growth Rate (CAGR) of the Berry Industry?
The projected CAGR is approximately 3.70%.
2. Which companies are prominent players in the Berry Industry?
Key companies in the market include Driscoll's , Naturipe Farms , Hortifrut, Red Moon Farms , Driscoll's of Monterey.
3. What are the main segments of the Berry Industry?
The market segments include Production Analysis, Consumption Analysis, Import Market Analysis (Value & Volume), Export Market Analysis (Value & Volume), Price Trend Analysis.
4. Can you provide details about the market size?
The market size is estimated to be USD 26.56 Million as of 2022.
5. What are some drivers contributing to market growth?
Increasing Berry Consumption for Health Benefits; Increasing Adoption of High-Technology Farm Practices; Growing Usage of Berries in the Food and Beverage Industries.
6. What are the notable trends driving market growth?
Increasing Export of Berries from United States is Driving the Market.
7. Are there any restraints impacting market growth?
High Production Cost Involved in Berry Production; Increasing Disease and Pest Infestations.
8. Can you provide examples of recent developments in the market?
October 2023: Naturipe Farms has launched the “Sweet Selections” premium berries line. The Sweet Selections line featured Naturipe’s proprietary berry varieties that were meticulously bred and selected for high flavor and overall eating experience.
9. What pricing options are available for accessing the report?
Pricing options include single-user, multi-user, and enterprise licenses priced at USD 4750, USD 5250, and USD 8750 respectively.
10. Is the market size provided in terms of value or volume?
The market size is provided in terms of value, measured in Million.
11. Are there any specific market keywords associated with the report?
Yes, the market keyword associated with the report is "Berry Industry," which aids in identifying and referencing the specific market segment covered.
12. How do I determine which pricing option suits my needs best?
The pricing options vary based on user requirements and access needs. Individual users may opt for single-user licenses, while businesses requiring broader access may choose multi-user or enterprise licenses for cost-effective access to the report.
13. Are there any additional resources or data provided in the Berry Industry report?
While the report offers comprehensive insights, it's advisable to review the specific contents or supplementary materials provided to ascertain if additional resources or data are available.
14. How can I stay updated on further developments or reports in the Berry Industry?
To stay informed about further developments, trends, and reports in the Berry Industry, consider subscribing to industry newsletters, following relevant companies and organizations, or regularly checking reputable industry news sources and publications.
Methodology
Step 1 - Identification of Relevant Samples Size from Population Database


Step 2 - Approaches for Defining Global Market Size (Value, Volume* & Price*)

Note*: In applicable scenarios
Step 3 - Data Sources
Primary Research
- Web Analytics
- Survey Reports
- Research Institute
- Latest Research Reports
- Opinion Leaders
Secondary Research
- Annual Reports
- White Paper
- Latest Press Release
- Industry Association
- Paid Database
- Investor Presentations

Step 4 - Data Triangulation
Involves using different sources of information in order to increase the validity of a study
These sources are likely to be stakeholders in a program - participants, other researchers, program staff, other community members, and so on.
Then we put all data in single framework & apply various statistical tools to find out the dynamic on the market.
During the analysis stage, feedback from the stakeholder groups would be compared to determine areas of agreement as well as areas of divergence


