
Key Insights
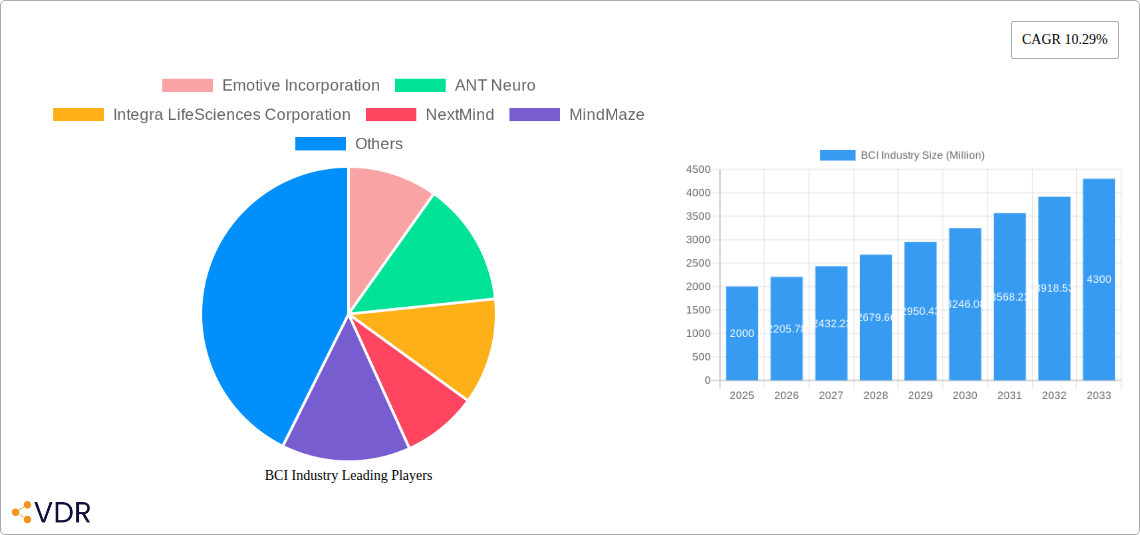
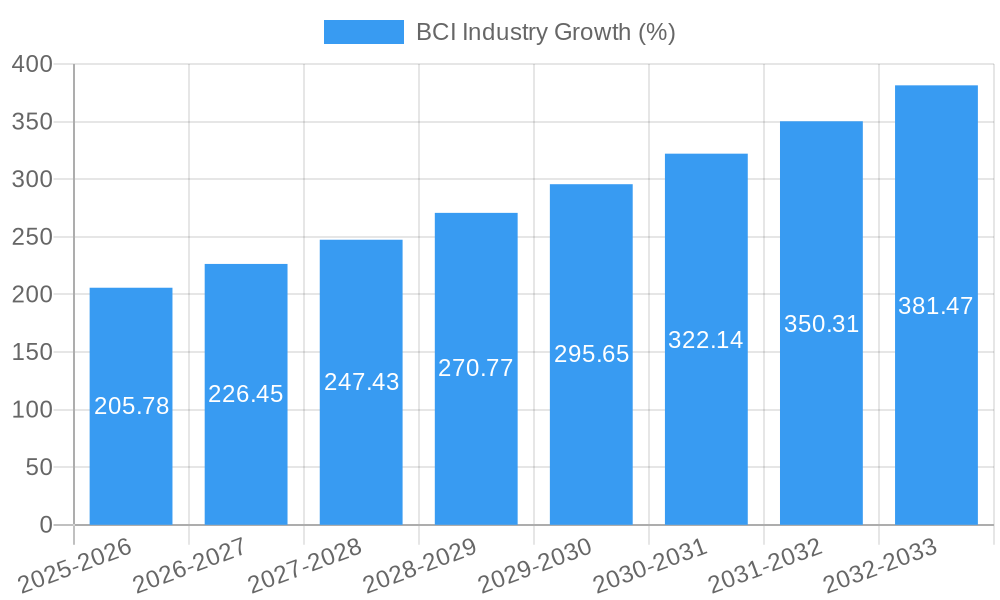
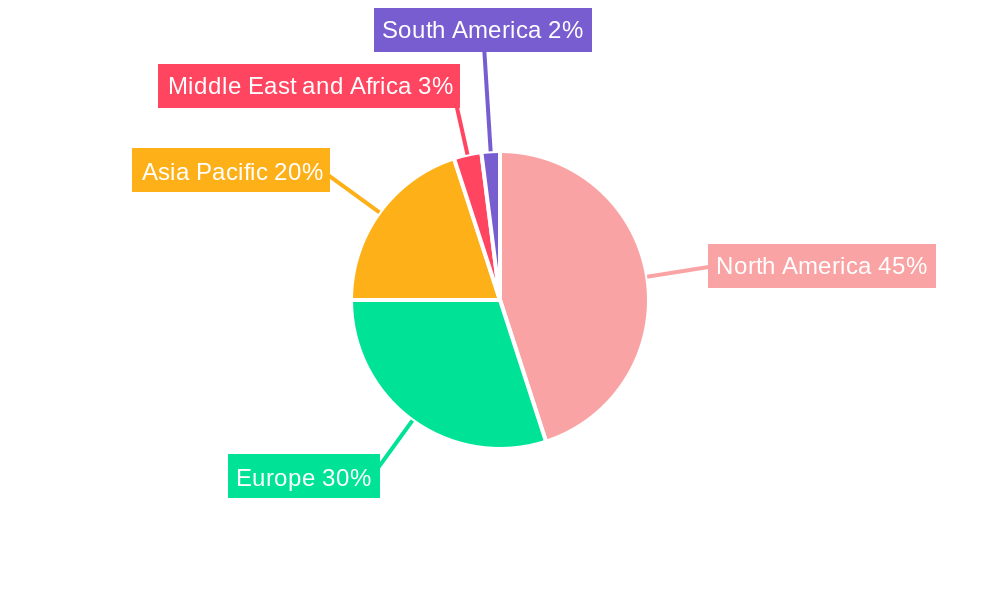
The Brain-Computer Interface (BCI) market is experiencing significant growth, projected to reach \$2 billion in 2025 and expand at a Compound Annual Growth Rate (CAGR) of 10.29% from 2025 to 2033. This expansion is driven by several factors. Technological advancements are leading to more sophisticated and less invasive BCI systems, making them accessible to a wider range of patients and applications. The increasing prevalence of neurological disorders like stroke, Parkinson's disease, and spinal cord injuries fuels demand for BCI-based therapies that can restore lost functions. Furthermore, the growing interest in using BCIs for enhancing human capabilities in areas like gaming, virtual reality, and neuroprosthetics contributes to market growth. The non-invasive segment is expected to witness substantial growth due to its ease of use and reduced risk compared to invasive procedures. Restoration of disabilities remains the largest application segment, but the repair of brain function and other applications are rapidly gaining traction as research and technology evolve. North America currently holds a dominant market share, owing to significant investments in research and development, presence of key players, and well-established healthcare infrastructure. However, Asia Pacific is expected to show faster growth due to rising awareness, increased healthcare spending, and a large patient pool.
Competition in the BCI market is intense, with established medical device companies alongside emerging technology startups vying for market share. Companies like Medtronic, Integra LifeSciences, and Natus Medical are leveraging their expertise in neurotechnology to develop and commercialize advanced BCI systems. Simultaneously, innovative startups such as Emotiv, NextMind, and MindMaze are driving innovation by developing cutting-edge BCI technologies. The future of the BCI market hinges on ongoing research and development, regulatory approvals, and addressing safety concerns associated with invasive procedures. Successful navigation of these challenges will pave the way for wider adoption of BCI technologies and transform the treatment of neurological disorders and enhance human capabilities in the years to come.
Brain-Computer Interface (BCI) Industry Market Report: 2019-2033
This comprehensive report provides an in-depth analysis of the Brain-Computer Interface (BCI) industry, encompassing market dynamics, growth trends, regional segmentation, competitive landscape, and future outlook. The report covers the period from 2019 to 2033, with a focus on the estimated year 2025. It serves as an essential resource for industry professionals, investors, and researchers seeking to understand and capitalize on the burgeoning opportunities within the BCI market (Parent Market: Neurotechnology; Child Market: Assistive Technology).
BCI Industry Market Dynamics & Structure
The BCI market, valued at $xx million in 2025, is characterized by a moderately concentrated landscape with key players like Medtronic PLC and Integra LifeSciences Corporation holding significant market share. Technological innovation, particularly in non-invasive BCI devices and advanced signal processing, is a major driver. Stringent regulatory approvals for medical applications pose a barrier to entry, while the increasing prevalence of neurological disorders fuels market growth. The market is witnessing a rise in strategic partnerships and mergers & acquisitions (M&A), with an estimated xx M&A deals in the historical period (2019-2024).
- Market Concentration: Moderately concentrated, with top 5 players holding xx% market share in 2025.
- Technological Innovation: Significant advancements in AI, machine learning, and miniaturization drive product development.
- Regulatory Framework: Stringent FDA and other global regulatory hurdles affect market penetration, particularly for invasive BCIs.
- Competitive Substitutes: Traditional assistive technologies and pharmacological treatments pose competitive challenges.
- End-User Demographics: Growing aging population and increased prevalence of neurological disorders create substantial demand.
- M&A Trends: Strategic acquisitions and partnerships are reshaping the competitive landscape, driving innovation and market consolidation.
BCI Industry Growth Trends & Insights
The BCI market is experiencing substantial growth, driven by increasing adoption rates across diverse applications. The market size is projected to reach $xx million by 2033, exhibiting a CAGR of xx% during the forecast period (2025-2033). Technological advancements, particularly in non-invasive techniques, are lowering barriers to entry and driving broader market penetration. Consumer behavior is shifting towards minimally invasive and personalized solutions, furthering market expansion. The restoration of disabilities segment is anticipated to dominate, driven by a growing demand for improved quality of life for patients with paralysis and other neurological conditions.
Dominant Regions, Countries, or Segments in BCI Industry
North America holds the largest market share in the BCI industry in 2025, driven by robust healthcare infrastructure, significant R&D investment, and a high prevalence of neurological disorders. The invasive BCI type currently dominates the market due to its potential for higher accuracy and broader applications. However, the non-invasive segment is experiencing the fastest growth due to its ease of use, lower cost, and reduced invasiveness. Within applications, restoration of disabilities is the leading segment, fueled by significant demand for assistive technologies.
- Key Drivers in North America: Strong healthcare infrastructure, high R&D spending, favorable regulatory environment.
- Invasive BCI Dominance: Driven by superior accuracy and capabilities for complex applications.
- Non-Invasive BCI Growth: Fastest-growing segment due to increased accessibility and affordability.
- Restoration of Disabilities: Leading application segment due to high demand and significant unmet medical needs.
BCI Industry Product Landscape
The BCI product landscape is evolving rapidly, with innovations in both invasive and non-invasive technologies. Non-invasive systems are becoming more sophisticated, leveraging advanced signal processing and machine learning algorithms to improve accuracy and reliability. Invasive BCIs are progressing towards smaller, implantable devices with enhanced biocompatibility. Key performance metrics include signal-to-noise ratio, accuracy, response time, and biocompatibility. Unique selling propositions often center on improved user experience, enhanced accuracy, and minimally invasive procedures.
Key Drivers, Barriers & Challenges in BCI Industry
Key Drivers: Technological advancements (AI, machine learning), increasing prevalence of neurological disorders, rising healthcare expenditure, government initiatives supporting assistive technologies.
Challenges: High costs associated with R&D and manufacturing, stringent regulatory approvals, limited market awareness, ethical concerns related to data privacy and brain-computer interaction. The supply chain for specialized components can also pose a significant challenge to the industry, leading to potential production delays and increased costs. These challenges impact approximately xx% of the industry.
Emerging Opportunities in BCI Industry
Emerging opportunities lie in untapped markets, particularly in developing economies with large populations facing neurological disorders. Innovative applications in gaming, virtual reality, and human-computer interaction are also driving growth. Personalized BCI solutions tailored to individual patient needs present a significant market opportunity. Increased consumer awareness and changing preferences towards less invasive technologies create additional avenues for market expansion.
Growth Accelerators in the BCI Industry
Technological breakthroughs in neural decoding and brain-computer interfaces are key catalysts for long-term growth. Strategic partnerships between technology companies and healthcare providers facilitate product development and market access. Expansion into new therapeutic areas and geographical regions will significantly propel market growth.
Key Players Shaping the BCI Industry Market
- Emotive Incorporation
- ANT Neuro
- Integra LifeSciences Corporation
- NextMind
- MindMaze
- NIRx Medical Technologies
- Natus Medical Inc
- Compumedics Ltd
- Medtronic PLC
- Advanced Brain Monitoring Inc
- NeuroSky
- Brain Products GmbH
- Cadwell Industries Inc
- g tec medical engineering GmbH
- Nihon Kohden Corporation
Notable Milestones in BCI Industry Sector
- 2020/10: Medtronic PLC launched a new generation of deep brain stimulation (DBS) technology.
- 2022/05: Integra LifeSciences Corporation secured FDA approval for a new BCI device.
- 2023/02: A major strategic partnership was announced between Emotive Incorporation and a leading technology company. (Specific details would be added here in the full report)
In-Depth BCI Industry Market Outlook
The BCI market is poised for significant growth, driven by continuous technological innovation and increasing demand for assistive technologies. Strategic partnerships, expansion into new applications, and addressing current challenges will be crucial for realizing the full potential of this transformative technology. The focus on non-invasive devices and their increasing accuracy will likely be major factors in market expansion.
BCI Industry Segmentation
-
1. Type
- 1.1. Invasive Brain-computer Interface
- 1.2. Non-invasive Brain-computer Interface
- 1.3. Other Types
-
2. Application
- 2.1. Restoration of Disabilities
- 2.2. Repair of Brain Function
- 2.3. Other Applications
BCI Industry Segmentation By Geography
-
1. North America
- 1.1. United States
- 1.2. Canada
- 1.3. Mexico
-
2. Europe
- 2.1. Germany
- 2.2. United Kingdom
- 2.3. France
- 2.4. Italy
- 2.5. Spain
- 2.6. Rest of Europe
-
3. Asia Pacific
- 3.1. China
- 3.2. Japan
- 3.3. India
- 3.4. Australia
- 3.5. South Korea
- 3.6. Rest of Asia Pacific
-
4. Middle East and Africa
- 4.1. GCC
- 4.2. South Africa
- 4.3. Rest of Middle East and Africa
-
5. South America
- 5.1. Brazil
- 5.2. Argentina
- 5.3. Rest of South America
BCI Industry REPORT HIGHLIGHTS
| Aspects | Details |
|---|---|
| Study Period | 2019-2033 |
| Base Year | 2024 |
| Estimated Year | 2025 |
| Forecast Period | 2025-2033 |
| Historical Period | 2019-2024 |
| Growth Rate | CAGR of 10.29% from 2019-2033 |
| Segmentation |
|
Table of Contents
- 1. Introduction
- 1.1. Research Scope
- 1.2. Market Segmentation
- 1.3. Research Methodology
- 1.4. Definitions and Assumptions
- 2. Executive Summary
- 2.1. Introduction
- 3. Market Dynamics
- 3.1. Introduction
- 3.2. Market Drivers
- 3.2.1. Increasing Prevalence of Neurodegenerative Disorders; Rising R&D Activities by Government to Improve the Brain-computer Interface Technology; Various Technological Advancements such as Miniaturization of Devices
- 3.3. Market Restrains
- 3.3.1. High Cost of Brain-computer Interface Devices; Lack of Expertise in Implementing the Systems
- 3.4. Market Trends
- 3.4.1. The Non-invasive Brain-computer Interface Segment is Expected to Dominate the Market During the Forecast Period
- 4. Market Factor Analysis
- 4.1. Porters Five Forces
- 4.2. Supply/Value Chain
- 4.3. PESTEL analysis
- 4.4. Market Entropy
- 4.5. Patent/Trademark Analysis
- 5. Global BCI Industry Analysis, Insights and Forecast, 2019-2031
- 5.1. Market Analysis, Insights and Forecast - by Type
- 5.1.1. Invasive Brain-computer Interface
- 5.1.2. Non-invasive Brain-computer Interface
- 5.1.3. Other Types
- 5.2. Market Analysis, Insights and Forecast - by Application
- 5.2.1. Restoration of Disabilities
- 5.2.2. Repair of Brain Function
- 5.2.3. Other Applications
- 5.3. Market Analysis, Insights and Forecast - by Region
- 5.3.1. North America
- 5.3.2. Europe
- 5.3.3. Asia Pacific
- 5.3.4. Middle East and Africa
- 5.3.5. South America
- 5.1. Market Analysis, Insights and Forecast - by Type
- 6. North America BCI Industry Analysis, Insights and Forecast, 2019-2031
- 6.1. Market Analysis, Insights and Forecast - by Type
- 6.1.1. Invasive Brain-computer Interface
- 6.1.2. Non-invasive Brain-computer Interface
- 6.1.3. Other Types
- 6.2. Market Analysis, Insights and Forecast - by Application
- 6.2.1. Restoration of Disabilities
- 6.2.2. Repair of Brain Function
- 6.2.3. Other Applications
- 6.1. Market Analysis, Insights and Forecast - by Type
- 7. Europe BCI Industry Analysis, Insights and Forecast, 2019-2031
- 7.1. Market Analysis, Insights and Forecast - by Type
- 7.1.1. Invasive Brain-computer Interface
- 7.1.2. Non-invasive Brain-computer Interface
- 7.1.3. Other Types
- 7.2. Market Analysis, Insights and Forecast - by Application
- 7.2.1. Restoration of Disabilities
- 7.2.2. Repair of Brain Function
- 7.2.3. Other Applications
- 7.1. Market Analysis, Insights and Forecast - by Type
- 8. Asia Pacific BCI Industry Analysis, Insights and Forecast, 2019-2031
- 8.1. Market Analysis, Insights and Forecast - by Type
- 8.1.1. Invasive Brain-computer Interface
- 8.1.2. Non-invasive Brain-computer Interface
- 8.1.3. Other Types
- 8.2. Market Analysis, Insights and Forecast - by Application
- 8.2.1. Restoration of Disabilities
- 8.2.2. Repair of Brain Function
- 8.2.3. Other Applications
- 8.1. Market Analysis, Insights and Forecast - by Type
- 9. Middle East and Africa BCI Industry Analysis, Insights and Forecast, 2019-2031
- 9.1. Market Analysis, Insights and Forecast - by Type
- 9.1.1. Invasive Brain-computer Interface
- 9.1.2. Non-invasive Brain-computer Interface
- 9.1.3. Other Types
- 9.2. Market Analysis, Insights and Forecast - by Application
- 9.2.1. Restoration of Disabilities
- 9.2.2. Repair of Brain Function
- 9.2.3. Other Applications
- 9.1. Market Analysis, Insights and Forecast - by Type
- 10. South America BCI Industry Analysis, Insights and Forecast, 2019-2031
- 10.1. Market Analysis, Insights and Forecast - by Type
- 10.1.1. Invasive Brain-computer Interface
- 10.1.2. Non-invasive Brain-computer Interface
- 10.1.3. Other Types
- 10.2. Market Analysis, Insights and Forecast - by Application
- 10.2.1. Restoration of Disabilities
- 10.2.2. Repair of Brain Function
- 10.2.3. Other Applications
- 10.1. Market Analysis, Insights and Forecast - by Type
- 11. North America BCI Industry Analysis, Insights and Forecast, 2019-2031
- 11.1. Market Analysis, Insights and Forecast - By Country/Sub-region
- 11.1.1 United States
- 11.1.2 Canada
- 11.1.3 Mexico
- 12. Europe BCI Industry Analysis, Insights and Forecast, 2019-2031
- 12.1. Market Analysis, Insights and Forecast - By Country/Sub-region
- 12.1.1 Germany
- 12.1.2 United Kingdom
- 12.1.3 France
- 12.1.4 Italy
- 12.1.5 Spain
- 12.1.6 Rest of Europe
- 13. Asia Pacific BCI Industry Analysis, Insights and Forecast, 2019-2031
- 13.1. Market Analysis, Insights and Forecast - By Country/Sub-region
- 13.1.1 China
- 13.1.2 Japan
- 13.1.3 India
- 13.1.4 Australia
- 13.1.5 South Korea
- 13.1.6 Rest of Asia Pacific
- 14. Middle East and Africa BCI Industry Analysis, Insights and Forecast, 2019-2031
- 14.1. Market Analysis, Insights and Forecast - By Country/Sub-region
- 14.1.1 GCC
- 14.1.2 South Africa
- 14.1.3 Rest of Middle East and Africa
- 15. South America BCI Industry Analysis, Insights and Forecast, 2019-2031
- 15.1. Market Analysis, Insights and Forecast - By Country/Sub-region
- 15.1.1 Brazil
- 15.1.2 Argentina
- 15.1.3 Rest of South America
- 16. Competitive Analysis
- 16.1. Global Market Share Analysis 2024
- 16.2. Company Profiles
- 16.2.1 Emotive Incorporation
- 16.2.1.1. Overview
- 16.2.1.2. Products
- 16.2.1.3. SWOT Analysis
- 16.2.1.4. Recent Developments
- 16.2.1.5. Financials (Based on Availability)
- 16.2.2 ANT Neuro
- 16.2.2.1. Overview
- 16.2.2.2. Products
- 16.2.2.3. SWOT Analysis
- 16.2.2.4. Recent Developments
- 16.2.2.5. Financials (Based on Availability)
- 16.2.3 Integra LifeSciences Corporation
- 16.2.3.1. Overview
- 16.2.3.2. Products
- 16.2.3.3. SWOT Analysis
- 16.2.3.4. Recent Developments
- 16.2.3.5. Financials (Based on Availability)
- 16.2.4 NextMind
- 16.2.4.1. Overview
- 16.2.4.2. Products
- 16.2.4.3. SWOT Analysis
- 16.2.4.4. Recent Developments
- 16.2.4.5. Financials (Based on Availability)
- 16.2.5 MindMaze
- 16.2.5.1. Overview
- 16.2.5.2. Products
- 16.2.5.3. SWOT Analysis
- 16.2.5.4. Recent Developments
- 16.2.5.5. Financials (Based on Availability)
- 16.2.6 NIRx Medical Technologies
- 16.2.6.1. Overview
- 16.2.6.2. Products
- 16.2.6.3. SWOT Analysis
- 16.2.6.4. Recent Developments
- 16.2.6.5. Financials (Based on Availability)
- 16.2.7 Natus Medical Inc
- 16.2.7.1. Overview
- 16.2.7.2. Products
- 16.2.7.3. SWOT Analysis
- 16.2.7.4. Recent Developments
- 16.2.7.5. Financials (Based on Availability)
- 16.2.8 Compumedics Ltd
- 16.2.8.1. Overview
- 16.2.8.2. Products
- 16.2.8.3. SWOT Analysis
- 16.2.8.4. Recent Developments
- 16.2.8.5. Financials (Based on Availability)
- 16.2.9 Medtronic PLC
- 16.2.9.1. Overview
- 16.2.9.2. Products
- 16.2.9.3. SWOT Analysis
- 16.2.9.4. Recent Developments
- 16.2.9.5. Financials (Based on Availability)
- 16.2.10 Advanced Brain Monitoring Inc
- 16.2.10.1. Overview
- 16.2.10.2. Products
- 16.2.10.3. SWOT Analysis
- 16.2.10.4. Recent Developments
- 16.2.10.5. Financials (Based on Availability)
- 16.2.11 NeuroSky
- 16.2.11.1. Overview
- 16.2.11.2. Products
- 16.2.11.3. SWOT Analysis
- 16.2.11.4. Recent Developments
- 16.2.11.5. Financials (Based on Availability)
- 16.2.12 Brain Products GmbH
- 16.2.12.1. Overview
- 16.2.12.2. Products
- 16.2.12.3. SWOT Analysis
- 16.2.12.4. Recent Developments
- 16.2.12.5. Financials (Based on Availability)
- 16.2.13 Cadwell Industries Inc
- 16.2.13.1. Overview
- 16.2.13.2. Products
- 16.2.13.3. SWOT Analysis
- 16.2.13.4. Recent Developments
- 16.2.13.5. Financials (Based on Availability)
- 16.2.14 g tec medical engineering GmbH
- 16.2.14.1. Overview
- 16.2.14.2. Products
- 16.2.14.3. SWOT Analysis
- 16.2.14.4. Recent Developments
- 16.2.14.5. Financials (Based on Availability)
- 16.2.15 Nihon Kohden Corporation
- 16.2.15.1. Overview
- 16.2.15.2. Products
- 16.2.15.3. SWOT Analysis
- 16.2.15.4. Recent Developments
- 16.2.15.5. Financials (Based on Availability)
- 16.2.1 Emotive Incorporation
List of Figures
- Figure 1: Global BCI Industry Revenue Breakdown (Million, %) by Region 2024 & 2032
- Figure 2: Global BCI Industry Volume Breakdown (K Unit, %) by Region 2024 & 2032
- Figure 3: North America BCI Industry Revenue (Million), by Country 2024 & 2032
- Figure 4: North America BCI Industry Volume (K Unit), by Country 2024 & 2032
- Figure 5: North America BCI Industry Revenue Share (%), by Country 2024 & 2032
- Figure 6: North America BCI Industry Volume Share (%), by Country 2024 & 2032
- Figure 7: Europe BCI Industry Revenue (Million), by Country 2024 & 2032
- Figure 8: Europe BCI Industry Volume (K Unit), by Country 2024 & 2032
- Figure 9: Europe BCI Industry Revenue Share (%), by Country 2024 & 2032
- Figure 10: Europe BCI Industry Volume Share (%), by Country 2024 & 2032
- Figure 11: Asia Pacific BCI Industry Revenue (Million), by Country 2024 & 2032
- Figure 12: Asia Pacific BCI Industry Volume (K Unit), by Country 2024 & 2032
- Figure 13: Asia Pacific BCI Industry Revenue Share (%), by Country 2024 & 2032
- Figure 14: Asia Pacific BCI Industry Volume Share (%), by Country 2024 & 2032
- Figure 15: Middle East and Africa BCI Industry Revenue (Million), by Country 2024 & 2032
- Figure 16: Middle East and Africa BCI Industry Volume (K Unit), by Country 2024 & 2032
- Figure 17: Middle East and Africa BCI Industry Revenue Share (%), by Country 2024 & 2032
- Figure 18: Middle East and Africa BCI Industry Volume Share (%), by Country 2024 & 2032
- Figure 19: South America BCI Industry Revenue (Million), by Country 2024 & 2032
- Figure 20: South America BCI Industry Volume (K Unit), by Country 2024 & 2032
- Figure 21: South America BCI Industry Revenue Share (%), by Country 2024 & 2032
- Figure 22: South America BCI Industry Volume Share (%), by Country 2024 & 2032
- Figure 23: North America BCI Industry Revenue (Million), by Type 2024 & 2032
- Figure 24: North America BCI Industry Volume (K Unit), by Type 2024 & 2032
- Figure 25: North America BCI Industry Revenue Share (%), by Type 2024 & 2032
- Figure 26: North America BCI Industry Volume Share (%), by Type 2024 & 2032
- Figure 27: North America BCI Industry Revenue (Million), by Application 2024 & 2032
- Figure 28: North America BCI Industry Volume (K Unit), by Application 2024 & 2032
- Figure 29: North America BCI Industry Revenue Share (%), by Application 2024 & 2032
- Figure 30: North America BCI Industry Volume Share (%), by Application 2024 & 2032
- Figure 31: North America BCI Industry Revenue (Million), by Country 2024 & 2032
- Figure 32: North America BCI Industry Volume (K Unit), by Country 2024 & 2032
- Figure 33: North America BCI Industry Revenue Share (%), by Country 2024 & 2032
- Figure 34: North America BCI Industry Volume Share (%), by Country 2024 & 2032
- Figure 35: Europe BCI Industry Revenue (Million), by Type 2024 & 2032
- Figure 36: Europe BCI Industry Volume (K Unit), by Type 2024 & 2032
- Figure 37: Europe BCI Industry Revenue Share (%), by Type 2024 & 2032
- Figure 38: Europe BCI Industry Volume Share (%), by Type 2024 & 2032
- Figure 39: Europe BCI Industry Revenue (Million), by Application 2024 & 2032
- Figure 40: Europe BCI Industry Volume (K Unit), by Application 2024 & 2032
- Figure 41: Europe BCI Industry Revenue Share (%), by Application 2024 & 2032
- Figure 42: Europe BCI Industry Volume Share (%), by Application 2024 & 2032
- Figure 43: Europe BCI Industry Revenue (Million), by Country 2024 & 2032
- Figure 44: Europe BCI Industry Volume (K Unit), by Country 2024 & 2032
- Figure 45: Europe BCI Industry Revenue Share (%), by Country 2024 & 2032
- Figure 46: Europe BCI Industry Volume Share (%), by Country 2024 & 2032
- Figure 47: Asia Pacific BCI Industry Revenue (Million), by Type 2024 & 2032
- Figure 48: Asia Pacific BCI Industry Volume (K Unit), by Type 2024 & 2032
- Figure 49: Asia Pacific BCI Industry Revenue Share (%), by Type 2024 & 2032
- Figure 50: Asia Pacific BCI Industry Volume Share (%), by Type 2024 & 2032
- Figure 51: Asia Pacific BCI Industry Revenue (Million), by Application 2024 & 2032
- Figure 52: Asia Pacific BCI Industry Volume (K Unit), by Application 2024 & 2032
- Figure 53: Asia Pacific BCI Industry Revenue Share (%), by Application 2024 & 2032
- Figure 54: Asia Pacific BCI Industry Volume Share (%), by Application 2024 & 2032
- Figure 55: Asia Pacific BCI Industry Revenue (Million), by Country 2024 & 2032
- Figure 56: Asia Pacific BCI Industry Volume (K Unit), by Country 2024 & 2032
- Figure 57: Asia Pacific BCI Industry Revenue Share (%), by Country 2024 & 2032
- Figure 58: Asia Pacific BCI Industry Volume Share (%), by Country 2024 & 2032
- Figure 59: Middle East and Africa BCI Industry Revenue (Million), by Type 2024 & 2032
- Figure 60: Middle East and Africa BCI Industry Volume (K Unit), by Type 2024 & 2032
- Figure 61: Middle East and Africa BCI Industry Revenue Share (%), by Type 2024 & 2032
- Figure 62: Middle East and Africa BCI Industry Volume Share (%), by Type 2024 & 2032
- Figure 63: Middle East and Africa BCI Industry Revenue (Million), by Application 2024 & 2032
- Figure 64: Middle East and Africa BCI Industry Volume (K Unit), by Application 2024 & 2032
- Figure 65: Middle East and Africa BCI Industry Revenue Share (%), by Application 2024 & 2032
- Figure 66: Middle East and Africa BCI Industry Volume Share (%), by Application 2024 & 2032
- Figure 67: Middle East and Africa BCI Industry Revenue (Million), by Country 2024 & 2032
- Figure 68: Middle East and Africa BCI Industry Volume (K Unit), by Country 2024 & 2032
- Figure 69: Middle East and Africa BCI Industry Revenue Share (%), by Country 2024 & 2032
- Figure 70: Middle East and Africa BCI Industry Volume Share (%), by Country 2024 & 2032
- Figure 71: South America BCI Industry Revenue (Million), by Type 2024 & 2032
- Figure 72: South America BCI Industry Volume (K Unit), by Type 2024 & 2032
- Figure 73: South America BCI Industry Revenue Share (%), by Type 2024 & 2032
- Figure 74: South America BCI Industry Volume Share (%), by Type 2024 & 2032
- Figure 75: South America BCI Industry Revenue (Million), by Application 2024 & 2032
- Figure 76: South America BCI Industry Volume (K Unit), by Application 2024 & 2032
- Figure 77: South America BCI Industry Revenue Share (%), by Application 2024 & 2032
- Figure 78: South America BCI Industry Volume Share (%), by Application 2024 & 2032
- Figure 79: South America BCI Industry Revenue (Million), by Country 2024 & 2032
- Figure 80: South America BCI Industry Volume (K Unit), by Country 2024 & 2032
- Figure 81: South America BCI Industry Revenue Share (%), by Country 2024 & 2032
- Figure 82: South America BCI Industry Volume Share (%), by Country 2024 & 2032
List of Tables
- Table 1: Global BCI Industry Revenue Million Forecast, by Region 2019 & 2032
- Table 2: Global BCI Industry Volume K Unit Forecast, by Region 2019 & 2032
- Table 3: Global BCI Industry Revenue Million Forecast, by Type 2019 & 2032
- Table 4: Global BCI Industry Volume K Unit Forecast, by Type 2019 & 2032
- Table 5: Global BCI Industry Revenue Million Forecast, by Application 2019 & 2032
- Table 6: Global BCI Industry Volume K Unit Forecast, by Application 2019 & 2032
- Table 7: Global BCI Industry Revenue Million Forecast, by Region 2019 & 2032
- Table 8: Global BCI Industry Volume K Unit Forecast, by Region 2019 & 2032
- Table 9: Global BCI Industry Revenue Million Forecast, by Country 2019 & 2032
- Table 10: Global BCI Industry Volume K Unit Forecast, by Country 2019 & 2032
- Table 11: United States BCI Industry Revenue (Million) Forecast, by Application 2019 & 2032
- Table 12: United States BCI Industry Volume (K Unit) Forecast, by Application 2019 & 2032
- Table 13: Canada BCI Industry Revenue (Million) Forecast, by Application 2019 & 2032
- Table 14: Canada BCI Industry Volume (K Unit) Forecast, by Application 2019 & 2032
- Table 15: Mexico BCI Industry Revenue (Million) Forecast, by Application 2019 & 2032
- Table 16: Mexico BCI Industry Volume (K Unit) Forecast, by Application 2019 & 2032
- Table 17: Global BCI Industry Revenue Million Forecast, by Country 2019 & 2032
- Table 18: Global BCI Industry Volume K Unit Forecast, by Country 2019 & 2032
- Table 19: Germany BCI Industry Revenue (Million) Forecast, by Application 2019 & 2032
- Table 20: Germany BCI Industry Volume (K Unit) Forecast, by Application 2019 & 2032
- Table 21: United Kingdom BCI Industry Revenue (Million) Forecast, by Application 2019 & 2032
- Table 22: United Kingdom BCI Industry Volume (K Unit) Forecast, by Application 2019 & 2032
- Table 23: France BCI Industry Revenue (Million) Forecast, by Application 2019 & 2032
- Table 24: France BCI Industry Volume (K Unit) Forecast, by Application 2019 & 2032
- Table 25: Italy BCI Industry Revenue (Million) Forecast, by Application 2019 & 2032
- Table 26: Italy BCI Industry Volume (K Unit) Forecast, by Application 2019 & 2032
- Table 27: Spain BCI Industry Revenue (Million) Forecast, by Application 2019 & 2032
- Table 28: Spain BCI Industry Volume (K Unit) Forecast, by Application 2019 & 2032
- Table 29: Rest of Europe BCI Industry Revenue (Million) Forecast, by Application 2019 & 2032
- Table 30: Rest of Europe BCI Industry Volume (K Unit) Forecast, by Application 2019 & 2032
- Table 31: Global BCI Industry Revenue Million Forecast, by Country 2019 & 2032
- Table 32: Global BCI Industry Volume K Unit Forecast, by Country 2019 & 2032
- Table 33: China BCI Industry Revenue (Million) Forecast, by Application 2019 & 2032
- Table 34: China BCI Industry Volume (K Unit) Forecast, by Application 2019 & 2032
- Table 35: Japan BCI Industry Revenue (Million) Forecast, by Application 2019 & 2032
- Table 36: Japan BCI Industry Volume (K Unit) Forecast, by Application 2019 & 2032
- Table 37: India BCI Industry Revenue (Million) Forecast, by Application 2019 & 2032
- Table 38: India BCI Industry Volume (K Unit) Forecast, by Application 2019 & 2032
- Table 39: Australia BCI Industry Revenue (Million) Forecast, by Application 2019 & 2032
- Table 40: Australia BCI Industry Volume (K Unit) Forecast, by Application 2019 & 2032
- Table 41: South Korea BCI Industry Revenue (Million) Forecast, by Application 2019 & 2032
- Table 42: South Korea BCI Industry Volume (K Unit) Forecast, by Application 2019 & 2032
- Table 43: Rest of Asia Pacific BCI Industry Revenue (Million) Forecast, by Application 2019 & 2032
- Table 44: Rest of Asia Pacific BCI Industry Volume (K Unit) Forecast, by Application 2019 & 2032
- Table 45: Global BCI Industry Revenue Million Forecast, by Country 2019 & 2032
- Table 46: Global BCI Industry Volume K Unit Forecast, by Country 2019 & 2032
- Table 47: GCC BCI Industry Revenue (Million) Forecast, by Application 2019 & 2032
- Table 48: GCC BCI Industry Volume (K Unit) Forecast, by Application 2019 & 2032
- Table 49: South Africa BCI Industry Revenue (Million) Forecast, by Application 2019 & 2032
- Table 50: South Africa BCI Industry Volume (K Unit) Forecast, by Application 2019 & 2032
- Table 51: Rest of Middle East and Africa BCI Industry Revenue (Million) Forecast, by Application 2019 & 2032
- Table 52: Rest of Middle East and Africa BCI Industry Volume (K Unit) Forecast, by Application 2019 & 2032
- Table 53: Global BCI Industry Revenue Million Forecast, by Country 2019 & 2032
- Table 54: Global BCI Industry Volume K Unit Forecast, by Country 2019 & 2032
- Table 55: Brazil BCI Industry Revenue (Million) Forecast, by Application 2019 & 2032
- Table 56: Brazil BCI Industry Volume (K Unit) Forecast, by Application 2019 & 2032
- Table 57: Argentina BCI Industry Revenue (Million) Forecast, by Application 2019 & 2032
- Table 58: Argentina BCI Industry Volume (K Unit) Forecast, by Application 2019 & 2032
- Table 59: Rest of South America BCI Industry Revenue (Million) Forecast, by Application 2019 & 2032
- Table 60: Rest of South America BCI Industry Volume (K Unit) Forecast, by Application 2019 & 2032
- Table 61: Global BCI Industry Revenue Million Forecast, by Type 2019 & 2032
- Table 62: Global BCI Industry Volume K Unit Forecast, by Type 2019 & 2032
- Table 63: Global BCI Industry Revenue Million Forecast, by Application 2019 & 2032
- Table 64: Global BCI Industry Volume K Unit Forecast, by Application 2019 & 2032
- Table 65: Global BCI Industry Revenue Million Forecast, by Country 2019 & 2032
- Table 66: Global BCI Industry Volume K Unit Forecast, by Country 2019 & 2032
- Table 67: United States BCI Industry Revenue (Million) Forecast, by Application 2019 & 2032
- Table 68: United States BCI Industry Volume (K Unit) Forecast, by Application 2019 & 2032
- Table 69: Canada BCI Industry Revenue (Million) Forecast, by Application 2019 & 2032
- Table 70: Canada BCI Industry Volume (K Unit) Forecast, by Application 2019 & 2032
- Table 71: Mexico BCI Industry Revenue (Million) Forecast, by Application 2019 & 2032
- Table 72: Mexico BCI Industry Volume (K Unit) Forecast, by Application 2019 & 2032
- Table 73: Global BCI Industry Revenue Million Forecast, by Type 2019 & 2032
- Table 74: Global BCI Industry Volume K Unit Forecast, by Type 2019 & 2032
- Table 75: Global BCI Industry Revenue Million Forecast, by Application 2019 & 2032
- Table 76: Global BCI Industry Volume K Unit Forecast, by Application 2019 & 2032
- Table 77: Global BCI Industry Revenue Million Forecast, by Country 2019 & 2032
- Table 78: Global BCI Industry Volume K Unit Forecast, by Country 2019 & 2032
- Table 79: Germany BCI Industry Revenue (Million) Forecast, by Application 2019 & 2032
- Table 80: Germany BCI Industry Volume (K Unit) Forecast, by Application 2019 & 2032
- Table 81: United Kingdom BCI Industry Revenue (Million) Forecast, by Application 2019 & 2032
- Table 82: United Kingdom BCI Industry Volume (K Unit) Forecast, by Application 2019 & 2032
- Table 83: France BCI Industry Revenue (Million) Forecast, by Application 2019 & 2032
- Table 84: France BCI Industry Volume (K Unit) Forecast, by Application 2019 & 2032
- Table 85: Italy BCI Industry Revenue (Million) Forecast, by Application 2019 & 2032
- Table 86: Italy BCI Industry Volume (K Unit) Forecast, by Application 2019 & 2032
- Table 87: Spain BCI Industry Revenue (Million) Forecast, by Application 2019 & 2032
- Table 88: Spain BCI Industry Volume (K Unit) Forecast, by Application 2019 & 2032
- Table 89: Rest of Europe BCI Industry Revenue (Million) Forecast, by Application 2019 & 2032
- Table 90: Rest of Europe BCI Industry Volume (K Unit) Forecast, by Application 2019 & 2032
- Table 91: Global BCI Industry Revenue Million Forecast, by Type 2019 & 2032
- Table 92: Global BCI Industry Volume K Unit Forecast, by Type 2019 & 2032
- Table 93: Global BCI Industry Revenue Million Forecast, by Application 2019 & 2032
- Table 94: Global BCI Industry Volume K Unit Forecast, by Application 2019 & 2032
- Table 95: Global BCI Industry Revenue Million Forecast, by Country 2019 & 2032
- Table 96: Global BCI Industry Volume K Unit Forecast, by Country 2019 & 2032
- Table 97: China BCI Industry Revenue (Million) Forecast, by Application 2019 & 2032
- Table 98: China BCI Industry Volume (K Unit) Forecast, by Application 2019 & 2032
- Table 99: Japan BCI Industry Revenue (Million) Forecast, by Application 2019 & 2032
- Table 100: Japan BCI Industry Volume (K Unit) Forecast, by Application 2019 & 2032
- Table 101: India BCI Industry Revenue (Million) Forecast, by Application 2019 & 2032
- Table 102: India BCI Industry Volume (K Unit) Forecast, by Application 2019 & 2032
- Table 103: Australia BCI Industry Revenue (Million) Forecast, by Application 2019 & 2032
- Table 104: Australia BCI Industry Volume (K Unit) Forecast, by Application 2019 & 2032
- Table 105: South Korea BCI Industry Revenue (Million) Forecast, by Application 2019 & 2032
- Table 106: South Korea BCI Industry Volume (K Unit) Forecast, by Application 2019 & 2032
- Table 107: Rest of Asia Pacific BCI Industry Revenue (Million) Forecast, by Application 2019 & 2032
- Table 108: Rest of Asia Pacific BCI Industry Volume (K Unit) Forecast, by Application 2019 & 2032
- Table 109: Global BCI Industry Revenue Million Forecast, by Type 2019 & 2032
- Table 110: Global BCI Industry Volume K Unit Forecast, by Type 2019 & 2032
- Table 111: Global BCI Industry Revenue Million Forecast, by Application 2019 & 2032
- Table 112: Global BCI Industry Volume K Unit Forecast, by Application 2019 & 2032
- Table 113: Global BCI Industry Revenue Million Forecast, by Country 2019 & 2032
- Table 114: Global BCI Industry Volume K Unit Forecast, by Country 2019 & 2032
- Table 115: GCC BCI Industry Revenue (Million) Forecast, by Application 2019 & 2032
- Table 116: GCC BCI Industry Volume (K Unit) Forecast, by Application 2019 & 2032
- Table 117: South Africa BCI Industry Revenue (Million) Forecast, by Application 2019 & 2032
- Table 118: South Africa BCI Industry Volume (K Unit) Forecast, by Application 2019 & 2032
- Table 119: Rest of Middle East and Africa BCI Industry Revenue (Million) Forecast, by Application 2019 & 2032
- Table 120: Rest of Middle East and Africa BCI Industry Volume (K Unit) Forecast, by Application 2019 & 2032
- Table 121: Global BCI Industry Revenue Million Forecast, by Type 2019 & 2032
- Table 122: Global BCI Industry Volume K Unit Forecast, by Type 2019 & 2032
- Table 123: Global BCI Industry Revenue Million Forecast, by Application 2019 & 2032
- Table 124: Global BCI Industry Volume K Unit Forecast, by Application 2019 & 2032
- Table 125: Global BCI Industry Revenue Million Forecast, by Country 2019 & 2032
- Table 126: Global BCI Industry Volume K Unit Forecast, by Country 2019 & 2032
- Table 127: Brazil BCI Industry Revenue (Million) Forecast, by Application 2019 & 2032
- Table 128: Brazil BCI Industry Volume (K Unit) Forecast, by Application 2019 & 2032
- Table 129: Argentina BCI Industry Revenue (Million) Forecast, by Application 2019 & 2032
- Table 130: Argentina BCI Industry Volume (K Unit) Forecast, by Application 2019 & 2032
- Table 131: Rest of South America BCI Industry Revenue (Million) Forecast, by Application 2019 & 2032
- Table 132: Rest of South America BCI Industry Volume (K Unit) Forecast, by Application 2019 & 2032
Frequently Asked Questions
1. What is the projected Compound Annual Growth Rate (CAGR) of the BCI Industry?
The projected CAGR is approximately 10.29%.
2. Which companies are prominent players in the BCI Industry?
Key companies in the market include Emotive Incorporation, ANT Neuro, Integra LifeSciences Corporation, NextMind, MindMaze, NIRx Medical Technologies, Natus Medical Inc, Compumedics Ltd, Medtronic PLC, Advanced Brain Monitoring Inc, NeuroSky, Brain Products GmbH, Cadwell Industries Inc, g tec medical engineering GmbH, Nihon Kohden Corporation.
3. What are the main segments of the BCI Industry?
The market segments include Type, Application.
4. Can you provide details about the market size?
The market size is estimated to be USD 2.00 Million as of 2022.
5. What are some drivers contributing to market growth?
Increasing Prevalence of Neurodegenerative Disorders; Rising R&D Activities by Government to Improve the Brain-computer Interface Technology; Various Technological Advancements such as Miniaturization of Devices.
6. What are the notable trends driving market growth?
The Non-invasive Brain-computer Interface Segment is Expected to Dominate the Market During the Forecast Period.
7. Are there any restraints impacting market growth?
High Cost of Brain-computer Interface Devices; Lack of Expertise in Implementing the Systems.
8. Can you provide examples of recent developments in the market?
N/A
9. What pricing options are available for accessing the report?
Pricing options include single-user, multi-user, and enterprise licenses priced at USD 4750, USD 5250, and USD 8750 respectively.
10. Is the market size provided in terms of value or volume?
The market size is provided in terms of value, measured in Million and volume, measured in K Unit.
11. Are there any specific market keywords associated with the report?
Yes, the market keyword associated with the report is "BCI Industry," which aids in identifying and referencing the specific market segment covered.
12. How do I determine which pricing option suits my needs best?
The pricing options vary based on user requirements and access needs. Individual users may opt for single-user licenses, while businesses requiring broader access may choose multi-user or enterprise licenses for cost-effective access to the report.
13. Are there any additional resources or data provided in the BCI Industry report?
While the report offers comprehensive insights, it's advisable to review the specific contents or supplementary materials provided to ascertain if additional resources or data are available.
14. How can I stay updated on further developments or reports in the BCI Industry?
To stay informed about further developments, trends, and reports in the BCI Industry, consider subscribing to industry newsletters, following relevant companies and organizations, or regularly checking reputable industry news sources and publications.
Methodology
Step 1 - Identification of Relevant Samples Size from Population Database


Step 2 - Approaches for Defining Global Market Size (Value, Volume* & Price*)

Note*: In applicable scenarios
Step 3 - Data Sources
Primary Research
- Web Analytics
- Survey Reports
- Research Institute
- Latest Research Reports
- Opinion Leaders
Secondary Research
- Annual Reports
- White Paper
- Latest Press Release
- Industry Association
- Paid Database
- Investor Presentations

Step 4 - Data Triangulation
Involves using different sources of information in order to increase the validity of a study
These sources are likely to be stakeholders in a program - participants, other researchers, program staff, other community members, and so on.
Then we put all data in single framework & apply various statistical tools to find out the dynamic on the market.
During the analysis stage, feedback from the stakeholder groups would be compared to determine areas of agreement as well as areas of divergence


