
Key Insights
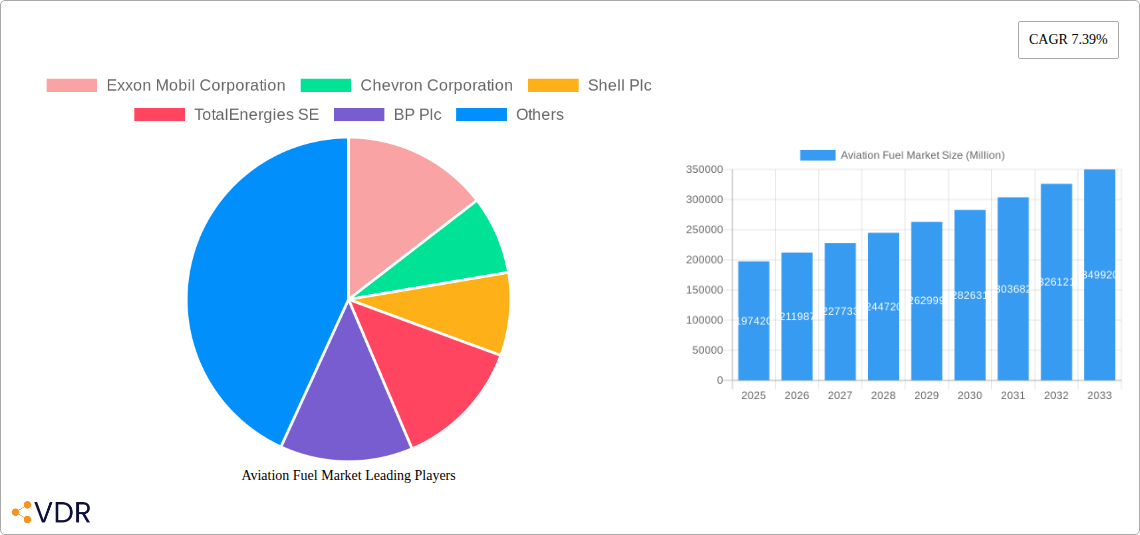
The global aviation fuel market, valued at $197.42 billion in 2025, is projected to experience robust growth, driven by a Compound Annual Growth Rate (CAGR) of 7.39% from 2025 to 2033. This expansion is fueled by several key factors. The resurgence in air travel post-pandemic, coupled with increasing passenger numbers and the expansion of air freight, significantly boosts demand for aviation fuel. Furthermore, the continuous development of more fuel-efficient aircraft and engines contributes to a moderate growth trajectory, although this effect is partially offset by ongoing concerns regarding carbon emissions. The increasing adoption of sustainable aviation fuels (SAFs), driven by environmental regulations and corporate sustainability initiatives, presents a significant growth opportunity, albeit currently a small segment of the overall market. Competition among major players, including ExxonMobil, Chevron, Shell, and TotalEnergies, intensifies as they invest in refining capacity and SAF technologies to cater to the growing demand. Geographical variations in market growth are expected, with regions like Asia-Pacific exhibiting potentially higher growth rates due to rapid economic expansion and rising air travel in developing economies. However, economic downturns or geopolitical instability could pose significant restraints to market expansion.
The market is segmented by fuel type (conventional jet fuel, SAF), aircraft type (commercial, military, general aviation), and geographic region. While precise segment breakdowns are unavailable, it's reasonable to anticipate that conventional jet fuel will remain the dominant segment in the near term. However, the SAF segment is expected to witness exponential growth over the forecast period. The presence of numerous established players and several regional players ensures a competitive landscape. Strategic alliances, mergers, acquisitions, and investments in research and development to enhance fuel efficiency and explore alternative fuels will shape the market's competitive dynamics in the coming years. Long-term growth projections rely on continued economic stability, sustained air travel demand, and effective implementation of sustainable aviation fuel initiatives.
Aviation Fuel Market: A Comprehensive Report (2019-2033)
This comprehensive report provides an in-depth analysis of the Aviation Fuel Market, encompassing market dynamics, growth trends, regional segmentation, product landscape, key players, and future outlook. The study period covers 2019-2033, with 2025 as the base and estimated year, and a forecast period of 2025-2033. This report is crucial for industry professionals, investors, and stakeholders seeking a thorough understanding of this dynamic market. The parent market is the broader energy sector, while the child market focuses specifically on aviation fuel types and their applications. The market size is valued in Million Units.
Aviation Fuel Market Dynamics & Structure
The aviation fuel market is characterized by a moderately concentrated structure, with a few major players holding significant market share. ExxonMobil, Chevron, Shell, and BP, among others, dominate the traditional jet fuel segment. However, the emergence of sustainable aviation fuel (SAF) is fostering increased competition and market fragmentation. Technological innovation, driven by the need to reduce carbon emissions, is a key market driver. Stringent regulatory frameworks, including emission standards and fuel quality regulations, significantly influence market operations. The market faces competition from alternative energy sources but also benefits from the high demand for air travel. Mergers and acquisitions (M&As) are observed, although at a moderate pace, reflecting consolidation efforts among existing players and strategic expansion into the SAF sector.
- Market Concentration: Top 5 players hold approximately xx% market share (2024).
- Technological Innovation: Focus on SAF production and blending technologies.
- Regulatory Framework: Stringent emission standards and fuel quality requirements.
- Competitive Substitutes: Limited direct substitutes; competition from alternative transportation modes.
- M&A Activity: xx major M&A deals observed in the last 5 years, predominantly focusing on SAF technologies and production capabilities. The total value of these deals is estimated at xx Million.
- Innovation Barriers: High R&D costs, lengthy certification processes for SAF, and scaling up production capacities.
Aviation Fuel Market Growth Trends & Insights
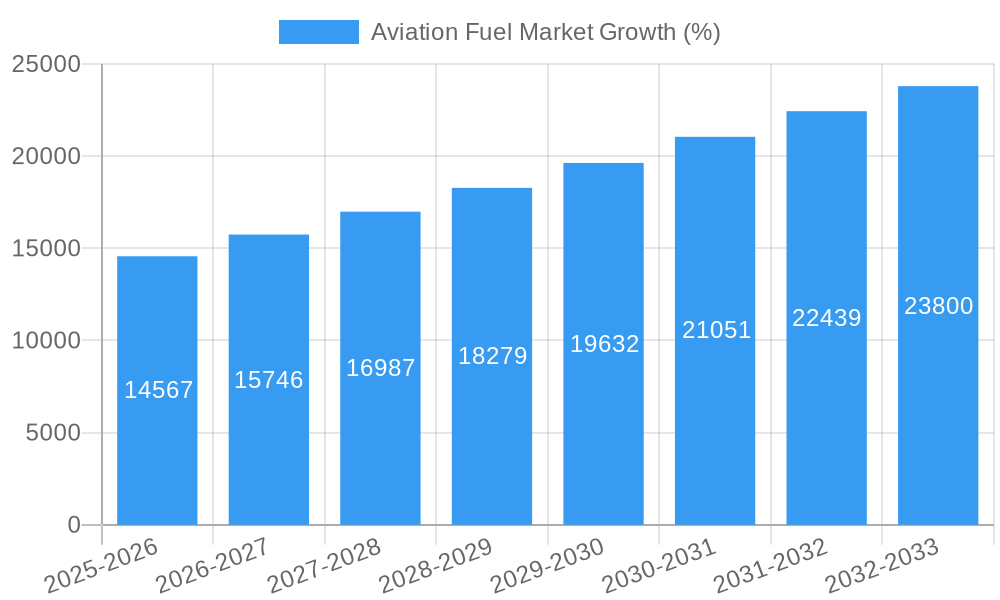
The aviation fuel market experienced robust growth during the historical period (2019-2024), primarily driven by increasing air passenger traffic. However, the COVID-19 pandemic caused a temporary setback. Post-pandemic recovery has been strong, with a projected Compound Annual Growth Rate (CAGR) of xx% during the forecast period (2025-2033). The market size is estimated at xx Million units in 2025 and is projected to reach xx Million units by 2033. Technological disruptions, particularly the rise of SAF, are reshaping the market landscape. Consumer preferences are also shifting towards more sustainable travel options, putting pressure on the industry to reduce its carbon footprint. Market penetration of SAF is projected to increase from xx% in 2025 to xx% by 2033.
Dominant Regions, Countries, or Segments in Aviation Fuel Market
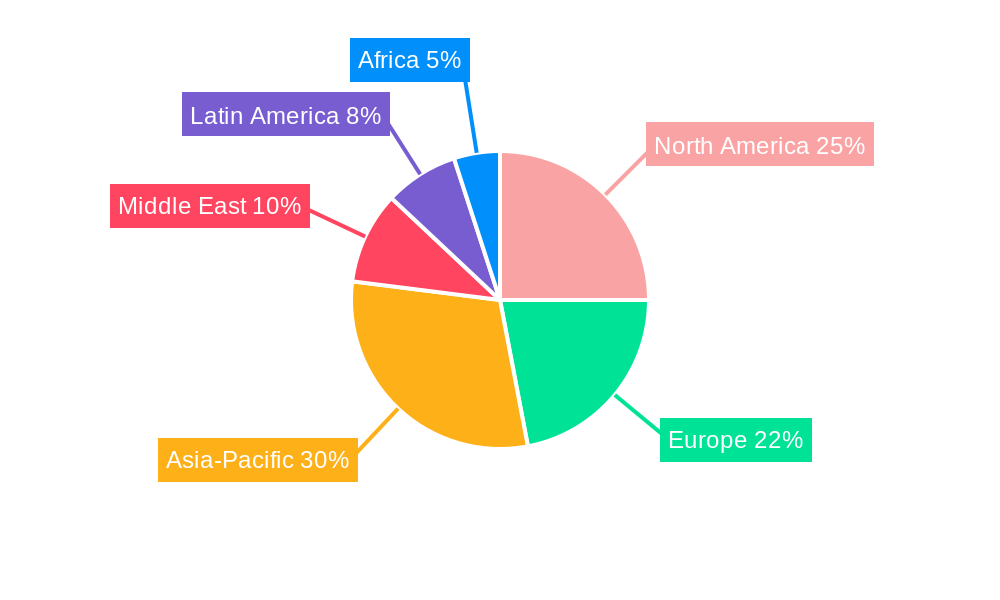
North America and Europe currently dominate the aviation fuel market due to a high density of air travel and established infrastructure. However, Asia-Pacific is expected to exhibit the highest growth rate during the forecast period driven by rapid economic expansion and a surge in air travel demand, particularly in countries like India and China.
- Key Drivers in Asia-Pacific: Rapid economic growth, rising disposable incomes, and expanding air travel infrastructure.
- Dominance Factors: Existing market share, established supply chains, and supportive government policies.
- Growth Potential: High growth potential in emerging markets, driven by increasing air travel demand.
Aviation Fuel Market Product Landscape
The aviation fuel market comprises traditional jet fuel (kerosene-based) and increasingly, sustainable aviation fuel (SAF). SAF, produced from various feedstocks like used cooking oil and plant-based materials, is gaining traction due to its lower carbon emissions. Technological advancements in SAF production are focusing on cost reduction and efficiency improvements. Key performance metrics include energy density, emission profiles, and lifecycle assessment data. Unique selling propositions for SAF include its environmental benefits and the potential for carbon offsetting.
Key Drivers, Barriers & Challenges in Aviation Fuel Market
Key Drivers:
- Growing air passenger traffic globally.
- Increasing demand for air freight.
- Technological advancements in SAF production.
- Government regulations to reduce carbon emissions.
Challenges & Restraints:
- High production costs of SAF.
- Limited availability of sustainable feedstocks.
- Complex regulatory frameworks and certification processes for SAF.
- Price volatility of crude oil. The price volatility impacts the cost of traditional jet fuel, influencing market dynamics and profitability for fuel providers.
Emerging Opportunities in Aviation Fuel Market
- Expansion of SAF production capacity.
- Development of advanced biofuels and synthetic fuels.
- Growth in the use of carbon offsetting mechanisms.
- Exploration of hydrogen-based aviation fuels.
Growth Accelerators in the Aviation Fuel Market Industry
Technological breakthroughs in SAF production, particularly in improving efficiency and reducing costs, are a key growth accelerator. Strategic partnerships between fuel producers, airlines, and technology companies are crucial for scaling up SAF adoption. Government policies supporting the development and deployment of SAF are also playing a significant role in accelerating market growth. Expansion into new markets, especially in emerging economies with rapidly growing air travel demand, presents further opportunities.
Key Players Shaping the Aviation Fuel Market Market
- Exxon Mobil Corporation
- Chevron Corporation
- Shell Plc
- TotalEnergies SE
- BP Plc
- Gazprom Neft' PAO
- Neste Oyj
- Swedish Biofuels AB
- Red Rock Biofuels LLC
- Abu Dhabi National Oil Company
- Bharat Petroleum Corp Ltd
- Indian Oil Corporation Ltd
- Emirates National Oil Company
- Valero Energy Corporation
- Allied Aviation Services Inc
- List Not Exhaustive
Notable Milestones in Aviation Fuel Market Sector
- April 2023: Anticipated international certification of Indian-produced bio-jet fuel (SAF) using domestically developed technology. This opens a new market segment for SAF in India and potentially globally.
- February 2023: Boeing secures agreements to procure 5.6 million gallons of blended SAF from Neste, significantly increasing its SAF procurement compared to the previous year. This highlights growing industry adoption of SAF.
In-Depth Aviation Fuel Market Market Outlook
The aviation fuel market is poised for continued growth, driven by the increasing demand for air travel and the burgeoning SAF market. Strategic opportunities exist for companies to invest in SAF production, develop innovative fuel technologies, and expand into new markets. The focus on sustainability and reducing carbon emissions will continue to shape the industry's future, creating both challenges and opportunities for key players. The long-term outlook remains positive, with significant growth potential driven by technological advancements and supportive government policies.
Aviation Fuel Market Segmentation
-
1. Fuel Type
-
1.1. Air Turbine Fuel
- 1.1.1. Jet A-1
- 1.1.2. Jet B
- 1.2. Aviation Biofuel
- 1.3. AVGAS
-
1.1. Air Turbine Fuel
-
2. End-User
- 2.1. Commercial
- 2.2. Defence
- 2.3. General Aviation
Aviation Fuel Market Segmentation By Geography
-
1. North America
- 1.1. United States
- 1.2. Canada
- 1.3. Rest of North America
-
2. Europe
- 2.1. Germany
- 2.2. United Kingdom
- 2.3. France
- 2.4. Russia
- 2.5. Rest of Europe
-
3. Asia Pacific
- 3.1. China
- 3.2. India
- 3.3. Japan
- 3.4. South Korea
- 3.5. Rest of Asia Pacific
-
4. South America
- 4.1. Brazil
- 4.2. Argentina
- 4.3. Chile
- 4.4. Rest of South America
-
5. Middle East and Africa
- 5.1. Saudi Arabia
- 5.2. United Arab Emirates
- 5.3. Egypt
- 5.4. South Africa
- 5.5. Rest of Middle East and Africa
Aviation Fuel Market REPORT HIGHLIGHTS
| Aspects | Details |
|---|---|
| Study Period | 2019-2033 |
| Base Year | 2024 |
| Estimated Year | 2025 |
| Forecast Period | 2025-2033 |
| Historical Period | 2019-2024 |
| Growth Rate | CAGR of 7.39% from 2019-2033 |
| Segmentation |
|
Table of Contents
- 1. Introduction
- 1.1. Research Scope
- 1.2. Market Segmentation
- 1.3. Research Methodology
- 1.4. Definitions and Assumptions
- 2. Executive Summary
- 2.1. Introduction
- 3. Market Dynamics
- 3.1. Introduction
- 3.2. Market Drivers
- 3.2.1. 4.; Increasing Air Travel Demand4.; Expanding Airline Fleet
- 3.3. Market Restrains
- 3.3.1. 4.; Increasing Air Travel Demand4.; Expanding Airline Fleet
- 3.4. Market Trends
- 3.4.1. Aviation Turbine Fuels Expected to Dominate the Market
- 4. Market Factor Analysis
- 4.1. Porters Five Forces
- 4.2. Supply/Value Chain
- 4.3. PESTEL analysis
- 4.4. Market Entropy
- 4.5. Patent/Trademark Analysis
- 5. Global Aviation Fuel Market Analysis, Insights and Forecast, 2019-2031
- 5.1. Market Analysis, Insights and Forecast - by Fuel Type
- 5.1.1. Air Turbine Fuel
- 5.1.1.1. Jet A-1
- 5.1.1.2. Jet B
- 5.1.2. Aviation Biofuel
- 5.1.3. AVGAS
- 5.1.1. Air Turbine Fuel
- 5.2. Market Analysis, Insights and Forecast - by End-User
- 5.2.1. Commercial
- 5.2.2. Defence
- 5.2.3. General Aviation
- 5.3. Market Analysis, Insights and Forecast - by Region
- 5.3.1. North America
- 5.3.2. Europe
- 5.3.3. Asia Pacific
- 5.3.4. South America
- 5.3.5. Middle East and Africa
- 5.1. Market Analysis, Insights and Forecast - by Fuel Type
- 6. North America Aviation Fuel Market Analysis, Insights and Forecast, 2019-2031
- 6.1. Market Analysis, Insights and Forecast - by Fuel Type
- 6.1.1. Air Turbine Fuel
- 6.1.1.1. Jet A-1
- 6.1.1.2. Jet B
- 6.1.2. Aviation Biofuel
- 6.1.3. AVGAS
- 6.1.1. Air Turbine Fuel
- 6.2. Market Analysis, Insights and Forecast - by End-User
- 6.2.1. Commercial
- 6.2.2. Defence
- 6.2.3. General Aviation
- 6.1. Market Analysis, Insights and Forecast - by Fuel Type
- 7. Europe Aviation Fuel Market Analysis, Insights and Forecast, 2019-2031
- 7.1. Market Analysis, Insights and Forecast - by Fuel Type
- 7.1.1. Air Turbine Fuel
- 7.1.1.1. Jet A-1
- 7.1.1.2. Jet B
- 7.1.2. Aviation Biofuel
- 7.1.3. AVGAS
- 7.1.1. Air Turbine Fuel
- 7.2. Market Analysis, Insights and Forecast - by End-User
- 7.2.1. Commercial
- 7.2.2. Defence
- 7.2.3. General Aviation
- 7.1. Market Analysis, Insights and Forecast - by Fuel Type
- 8. Asia Pacific Aviation Fuel Market Analysis, Insights and Forecast, 2019-2031
- 8.1. Market Analysis, Insights and Forecast - by Fuel Type
- 8.1.1. Air Turbine Fuel
- 8.1.1.1. Jet A-1
- 8.1.1.2. Jet B
- 8.1.2. Aviation Biofuel
- 8.1.3. AVGAS
- 8.1.1. Air Turbine Fuel
- 8.2. Market Analysis, Insights and Forecast - by End-User
- 8.2.1. Commercial
- 8.2.2. Defence
- 8.2.3. General Aviation
- 8.1. Market Analysis, Insights and Forecast - by Fuel Type
- 9. South America Aviation Fuel Market Analysis, Insights and Forecast, 2019-2031
- 9.1. Market Analysis, Insights and Forecast - by Fuel Type
- 9.1.1. Air Turbine Fuel
- 9.1.1.1. Jet A-1
- 9.1.1.2. Jet B
- 9.1.2. Aviation Biofuel
- 9.1.3. AVGAS
- 9.1.1. Air Turbine Fuel
- 9.2. Market Analysis, Insights and Forecast - by End-User
- 9.2.1. Commercial
- 9.2.2. Defence
- 9.2.3. General Aviation
- 9.1. Market Analysis, Insights and Forecast - by Fuel Type
- 10. Middle East and Africa Aviation Fuel Market Analysis, Insights and Forecast, 2019-2031
- 10.1. Market Analysis, Insights and Forecast - by Fuel Type
- 10.1.1. Air Turbine Fuel
- 10.1.1.1. Jet A-1
- 10.1.1.2. Jet B
- 10.1.2. Aviation Biofuel
- 10.1.3. AVGAS
- 10.1.1. Air Turbine Fuel
- 10.2. Market Analysis, Insights and Forecast - by End-User
- 10.2.1. Commercial
- 10.2.2. Defence
- 10.2.3. General Aviation
- 10.1. Market Analysis, Insights and Forecast - by Fuel Type
- 11. Competitive Analysis
- 11.1. Global Market Share Analysis 2024
- 11.2. Company Profiles
- 11.2.1 Exxon Mobil Corporation
- 11.2.1.1. Overview
- 11.2.1.2. Products
- 11.2.1.3. SWOT Analysis
- 11.2.1.4. Recent Developments
- 11.2.1.5. Financials (Based on Availability)
- 11.2.2 Chevron Corporation
- 11.2.2.1. Overview
- 11.2.2.2. Products
- 11.2.2.3. SWOT Analysis
- 11.2.2.4. Recent Developments
- 11.2.2.5. Financials (Based on Availability)
- 11.2.3 Shell Plc
- 11.2.3.1. Overview
- 11.2.3.2. Products
- 11.2.3.3. SWOT Analysis
- 11.2.3.4. Recent Developments
- 11.2.3.5. Financials (Based on Availability)
- 11.2.4 TotalEnergies SE
- 11.2.4.1. Overview
- 11.2.4.2. Products
- 11.2.4.3. SWOT Analysis
- 11.2.4.4. Recent Developments
- 11.2.4.5. Financials (Based on Availability)
- 11.2.5 BP Plc
- 11.2.5.1. Overview
- 11.2.5.2. Products
- 11.2.5.3. SWOT Analysis
- 11.2.5.4. Recent Developments
- 11.2.5.5. Financials (Based on Availability)
- 11.2.6 Gazprom Neft' PAO
- 11.2.6.1. Overview
- 11.2.6.2. Products
- 11.2.6.3. SWOT Analysis
- 11.2.6.4. Recent Developments
- 11.2.6.5. Financials (Based on Availability)
- 11.2.7 Neste Oyj
- 11.2.7.1. Overview
- 11.2.7.2. Products
- 11.2.7.3. SWOT Analysis
- 11.2.7.4. Recent Developments
- 11.2.7.5. Financials (Based on Availability)
- 11.2.8 Swedish Biofuels AB
- 11.2.8.1. Overview
- 11.2.8.2. Products
- 11.2.8.3. SWOT Analysis
- 11.2.8.4. Recent Developments
- 11.2.8.5. Financials (Based on Availability)
- 11.2.9 Red Rock Biofuels LLC
- 11.2.9.1. Overview
- 11.2.9.2. Products
- 11.2.9.3. SWOT Analysis
- 11.2.9.4. Recent Developments
- 11.2.9.5. Financials (Based on Availability)
- 11.2.10 Abu Dhabi National Oil Company
- 11.2.10.1. Overview
- 11.2.10.2. Products
- 11.2.10.3. SWOT Analysis
- 11.2.10.4. Recent Developments
- 11.2.10.5. Financials (Based on Availability)
- 11.2.11 Bharat Petroleum Corp Ltd
- 11.2.11.1. Overview
- 11.2.11.2. Products
- 11.2.11.3. SWOT Analysis
- 11.2.11.4. Recent Developments
- 11.2.11.5. Financials (Based on Availability)
- 11.2.12 Indian Oil Corporation Ltd
- 11.2.12.1. Overview
- 11.2.12.2. Products
- 11.2.12.3. SWOT Analysis
- 11.2.12.4. Recent Developments
- 11.2.12.5. Financials (Based on Availability)
- 11.2.13 Emirates National Oil Company
- 11.2.13.1. Overview
- 11.2.13.2. Products
- 11.2.13.3. SWOT Analysis
- 11.2.13.4. Recent Developments
- 11.2.13.5. Financials (Based on Availability)
- 11.2.14 Valero Energy Corporation
- 11.2.14.1. Overview
- 11.2.14.2. Products
- 11.2.14.3. SWOT Analysis
- 11.2.14.4. Recent Developments
- 11.2.14.5. Financials (Based on Availability)
- 11.2.15 Allied Aviation Services Inc *List Not Exhaustive
- 11.2.15.1. Overview
- 11.2.15.2. Products
- 11.2.15.3. SWOT Analysis
- 11.2.15.4. Recent Developments
- 11.2.15.5. Financials (Based on Availability)
- 11.2.1 Exxon Mobil Corporation
List of Figures
- Figure 1: Global Aviation Fuel Market Revenue Breakdown (Million, %) by Region 2024 & 2032
- Figure 2: Global Aviation Fuel Market Volume Breakdown (Billion, %) by Region 2024 & 2032
- Figure 3: North America Aviation Fuel Market Revenue (Million), by Fuel Type 2024 & 2032
- Figure 4: North America Aviation Fuel Market Volume (Billion), by Fuel Type 2024 & 2032
- Figure 5: North America Aviation Fuel Market Revenue Share (%), by Fuel Type 2024 & 2032
- Figure 6: North America Aviation Fuel Market Volume Share (%), by Fuel Type 2024 & 2032
- Figure 7: North America Aviation Fuel Market Revenue (Million), by End-User 2024 & 2032
- Figure 8: North America Aviation Fuel Market Volume (Billion), by End-User 2024 & 2032
- Figure 9: North America Aviation Fuel Market Revenue Share (%), by End-User 2024 & 2032
- Figure 10: North America Aviation Fuel Market Volume Share (%), by End-User 2024 & 2032
- Figure 11: North America Aviation Fuel Market Revenue (Million), by Country 2024 & 2032
- Figure 12: North America Aviation Fuel Market Volume (Billion), by Country 2024 & 2032
- Figure 13: North America Aviation Fuel Market Revenue Share (%), by Country 2024 & 2032
- Figure 14: North America Aviation Fuel Market Volume Share (%), by Country 2024 & 2032
- Figure 15: Europe Aviation Fuel Market Revenue (Million), by Fuel Type 2024 & 2032
- Figure 16: Europe Aviation Fuel Market Volume (Billion), by Fuel Type 2024 & 2032
- Figure 17: Europe Aviation Fuel Market Revenue Share (%), by Fuel Type 2024 & 2032
- Figure 18: Europe Aviation Fuel Market Volume Share (%), by Fuel Type 2024 & 2032
- Figure 19: Europe Aviation Fuel Market Revenue (Million), by End-User 2024 & 2032
- Figure 20: Europe Aviation Fuel Market Volume (Billion), by End-User 2024 & 2032
- Figure 21: Europe Aviation Fuel Market Revenue Share (%), by End-User 2024 & 2032
- Figure 22: Europe Aviation Fuel Market Volume Share (%), by End-User 2024 & 2032
- Figure 23: Europe Aviation Fuel Market Revenue (Million), by Country 2024 & 2032
- Figure 24: Europe Aviation Fuel Market Volume (Billion), by Country 2024 & 2032
- Figure 25: Europe Aviation Fuel Market Revenue Share (%), by Country 2024 & 2032
- Figure 26: Europe Aviation Fuel Market Volume Share (%), by Country 2024 & 2032
- Figure 27: Asia Pacific Aviation Fuel Market Revenue (Million), by Fuel Type 2024 & 2032
- Figure 28: Asia Pacific Aviation Fuel Market Volume (Billion), by Fuel Type 2024 & 2032
- Figure 29: Asia Pacific Aviation Fuel Market Revenue Share (%), by Fuel Type 2024 & 2032
- Figure 30: Asia Pacific Aviation Fuel Market Volume Share (%), by Fuel Type 2024 & 2032
- Figure 31: Asia Pacific Aviation Fuel Market Revenue (Million), by End-User 2024 & 2032
- Figure 32: Asia Pacific Aviation Fuel Market Volume (Billion), by End-User 2024 & 2032
- Figure 33: Asia Pacific Aviation Fuel Market Revenue Share (%), by End-User 2024 & 2032
- Figure 34: Asia Pacific Aviation Fuel Market Volume Share (%), by End-User 2024 & 2032
- Figure 35: Asia Pacific Aviation Fuel Market Revenue (Million), by Country 2024 & 2032
- Figure 36: Asia Pacific Aviation Fuel Market Volume (Billion), by Country 2024 & 2032
- Figure 37: Asia Pacific Aviation Fuel Market Revenue Share (%), by Country 2024 & 2032
- Figure 38: Asia Pacific Aviation Fuel Market Volume Share (%), by Country 2024 & 2032
- Figure 39: South America Aviation Fuel Market Revenue (Million), by Fuel Type 2024 & 2032
- Figure 40: South America Aviation Fuel Market Volume (Billion), by Fuel Type 2024 & 2032
- Figure 41: South America Aviation Fuel Market Revenue Share (%), by Fuel Type 2024 & 2032
- Figure 42: South America Aviation Fuel Market Volume Share (%), by Fuel Type 2024 & 2032
- Figure 43: South America Aviation Fuel Market Revenue (Million), by End-User 2024 & 2032
- Figure 44: South America Aviation Fuel Market Volume (Billion), by End-User 2024 & 2032
- Figure 45: South America Aviation Fuel Market Revenue Share (%), by End-User 2024 & 2032
- Figure 46: South America Aviation Fuel Market Volume Share (%), by End-User 2024 & 2032
- Figure 47: South America Aviation Fuel Market Revenue (Million), by Country 2024 & 2032
- Figure 48: South America Aviation Fuel Market Volume (Billion), by Country 2024 & 2032
- Figure 49: South America Aviation Fuel Market Revenue Share (%), by Country 2024 & 2032
- Figure 50: South America Aviation Fuel Market Volume Share (%), by Country 2024 & 2032
- Figure 51: Middle East and Africa Aviation Fuel Market Revenue (Million), by Fuel Type 2024 & 2032
- Figure 52: Middle East and Africa Aviation Fuel Market Volume (Billion), by Fuel Type 2024 & 2032
- Figure 53: Middle East and Africa Aviation Fuel Market Revenue Share (%), by Fuel Type 2024 & 2032
- Figure 54: Middle East and Africa Aviation Fuel Market Volume Share (%), by Fuel Type 2024 & 2032
- Figure 55: Middle East and Africa Aviation Fuel Market Revenue (Million), by End-User 2024 & 2032
- Figure 56: Middle East and Africa Aviation Fuel Market Volume (Billion), by End-User 2024 & 2032
- Figure 57: Middle East and Africa Aviation Fuel Market Revenue Share (%), by End-User 2024 & 2032
- Figure 58: Middle East and Africa Aviation Fuel Market Volume Share (%), by End-User 2024 & 2032
- Figure 59: Middle East and Africa Aviation Fuel Market Revenue (Million), by Country 2024 & 2032
- Figure 60: Middle East and Africa Aviation Fuel Market Volume (Billion), by Country 2024 & 2032
- Figure 61: Middle East and Africa Aviation Fuel Market Revenue Share (%), by Country 2024 & 2032
- Figure 62: Middle East and Africa Aviation Fuel Market Volume Share (%), by Country 2024 & 2032
List of Tables
- Table 1: Global Aviation Fuel Market Revenue Million Forecast, by Region 2019 & 2032
- Table 2: Global Aviation Fuel Market Volume Billion Forecast, by Region 2019 & 2032
- Table 3: Global Aviation Fuel Market Revenue Million Forecast, by Fuel Type 2019 & 2032
- Table 4: Global Aviation Fuel Market Volume Billion Forecast, by Fuel Type 2019 & 2032
- Table 5: Global Aviation Fuel Market Revenue Million Forecast, by End-User 2019 & 2032
- Table 6: Global Aviation Fuel Market Volume Billion Forecast, by End-User 2019 & 2032
- Table 7: Global Aviation Fuel Market Revenue Million Forecast, by Region 2019 & 2032
- Table 8: Global Aviation Fuel Market Volume Billion Forecast, by Region 2019 & 2032
- Table 9: Global Aviation Fuel Market Revenue Million Forecast, by Fuel Type 2019 & 2032
- Table 10: Global Aviation Fuel Market Volume Billion Forecast, by Fuel Type 2019 & 2032
- Table 11: Global Aviation Fuel Market Revenue Million Forecast, by End-User 2019 & 2032
- Table 12: Global Aviation Fuel Market Volume Billion Forecast, by End-User 2019 & 2032
- Table 13: Global Aviation Fuel Market Revenue Million Forecast, by Country 2019 & 2032
- Table 14: Global Aviation Fuel Market Volume Billion Forecast, by Country 2019 & 2032
- Table 15: United States Aviation Fuel Market Revenue (Million) Forecast, by Application 2019 & 2032
- Table 16: United States Aviation Fuel Market Volume (Billion) Forecast, by Application 2019 & 2032
- Table 17: Canada Aviation Fuel Market Revenue (Million) Forecast, by Application 2019 & 2032
- Table 18: Canada Aviation Fuel Market Volume (Billion) Forecast, by Application 2019 & 2032
- Table 19: Rest of North America Aviation Fuel Market Revenue (Million) Forecast, by Application 2019 & 2032
- Table 20: Rest of North America Aviation Fuel Market Volume (Billion) Forecast, by Application 2019 & 2032
- Table 21: Global Aviation Fuel Market Revenue Million Forecast, by Fuel Type 2019 & 2032
- Table 22: Global Aviation Fuel Market Volume Billion Forecast, by Fuel Type 2019 & 2032
- Table 23: Global Aviation Fuel Market Revenue Million Forecast, by End-User 2019 & 2032
- Table 24: Global Aviation Fuel Market Volume Billion Forecast, by End-User 2019 & 2032
- Table 25: Global Aviation Fuel Market Revenue Million Forecast, by Country 2019 & 2032
- Table 26: Global Aviation Fuel Market Volume Billion Forecast, by Country 2019 & 2032
- Table 27: Germany Aviation Fuel Market Revenue (Million) Forecast, by Application 2019 & 2032
- Table 28: Germany Aviation Fuel Market Volume (Billion) Forecast, by Application 2019 & 2032
- Table 29: United Kingdom Aviation Fuel Market Revenue (Million) Forecast, by Application 2019 & 2032
- Table 30: United Kingdom Aviation Fuel Market Volume (Billion) Forecast, by Application 2019 & 2032
- Table 31: France Aviation Fuel Market Revenue (Million) Forecast, by Application 2019 & 2032
- Table 32: France Aviation Fuel Market Volume (Billion) Forecast, by Application 2019 & 2032
- Table 33: Russia Aviation Fuel Market Revenue (Million) Forecast, by Application 2019 & 2032
- Table 34: Russia Aviation Fuel Market Volume (Billion) Forecast, by Application 2019 & 2032
- Table 35: Rest of Europe Aviation Fuel Market Revenue (Million) Forecast, by Application 2019 & 2032
- Table 36: Rest of Europe Aviation Fuel Market Volume (Billion) Forecast, by Application 2019 & 2032
- Table 37: Global Aviation Fuel Market Revenue Million Forecast, by Fuel Type 2019 & 2032
- Table 38: Global Aviation Fuel Market Volume Billion Forecast, by Fuel Type 2019 & 2032
- Table 39: Global Aviation Fuel Market Revenue Million Forecast, by End-User 2019 & 2032
- Table 40: Global Aviation Fuel Market Volume Billion Forecast, by End-User 2019 & 2032
- Table 41: Global Aviation Fuel Market Revenue Million Forecast, by Country 2019 & 2032
- Table 42: Global Aviation Fuel Market Volume Billion Forecast, by Country 2019 & 2032
- Table 43: China Aviation Fuel Market Revenue (Million) Forecast, by Application 2019 & 2032
- Table 44: China Aviation Fuel Market Volume (Billion) Forecast, by Application 2019 & 2032
- Table 45: India Aviation Fuel Market Revenue (Million) Forecast, by Application 2019 & 2032
- Table 46: India Aviation Fuel Market Volume (Billion) Forecast, by Application 2019 & 2032
- Table 47: Japan Aviation Fuel Market Revenue (Million) Forecast, by Application 2019 & 2032
- Table 48: Japan Aviation Fuel Market Volume (Billion) Forecast, by Application 2019 & 2032
- Table 49: South Korea Aviation Fuel Market Revenue (Million) Forecast, by Application 2019 & 2032
- Table 50: South Korea Aviation Fuel Market Volume (Billion) Forecast, by Application 2019 & 2032
- Table 51: Rest of Asia Pacific Aviation Fuel Market Revenue (Million) Forecast, by Application 2019 & 2032
- Table 52: Rest of Asia Pacific Aviation Fuel Market Volume (Billion) Forecast, by Application 2019 & 2032
- Table 53: Global Aviation Fuel Market Revenue Million Forecast, by Fuel Type 2019 & 2032
- Table 54: Global Aviation Fuel Market Volume Billion Forecast, by Fuel Type 2019 & 2032
- Table 55: Global Aviation Fuel Market Revenue Million Forecast, by End-User 2019 & 2032
- Table 56: Global Aviation Fuel Market Volume Billion Forecast, by End-User 2019 & 2032
- Table 57: Global Aviation Fuel Market Revenue Million Forecast, by Country 2019 & 2032
- Table 58: Global Aviation Fuel Market Volume Billion Forecast, by Country 2019 & 2032
- Table 59: Brazil Aviation Fuel Market Revenue (Million) Forecast, by Application 2019 & 2032
- Table 60: Brazil Aviation Fuel Market Volume (Billion) Forecast, by Application 2019 & 2032
- Table 61: Argentina Aviation Fuel Market Revenue (Million) Forecast, by Application 2019 & 2032
- Table 62: Argentina Aviation Fuel Market Volume (Billion) Forecast, by Application 2019 & 2032
- Table 63: Chile Aviation Fuel Market Revenue (Million) Forecast, by Application 2019 & 2032
- Table 64: Chile Aviation Fuel Market Volume (Billion) Forecast, by Application 2019 & 2032
- Table 65: Rest of South America Aviation Fuel Market Revenue (Million) Forecast, by Application 2019 & 2032
- Table 66: Rest of South America Aviation Fuel Market Volume (Billion) Forecast, by Application 2019 & 2032
- Table 67: Global Aviation Fuel Market Revenue Million Forecast, by Fuel Type 2019 & 2032
- Table 68: Global Aviation Fuel Market Volume Billion Forecast, by Fuel Type 2019 & 2032
- Table 69: Global Aviation Fuel Market Revenue Million Forecast, by End-User 2019 & 2032
- Table 70: Global Aviation Fuel Market Volume Billion Forecast, by End-User 2019 & 2032
- Table 71: Global Aviation Fuel Market Revenue Million Forecast, by Country 2019 & 2032
- Table 72: Global Aviation Fuel Market Volume Billion Forecast, by Country 2019 & 2032
- Table 73: Saudi Arabia Aviation Fuel Market Revenue (Million) Forecast, by Application 2019 & 2032
- Table 74: Saudi Arabia Aviation Fuel Market Volume (Billion) Forecast, by Application 2019 & 2032
- Table 75: United Arab Emirates Aviation Fuel Market Revenue (Million) Forecast, by Application 2019 & 2032
- Table 76: United Arab Emirates Aviation Fuel Market Volume (Billion) Forecast, by Application 2019 & 2032
- Table 77: Egypt Aviation Fuel Market Revenue (Million) Forecast, by Application 2019 & 2032
- Table 78: Egypt Aviation Fuel Market Volume (Billion) Forecast, by Application 2019 & 2032
- Table 79: South Africa Aviation Fuel Market Revenue (Million) Forecast, by Application 2019 & 2032
- Table 80: South Africa Aviation Fuel Market Volume (Billion) Forecast, by Application 2019 & 2032
- Table 81: Rest of Middle East and Africa Aviation Fuel Market Revenue (Million) Forecast, by Application 2019 & 2032
- Table 82: Rest of Middle East and Africa Aviation Fuel Market Volume (Billion) Forecast, by Application 2019 & 2032
Frequently Asked Questions
1. What is the projected Compound Annual Growth Rate (CAGR) of the Aviation Fuel Market?
The projected CAGR is approximately 7.39%.
2. Which companies are prominent players in the Aviation Fuel Market?
Key companies in the market include Exxon Mobil Corporation, Chevron Corporation, Shell Plc, TotalEnergies SE, BP Plc, Gazprom Neft' PAO, Neste Oyj, Swedish Biofuels AB, Red Rock Biofuels LLC, Abu Dhabi National Oil Company, Bharat Petroleum Corp Ltd, Indian Oil Corporation Ltd, Emirates National Oil Company, Valero Energy Corporation, Allied Aviation Services Inc *List Not Exhaustive.
3. What are the main segments of the Aviation Fuel Market?
The market segments include Fuel Type, End-User.
4. Can you provide details about the market size?
The market size is estimated to be USD 197.42 Million as of 2022.
5. What are some drivers contributing to market growth?
4.; Increasing Air Travel Demand4.; Expanding Airline Fleet.
6. What are the notable trends driving market growth?
Aviation Turbine Fuels Expected to Dominate the Market.
7. Are there any restraints impacting market growth?
4.; Increasing Air Travel Demand4.; Expanding Airline Fleet.
8. Can you provide examples of recent developments in the market?
April 2023: Using domestically developed technology that utilizes cooking oil and oil-bearing plant seeds, a bio-jet fuel, commonly referred to as sustainable aviation fuel (SAF), is anticipated to obtain international certification this year. This certification would enable the SAF to be utilized in commercial flights within India. To facilitate the production of SAF, the Indian Institute of Petroleum (IIP), a laboratory under the Council of Scientific and Industrial Research (CSIR), has collaborated with prominent entities such as Boeing, Indigo, Spicejet, Air India, Vistara, Air Asia India.
9. What pricing options are available for accessing the report?
Pricing options include single-user, multi-user, and enterprise licenses priced at USD 4750, USD 5250, and USD 8750 respectively.
10. Is the market size provided in terms of value or volume?
The market size is provided in terms of value, measured in Million and volume, measured in Billion.
11. Are there any specific market keywords associated with the report?
Yes, the market keyword associated with the report is "Aviation Fuel Market," which aids in identifying and referencing the specific market segment covered.
12. How do I determine which pricing option suits my needs best?
The pricing options vary based on user requirements and access needs. Individual users may opt for single-user licenses, while businesses requiring broader access may choose multi-user or enterprise licenses for cost-effective access to the report.
13. Are there any additional resources or data provided in the Aviation Fuel Market report?
While the report offers comprehensive insights, it's advisable to review the specific contents or supplementary materials provided to ascertain if additional resources or data are available.
14. How can I stay updated on further developments or reports in the Aviation Fuel Market?
To stay informed about further developments, trends, and reports in the Aviation Fuel Market, consider subscribing to industry newsletters, following relevant companies and organizations, or regularly checking reputable industry news sources and publications.
Methodology
Step 1 - Identification of Relevant Samples Size from Population Database


Step 2 - Approaches for Defining Global Market Size (Value, Volume* & Price*)

Note*: In applicable scenarios
Step 3 - Data Sources
Primary Research
- Web Analytics
- Survey Reports
- Research Institute
- Latest Research Reports
- Opinion Leaders
Secondary Research
- Annual Reports
- White Paper
- Latest Press Release
- Industry Association
- Paid Database
- Investor Presentations

Step 4 - Data Triangulation
Involves using different sources of information in order to increase the validity of a study
These sources are likely to be stakeholders in a program - participants, other researchers, program staff, other community members, and so on.
Then we put all data in single framework & apply various statistical tools to find out the dynamic on the market.
During the analysis stage, feedback from the stakeholder groups would be compared to determine areas of agreement as well as areas of divergence


