

Key Insights
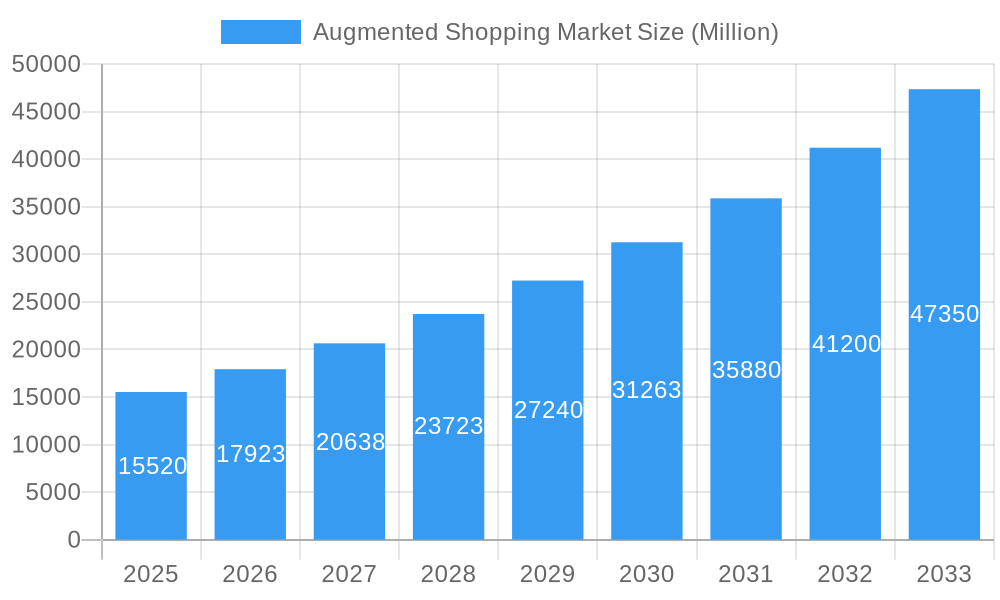
The augmented shopping market, valued at $15.52 billion in 2025, is poised for significant growth, exhibiting a Compound Annual Growth Rate (CAGR) of 15.78% from 2025 to 2033. This expansion is driven by several key factors. The increasing adoption of smartphones and other smart devices equipped with advanced cameras and processing capabilities provides the technological foundation for AR shopping experiences. Consumers are increasingly embracing immersive shopping experiences, drawn to the convenience and enhanced product visualization offered by augmented reality. Retailers are actively integrating AR into their strategies to boost sales conversion rates and improve customer engagement. The ability to virtually try on clothes, visualize furniture in their homes, or examine product details from all angles before purchasing is proving highly attractive. This trend is further fueled by advancements in AR technology, making AR applications more accessible, affordable, and user-friendly. The integration of AR with e-commerce platforms and social media channels is also broadening reach and driving adoption.
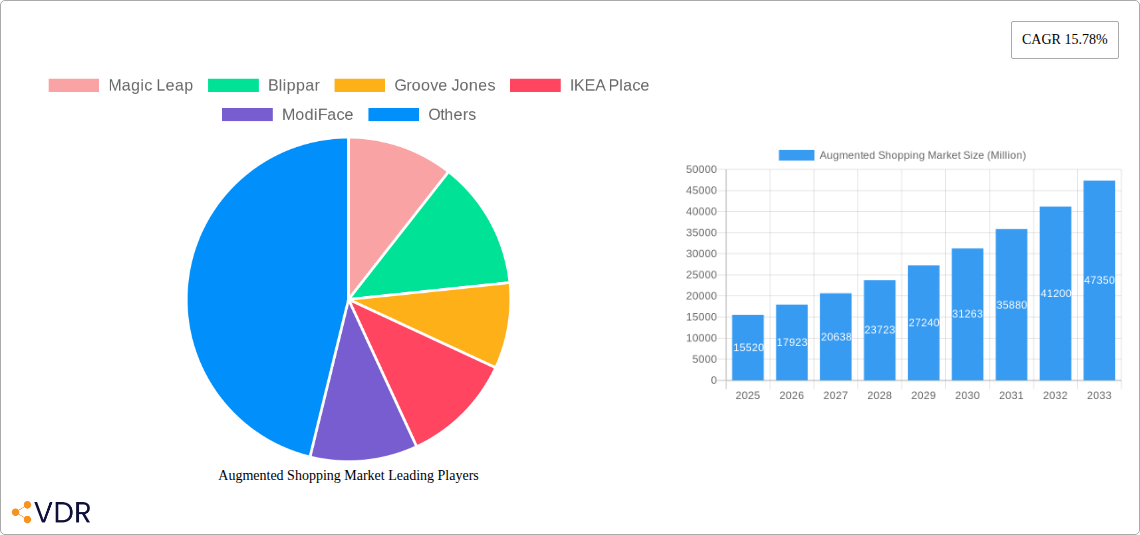
Augmented Shopping Market Market Size (In Billion)
Major players like Magic Leap, Blippar, Groove Jones, IKEA Place, ModiFace, Obsess, Microsoft HoloLens, Zugara Inc, PTC Vuforia, and Apple are actively shaping the market landscape through innovative solutions and strategic partnerships. However, challenges remain. High initial investment costs for AR technology and the need for robust internet connectivity can be barriers to entry for some businesses. Furthermore, ensuring seamless user experiences across diverse devices and platforms is crucial for sustained growth. Addressing concerns around data privacy and security related to the collection and use of user data in AR applications is also a critical element for market expansion and consumer trust. Despite these hurdles, the long-term outlook for the augmented shopping market remains exceptionally positive, fueled by continuous technological innovation and growing consumer demand for immersive and engaging retail experiences.
Augmented Shopping Market Company Market Share
Augmented Shopping Market: A Comprehensive Report (2019-2033)
This comprehensive report provides a detailed analysis of the Augmented Shopping Market, encompassing market dynamics, growth trends, regional dominance, product landscapes, key players, and future outlook. The study period covers 2019-2033, with 2025 as the base and estimated year. This report is invaluable for industry professionals, investors, and anyone seeking a deep understanding of this rapidly evolving sector. The parent market is the broader Retail Technology market, while the child market focuses specifically on augmented reality (AR) applications within retail. The market size is projected to reach xx Million by 2033.
Augmented Shopping Market Dynamics & Structure
The Augmented Shopping market is characterized by moderate concentration, with a few major players holding significant market share, while numerous smaller companies contribute to innovation. Technological advancements, particularly in AR hardware and software, are key drivers. Regulatory frameworks regarding data privacy and consumer protection are increasingly shaping the market landscape. Competitive substitutes include traditional e-commerce and in-store shopping experiences. End-user demographics are expanding to include a wider range of age groups and consumer segments as AR technology becomes more accessible and user-friendly. M&A activity is relatively high, driven by the desire for companies to acquire innovative technologies and expand their market reach.
- Market Concentration: Moderately concentrated, with top 5 players holding approximately xx% market share (2025).
- Technological Innovation Drivers: Advancements in AR hardware, software development kits (SDKs), and computer vision.
- Regulatory Frameworks: Data privacy regulations (GDPR, CCPA) and consumer protection laws influence market growth.
- Competitive Product Substitutes: Traditional e-commerce, in-store shopping, virtual reality (VR) shopping experiences.
- End-User Demographics: Expanding to include younger generations (Gen Z and Millennials) and broader age groups.
- M&A Trends: A moderate number of M&A deals annually, averaging xx deals per year during 2019-2024.
Augmented Shopping Market Growth Trends & Insights
The Augmented Shopping market is experiencing dynamic expansion, fueled by the widespread adoption of smartphones, continuous advancements in Augmented Reality (AR) technology, and a growing consumer appetite for interactive shopping. The market size has witnessed substantial growth from 2019 to 2024, a positive trajectory that is anticipated to persist throughout the forecast period (2025-2033). The proliferation of mobile AR applications, coupled with sophisticated developments in computer vision and 3D modeling, is significantly accelerating AR integration in commerce. Consumer preferences are increasingly leaning towards experiential retail, driving the demand for AR-powered solutions that deliver personalized and deeply immersive shopping journeys.
- Market Size Evolution: The market has grown from approximately **XX Million in 2019** to an estimated **XX Million in 2024**, with projections indicating a reach of **XX Million by 2033**.
- CAGR (2019-2024): The Compound Annual Growth Rate for the period 2019-2024 stands at an impressive **XX%**.
- Market Penetration: Reaching **XX% in 2024**, market penetration is forecast to ascend to **XX% by 2033**, signifying broader integration into mainstream retail.
- Technological Disruptions: Key drivers of disruption include the rollout of **5G connectivity**, enhanced **AR tracking capabilities**, and the application of **AI for hyper-personalization**.
- Consumer Behavior Shifts: There is a marked increase in consumer preference for **interactive, engaging, and immersive shopping experiences**, which AR effectively addresses.
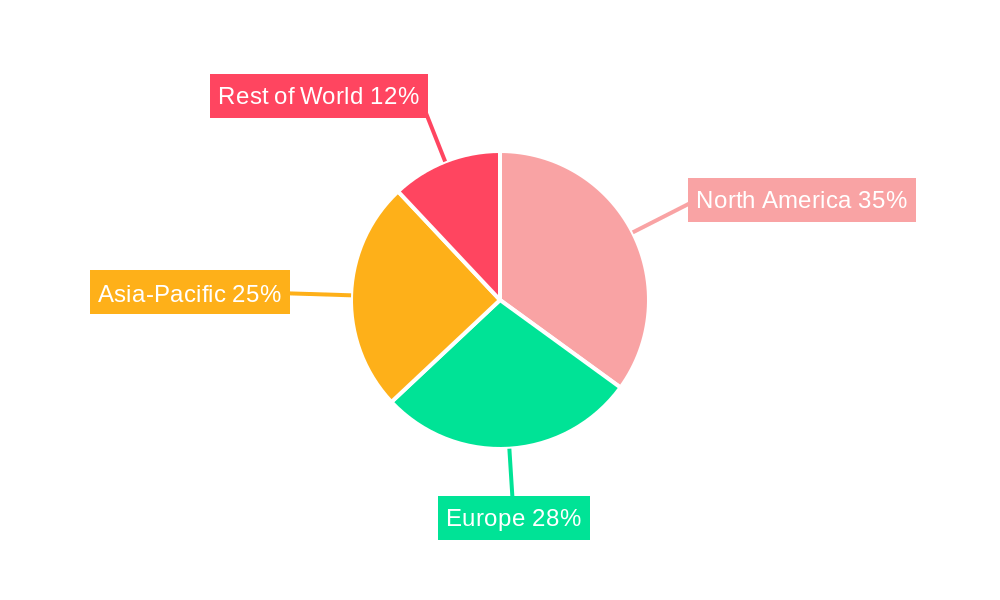
Dominant Regions, Countries, or Segments in Augmented Shopping Market
North America currently holds the largest market share, driven by strong technological advancements, high consumer adoption, and significant investment in AR technologies. However, the Asia-Pacific region is projected to experience the fastest growth rate during the forecast period due to rapid smartphone penetration and increasing e-commerce adoption. Specific countries like the US, China, and Japan are showing significant growth potential within their respective regions.
- North America: High market share driven by technological leadership and strong consumer adoption.
- Asia-Pacific: Fastest-growing region due to rapid smartphone penetration and e-commerce growth.
- Europe: Significant market presence, particularly in Western Europe, with increasing adoption rates.
- Key Growth Drivers: Strong technological infrastructure, favorable government policies, rising disposable incomes, and increased internet and smartphone penetration.
Augmented Shopping Market Product Landscape
The Augmented Shopping market offers a diverse array of AR applications designed to transform the retail experience. These range from sophisticated virtual try-on tools for fashion and beauty products to realistic 3D product visualizations for home décor and furniture. At the core of these applications are cutting-edge technologies such as advanced computer vision for object recognition, precise 3D modeling for accurate representation, and AI-driven personalization to tailor experiences to individual shoppers. Key performance indicators for these solutions include elevated user engagement, improved conversion rates, and higher customer satisfaction. The unique value propositions of AR shopping solutions lie in their ability to offer highly personalized product previews, dynamic and interactive product demonstrations, and seamless integration with existing e-commerce platforms, thereby bridging the gap between online convenience and in-store tangibility.
Key Drivers, Barriers & Challenges in Augmented Shopping Market
Key Drivers:
- Technological Advancements: Improvements in AR hardware, software, and computer vision capabilities.
- Rising Smartphone Penetration: Increased accessibility to AR-enabled devices.
- Growing Consumer Demand: Preference for interactive and immersive shopping experiences.
Key Barriers and Challenges:
- High Development Costs: Developing and implementing high-quality AR applications can be expensive.
- Data Privacy Concerns: Concerns about the collection and use of consumer data.
- Lack of AR Literacy: Consumers may be unfamiliar with AR technology, requiring educational initiatives.
- Supply Chain Disruptions: Potential disruptions to the supply of AR hardware and software.
Emerging Opportunities in Augmented Shopping Market
- Expansion into Untapped Markets: Exploring opportunities in emerging economies with high growth potential.
- Development of New AR Applications: Creating innovative AR applications for various product categories.
- Integration with Metaverse Platforms: Leveraging metaverse technologies to create immersive shopping experiences.
- Personalized AR Experiences: Developing customized AR shopping experiences based on consumer preferences.
Growth Accelerators in the Augmented Shopping Market Industry
Strategic partnerships between technology companies and retailers are driving market expansion. Technological breakthroughs in AR hardware and software are continually improving the user experience and expanding application possibilities. Moreover, increasing investment in AR research and development is fueling innovation and driving the growth of the augmented shopping market.
Key Players Shaping the Augmented Shopping Market Market
- Magic Leap
- Blippar
- Groove Jones
- IKEA Place
- ModiFace
- Obsess
- HoloLens
- Zugara Inc
- PTC Vuforia
- Apple Inc
- List Not Exhaustive
Notable Milestones in Augmented Shopping Market Sector
- August 2023: Blackjack Promotions successfully launched its inaugural immersive AR campaign in collaboration with Dufry, specifically targeting families within the travel retail sector to enhance their shopping experience.
- May 2024: Google and Magic Leap formalized a strategic partnership aimed at advancing the development of next-generation AR and optical solutions, signaling a significant commitment to the future of immersive technologies.
In-Depth Augmented Shopping Market Market Outlook
The Augmented Shopping market is poised for exceptional future growth, propelled by relentless technological innovation, burgeoning consumer acceptance, and strategic industry collaborations. The market is ripe for transformative expansion, presenting abundant opportunities for pioneering new applications and penetrating emerging markets. Businesses that adeptly integrate AR into their retail strategies are set to gain a significant competitive edge, capturing a substantial share of this rapidly evolving and lucrative market. The ongoing evolution of AR capabilities promises to further blur the lines between the digital and physical shopping realms, creating even more compelling and personalized customer journeys.
Augmented Shopping Market Segmentation
-
1. Component
- 1.1. Solutions
- 1.2. Services
-
2. Application
- 2.1. Furniture and Lighting
- 2.2. Beauty and Cosmetics
- 2.3. Apparel Fitting
- 2.4. Grocery Shopping
- 2.5. Footwear
- 2.6. Other Applications
Augmented Shopping Market Segmentation By Geography
-
1. North America
- 1.1. United States
- 1.2. Canada
- 1.3. Rest of North America
-
2. Europe
- 2.1. Germany
- 2.2. United Kingdom
- 2.3. France
- 2.4. Russia
- 2.5. Spain
- 2.6. Rest of Europe
-
3. Asia Pacific
- 3.1. India
- 3.2. China
- 3.3. Japan
- 3.4. Rest of Asia Pacific
-
4. South America
- 4.1. Brazil
- 4.2. Argentina
- 4.3. Rest of South America
-
5. Middle East
- 5.1. United Arab Emirates
- 5.2. Saudi Arabia
- 5.3. Rest of Middle East
Augmented Shopping Market Regional Market Share
Geographic Coverage of Augmented Shopping Market
Augmented Shopping Market REPORT HIGHLIGHTS
| Aspects | Details |
|---|---|
| Study Period | 2020-2034 |
| Base Year | 2025 |
| Estimated Year | 2026 |
| Forecast Period | 2026-2034 |
| Historical Period | 2020-2025 |
| Growth Rate | CAGR of 15.78% from 2020-2034 |
| Segmentation |
|
Table of Contents
- 1. Introduction
- 1.1. Research Scope
- 1.2. Market Segmentation
- 1.3. Research Objective
- 1.4. Definitions and Assumptions
- 2. Executive Summary
- 2.1. Market Snapshot
- 3. Market Dynamics
- 3.1. Market Drivers
- 3.2. Market Restrains
- 3.3. Market Trends
- 3.4. Market Opportunities
- 4. Market Factor Analysis
- 4.1. Porters Five Forces
- 4.1.1. Bargaining Power of Suppliers
- 4.1.2. Bargaining Power of Buyers
- 4.1.3. Threat of New Entrants
- 4.1.4. Threat of Substitutes
- 4.1.5. Competitive Rivalry
- 4.2. PESTEL analysis
- 4.3. BCG Analysis
- 4.3.1. Stars (High Growth, High Market Share)
- 4.3.2. Cash Cows (Low Growth, High Market Share)
- 4.3.3. Question Mark (High Growth, Low Market Share)
- 4.3.4. Dogs (Low Growth, Low Market Share)
- 4.4. Ansoff Matrix Analysis
- 4.5. Supply Chain Analysis
- 4.6. Regulatory Landscape
- 4.7. Current Market Potential and Opportunity Assessment (TAM–SAM–SOM Framework)
- 4.8. VDR Analyst Note
- 4.1. Porters Five Forces
- 5. Market Analysis, Insights and Forecast 2021-2033
- 5.1. Market Analysis, Insights and Forecast - by Component
- 5.1.1. Solutions
- 5.1.2. Services
- 5.2. Market Analysis, Insights and Forecast - by Application
- 5.2.1. Furniture and Lighting
- 5.2.2. Beauty and Cosmetics
- 5.2.3. Apparel Fitting
- 5.2.4. Grocery Shopping
- 5.2.5. Footwear
- 5.2.6. Other Applications
- 5.3. Market Analysis, Insights and Forecast - by Region
- 5.3.1. North America
- 5.3.2. Europe
- 5.3.3. Asia Pacific
- 5.3.4. South America
- 5.3.5. Middle East
- 5.1. Market Analysis, Insights and Forecast - by Component
- 6. Global Augmented Shopping Market Analysis, Insights and Forecast, 2021-2033
- 6.1. Market Analysis, Insights and Forecast - by Component
- 6.1.1. Solutions
- 6.1.2. Services
- 6.2. Market Analysis, Insights and Forecast - by Application
- 6.2.1. Furniture and Lighting
- 6.2.2. Beauty and Cosmetics
- 6.2.3. Apparel Fitting
- 6.2.4. Grocery Shopping
- 6.2.5. Footwear
- 6.2.6. Other Applications
- 6.1. Market Analysis, Insights and Forecast - by Component
- 7. North America Augmented Shopping Market Analysis, Insights and Forecast, 2021-2033
- 7.1. Market Analysis, Insights and Forecast - by Component
- 7.1.1. Solutions
- 7.1.2. Services
- 7.2. Market Analysis, Insights and Forecast - by Application
- 7.2.1. Furniture and Lighting
- 7.2.2. Beauty and Cosmetics
- 7.2.3. Apparel Fitting
- 7.2.4. Grocery Shopping
- 7.2.5. Footwear
- 7.2.6. Other Applications
- 7.1. Market Analysis, Insights and Forecast - by Component
- 8. Europe Augmented Shopping Market Analysis, Insights and Forecast, 2021-2033
- 8.1. Market Analysis, Insights and Forecast - by Component
- 8.1.1. Solutions
- 8.1.2. Services
- 8.2. Market Analysis, Insights and Forecast - by Application
- 8.2.1. Furniture and Lighting
- 8.2.2. Beauty and Cosmetics
- 8.2.3. Apparel Fitting
- 8.2.4. Grocery Shopping
- 8.2.5. Footwear
- 8.2.6. Other Applications
- 8.1. Market Analysis, Insights and Forecast - by Component
- 9. Asia Pacific Augmented Shopping Market Analysis, Insights and Forecast, 2021-2033
- 9.1. Market Analysis, Insights and Forecast - by Component
- 9.1.1. Solutions
- 9.1.2. Services
- 9.2. Market Analysis, Insights and Forecast - by Application
- 9.2.1. Furniture and Lighting
- 9.2.2. Beauty and Cosmetics
- 9.2.3. Apparel Fitting
- 9.2.4. Grocery Shopping
- 9.2.5. Footwear
- 9.2.6. Other Applications
- 9.1. Market Analysis, Insights and Forecast - by Component
- 10. South America Augmented Shopping Market Analysis, Insights and Forecast, 2021-2033
- 10.1. Market Analysis, Insights and Forecast - by Component
- 10.1.1. Solutions
- 10.1.2. Services
- 10.2. Market Analysis, Insights and Forecast - by Application
- 10.2.1. Furniture and Lighting
- 10.2.2. Beauty and Cosmetics
- 10.2.3. Apparel Fitting
- 10.2.4. Grocery Shopping
- 10.2.5. Footwear
- 10.2.6. Other Applications
- 10.1. Market Analysis, Insights and Forecast - by Component
- 11. Middle East Augmented Shopping Market Analysis, Insights and Forecast, 2021-2033
- 11.1. Market Analysis, Insights and Forecast - by Component
- 11.1.1. Solutions
- 11.1.2. Services
- 11.2. Market Analysis, Insights and Forecast - by Application
- 11.2.1. Furniture and Lighting
- 11.2.2. Beauty and Cosmetics
- 11.2.3. Apparel Fitting
- 11.2.4. Grocery Shopping
- 11.2.5. Footwear
- 11.2.6. Other Applications
- 11.1. Market Analysis, Insights and Forecast - by Component
- 12. Competitive Analysis
- 12.1. Company Profiles
- 12.1.1 Magic Leap
- 12.1.1.1. Company Overview
- 12.1.1.2. Products
- 12.1.1.3. Company Financials
- 12.1.1.4. SWOT Analysis
- 12.1.2 Blippar
- 12.1.2.1. Company Overview
- 12.1.2.2. Products
- 12.1.2.3. Company Financials
- 12.1.2.4. SWOT Analysis
- 12.1.3 Groove Jones
- 12.1.3.1. Company Overview
- 12.1.3.2. Products
- 12.1.3.3. Company Financials
- 12.1.3.4. SWOT Analysis
- 12.1.4 IKEA Place
- 12.1.4.1. Company Overview
- 12.1.4.2. Products
- 12.1.4.3. Company Financials
- 12.1.4.4. SWOT Analysis
- 12.1.5 ModiFace
- 12.1.5.1. Company Overview
- 12.1.5.2. Products
- 12.1.5.3. Company Financials
- 12.1.5.4. SWOT Analysis
- 12.1.6 Obsess
- 12.1.6.1. Company Overview
- 12.1.6.2. Products
- 12.1.6.3. Company Financials
- 12.1.6.4. SWOT Analysis
- 12.1.7 HoloLens
- 12.1.7.1. Company Overview
- 12.1.7.2. Products
- 12.1.7.3. Company Financials
- 12.1.7.4. SWOT Analysis
- 12.1.8 Zugara Inc
- 12.1.8.1. Company Overview
- 12.1.8.2. Products
- 12.1.8.3. Company Financials
- 12.1.8.4. SWOT Analysis
- 12.1.9 PTC Vuforia
- 12.1.9.1. Company Overview
- 12.1.9.2. Products
- 12.1.9.3. Company Financials
- 12.1.9.4. SWOT Analysis
- 12.1.10 Apple Inc **List Not Exhaustive
- 12.1.10.1. Company Overview
- 12.1.10.2. Products
- 12.1.10.3. Company Financials
- 12.1.10.4. SWOT Analysis
- 12.1.1 Magic Leap
- 12.2. Market Entropy
- 12.2.1 Company's Key Areas Served
- 12.2.2 Recent Developments
- 12.3. Company Market Share Analysis 2025
- 12.3.1 Top 5 Companies Market Share Analysis
- 12.3.2 Top 3 Companies Market Share Analysis
- 12.4. List of Potential Customers
- 13. Research Methodology
List of Figures
- Figure 1: Global Augmented Shopping Market Revenue Breakdown (Million, %) by Region 2025 & 2033
- Figure 2: Global Augmented Shopping Market Volume Breakdown (Billion, %) by Region 2025 & 2033
- Figure 3: North America Augmented Shopping Market Revenue (Million), by Component 2025 & 2033
- Figure 4: North America Augmented Shopping Market Volume (Billion), by Component 2025 & 2033
- Figure 5: North America Augmented Shopping Market Revenue Share (%), by Component 2025 & 2033
- Figure 6: North America Augmented Shopping Market Volume Share (%), by Component 2025 & 2033
- Figure 7: North America Augmented Shopping Market Revenue (Million), by Application 2025 & 2033
- Figure 8: North America Augmented Shopping Market Volume (Billion), by Application 2025 & 2033
- Figure 9: North America Augmented Shopping Market Revenue Share (%), by Application 2025 & 2033
- Figure 10: North America Augmented Shopping Market Volume Share (%), by Application 2025 & 2033
- Figure 11: North America Augmented Shopping Market Revenue (Million), by Country 2025 & 2033
- Figure 12: North America Augmented Shopping Market Volume (Billion), by Country 2025 & 2033
- Figure 13: North America Augmented Shopping Market Revenue Share (%), by Country 2025 & 2033
- Figure 14: North America Augmented Shopping Market Volume Share (%), by Country 2025 & 2033
- Figure 15: Europe Augmented Shopping Market Revenue (Million), by Component 2025 & 2033
- Figure 16: Europe Augmented Shopping Market Volume (Billion), by Component 2025 & 2033
- Figure 17: Europe Augmented Shopping Market Revenue Share (%), by Component 2025 & 2033
- Figure 18: Europe Augmented Shopping Market Volume Share (%), by Component 2025 & 2033
- Figure 19: Europe Augmented Shopping Market Revenue (Million), by Application 2025 & 2033
- Figure 20: Europe Augmented Shopping Market Volume (Billion), by Application 2025 & 2033
- Figure 21: Europe Augmented Shopping Market Revenue Share (%), by Application 2025 & 2033
- Figure 22: Europe Augmented Shopping Market Volume Share (%), by Application 2025 & 2033
- Figure 23: Europe Augmented Shopping Market Revenue (Million), by Country 2025 & 2033
- Figure 24: Europe Augmented Shopping Market Volume (Billion), by Country 2025 & 2033
- Figure 25: Europe Augmented Shopping Market Revenue Share (%), by Country 2025 & 2033
- Figure 26: Europe Augmented Shopping Market Volume Share (%), by Country 2025 & 2033
- Figure 27: Asia Pacific Augmented Shopping Market Revenue (Million), by Component 2025 & 2033
- Figure 28: Asia Pacific Augmented Shopping Market Volume (Billion), by Component 2025 & 2033
- Figure 29: Asia Pacific Augmented Shopping Market Revenue Share (%), by Component 2025 & 2033
- Figure 30: Asia Pacific Augmented Shopping Market Volume Share (%), by Component 2025 & 2033
- Figure 31: Asia Pacific Augmented Shopping Market Revenue (Million), by Application 2025 & 2033
- Figure 32: Asia Pacific Augmented Shopping Market Volume (Billion), by Application 2025 & 2033
- Figure 33: Asia Pacific Augmented Shopping Market Revenue Share (%), by Application 2025 & 2033
- Figure 34: Asia Pacific Augmented Shopping Market Volume Share (%), by Application 2025 & 2033
- Figure 35: Asia Pacific Augmented Shopping Market Revenue (Million), by Country 2025 & 2033
- Figure 36: Asia Pacific Augmented Shopping Market Volume (Billion), by Country 2025 & 2033
- Figure 37: Asia Pacific Augmented Shopping Market Revenue Share (%), by Country 2025 & 2033
- Figure 38: Asia Pacific Augmented Shopping Market Volume Share (%), by Country 2025 & 2033
- Figure 39: South America Augmented Shopping Market Revenue (Million), by Component 2025 & 2033
- Figure 40: South America Augmented Shopping Market Volume (Billion), by Component 2025 & 2033
- Figure 41: South America Augmented Shopping Market Revenue Share (%), by Component 2025 & 2033
- Figure 42: South America Augmented Shopping Market Volume Share (%), by Component 2025 & 2033
- Figure 43: South America Augmented Shopping Market Revenue (Million), by Application 2025 & 2033
- Figure 44: South America Augmented Shopping Market Volume (Billion), by Application 2025 & 2033
- Figure 45: South America Augmented Shopping Market Revenue Share (%), by Application 2025 & 2033
- Figure 46: South America Augmented Shopping Market Volume Share (%), by Application 2025 & 2033
- Figure 47: South America Augmented Shopping Market Revenue (Million), by Country 2025 & 2033
- Figure 48: South America Augmented Shopping Market Volume (Billion), by Country 2025 & 2033
- Figure 49: South America Augmented Shopping Market Revenue Share (%), by Country 2025 & 2033
- Figure 50: South America Augmented Shopping Market Volume Share (%), by Country 2025 & 2033
- Figure 51: Middle East Augmented Shopping Market Revenue (Million), by Component 2025 & 2033
- Figure 52: Middle East Augmented Shopping Market Volume (Billion), by Component 2025 & 2033
- Figure 53: Middle East Augmented Shopping Market Revenue Share (%), by Component 2025 & 2033
- Figure 54: Middle East Augmented Shopping Market Volume Share (%), by Component 2025 & 2033
- Figure 55: Middle East Augmented Shopping Market Revenue (Million), by Application 2025 & 2033
- Figure 56: Middle East Augmented Shopping Market Volume (Billion), by Application 2025 & 2033
- Figure 57: Middle East Augmented Shopping Market Revenue Share (%), by Application 2025 & 2033
- Figure 58: Middle East Augmented Shopping Market Volume Share (%), by Application 2025 & 2033
- Figure 59: Middle East Augmented Shopping Market Revenue (Million), by Country 2025 & 2033
- Figure 60: Middle East Augmented Shopping Market Volume (Billion), by Country 2025 & 2033
- Figure 61: Middle East Augmented Shopping Market Revenue Share (%), by Country 2025 & 2033
- Figure 62: Middle East Augmented Shopping Market Volume Share (%), by Country 2025 & 2033
List of Tables
- Table 1: Global Augmented Shopping Market Revenue Million Forecast, by Component 2020 & 2033
- Table 2: Global Augmented Shopping Market Volume Billion Forecast, by Component 2020 & 2033
- Table 3: Global Augmented Shopping Market Revenue Million Forecast, by Application 2020 & 2033
- Table 4: Global Augmented Shopping Market Volume Billion Forecast, by Application 2020 & 2033
- Table 5: Global Augmented Shopping Market Revenue Million Forecast, by Region 2020 & 2033
- Table 6: Global Augmented Shopping Market Volume Billion Forecast, by Region 2020 & 2033
- Table 7: Global Augmented Shopping Market Revenue Million Forecast, by Component 2020 & 2033
- Table 8: Global Augmented Shopping Market Volume Billion Forecast, by Component 2020 & 2033
- Table 9: Global Augmented Shopping Market Revenue Million Forecast, by Application 2020 & 2033
- Table 10: Global Augmented Shopping Market Volume Billion Forecast, by Application 2020 & 2033
- Table 11: Global Augmented Shopping Market Revenue Million Forecast, by Country 2020 & 2033
- Table 12: Global Augmented Shopping Market Volume Billion Forecast, by Country 2020 & 2033
- Table 13: United States Augmented Shopping Market Revenue (Million) Forecast, by Application 2020 & 2033
- Table 14: United States Augmented Shopping Market Volume (Billion) Forecast, by Application 2020 & 2033
- Table 15: Canada Augmented Shopping Market Revenue (Million) Forecast, by Application 2020 & 2033
- Table 16: Canada Augmented Shopping Market Volume (Billion) Forecast, by Application 2020 & 2033
- Table 17: Rest of North America Augmented Shopping Market Revenue (Million) Forecast, by Application 2020 & 2033
- Table 18: Rest of North America Augmented Shopping Market Volume (Billion) Forecast, by Application 2020 & 2033
- Table 19: Global Augmented Shopping Market Revenue Million Forecast, by Component 2020 & 2033
- Table 20: Global Augmented Shopping Market Volume Billion Forecast, by Component 2020 & 2033
- Table 21: Global Augmented Shopping Market Revenue Million Forecast, by Application 2020 & 2033
- Table 22: Global Augmented Shopping Market Volume Billion Forecast, by Application 2020 & 2033
- Table 23: Global Augmented Shopping Market Revenue Million Forecast, by Country 2020 & 2033
- Table 24: Global Augmented Shopping Market Volume Billion Forecast, by Country 2020 & 2033
- Table 25: Germany Augmented Shopping Market Revenue (Million) Forecast, by Application 2020 & 2033
- Table 26: Germany Augmented Shopping Market Volume (Billion) Forecast, by Application 2020 & 2033
- Table 27: United Kingdom Augmented Shopping Market Revenue (Million) Forecast, by Application 2020 & 2033
- Table 28: United Kingdom Augmented Shopping Market Volume (Billion) Forecast, by Application 2020 & 2033
- Table 29: France Augmented Shopping Market Revenue (Million) Forecast, by Application 2020 & 2033
- Table 30: France Augmented Shopping Market Volume (Billion) Forecast, by Application 2020 & 2033
- Table 31: Russia Augmented Shopping Market Revenue (Million) Forecast, by Application 2020 & 2033
- Table 32: Russia Augmented Shopping Market Volume (Billion) Forecast, by Application 2020 & 2033
- Table 33: Spain Augmented Shopping Market Revenue (Million) Forecast, by Application 2020 & 2033
- Table 34: Spain Augmented Shopping Market Volume (Billion) Forecast, by Application 2020 & 2033
- Table 35: Rest of Europe Augmented Shopping Market Revenue (Million) Forecast, by Application 2020 & 2033
- Table 36: Rest of Europe Augmented Shopping Market Volume (Billion) Forecast, by Application 2020 & 2033
- Table 37: Global Augmented Shopping Market Revenue Million Forecast, by Component 2020 & 2033
- Table 38: Global Augmented Shopping Market Volume Billion Forecast, by Component 2020 & 2033
- Table 39: Global Augmented Shopping Market Revenue Million Forecast, by Application 2020 & 2033
- Table 40: Global Augmented Shopping Market Volume Billion Forecast, by Application 2020 & 2033
- Table 41: Global Augmented Shopping Market Revenue Million Forecast, by Country 2020 & 2033
- Table 42: Global Augmented Shopping Market Volume Billion Forecast, by Country 2020 & 2033
- Table 43: India Augmented Shopping Market Revenue (Million) Forecast, by Application 2020 & 2033
- Table 44: India Augmented Shopping Market Volume (Billion) Forecast, by Application 2020 & 2033
- Table 45: China Augmented Shopping Market Revenue (Million) Forecast, by Application 2020 & 2033
- Table 46: China Augmented Shopping Market Volume (Billion) Forecast, by Application 2020 & 2033
- Table 47: Japan Augmented Shopping Market Revenue (Million) Forecast, by Application 2020 & 2033
- Table 48: Japan Augmented Shopping Market Volume (Billion) Forecast, by Application 2020 & 2033
- Table 49: Rest of Asia Pacific Augmented Shopping Market Revenue (Million) Forecast, by Application 2020 & 2033
- Table 50: Rest of Asia Pacific Augmented Shopping Market Volume (Billion) Forecast, by Application 2020 & 2033
- Table 51: Global Augmented Shopping Market Revenue Million Forecast, by Component 2020 & 2033
- Table 52: Global Augmented Shopping Market Volume Billion Forecast, by Component 2020 & 2033
- Table 53: Global Augmented Shopping Market Revenue Million Forecast, by Application 2020 & 2033
- Table 54: Global Augmented Shopping Market Volume Billion Forecast, by Application 2020 & 2033
- Table 55: Global Augmented Shopping Market Revenue Million Forecast, by Country 2020 & 2033
- Table 56: Global Augmented Shopping Market Volume Billion Forecast, by Country 2020 & 2033
- Table 57: Brazil Augmented Shopping Market Revenue (Million) Forecast, by Application 2020 & 2033
- Table 58: Brazil Augmented Shopping Market Volume (Billion) Forecast, by Application 2020 & 2033
- Table 59: Argentina Augmented Shopping Market Revenue (Million) Forecast, by Application 2020 & 2033
- Table 60: Argentina Augmented Shopping Market Volume (Billion) Forecast, by Application 2020 & 2033
- Table 61: Rest of South America Augmented Shopping Market Revenue (Million) Forecast, by Application 2020 & 2033
- Table 62: Rest of South America Augmented Shopping Market Volume (Billion) Forecast, by Application 2020 & 2033
- Table 63: Global Augmented Shopping Market Revenue Million Forecast, by Component 2020 & 2033
- Table 64: Global Augmented Shopping Market Volume Billion Forecast, by Component 2020 & 2033
- Table 65: Global Augmented Shopping Market Revenue Million Forecast, by Application 2020 & 2033
- Table 66: Global Augmented Shopping Market Volume Billion Forecast, by Application 2020 & 2033
- Table 67: Global Augmented Shopping Market Revenue Million Forecast, by Country 2020 & 2033
- Table 68: Global Augmented Shopping Market Volume Billion Forecast, by Country 2020 & 2033
- Table 69: United Arab Emirates Augmented Shopping Market Revenue (Million) Forecast, by Application 2020 & 2033
- Table 70: United Arab Emirates Augmented Shopping Market Volume (Billion) Forecast, by Application 2020 & 2033
- Table 71: Saudi Arabia Augmented Shopping Market Revenue (Million) Forecast, by Application 2020 & 2033
- Table 72: Saudi Arabia Augmented Shopping Market Volume (Billion) Forecast, by Application 2020 & 2033
- Table 73: Rest of Middle East Augmented Shopping Market Revenue (Million) Forecast, by Application 2020 & 2033
- Table 74: Rest of Middle East Augmented Shopping Market Volume (Billion) Forecast, by Application 2020 & 2033
Frequently Asked Questions
1. What is the projected Compound Annual Growth Rate (CAGR) of the Augmented Shopping Market?
The projected CAGR is approximately 15.78%.
2. Which companies are prominent players in the Augmented Shopping Market?
Key companies in the market include Magic Leap, Blippar, Groove Jones, IKEA Place, ModiFace, Obsess, HoloLens, Zugara Inc, PTC Vuforia, Apple Inc **List Not Exhaustive.
3. What are the main segments of the Augmented Shopping Market?
The market segments include Component , Application.
4. Can you provide details about the market size?
The market size is estimated to be USD 15.52 Million as of 2022.
5. What are some drivers contributing to market growth?
The Growing Number of Smartphone and Tablets is Driving the Market; Technological Advancements is Driving the Market.
6. What are the notable trends driving market growth?
Growing Demand for Furniture and Lighting in Asia-Pacific.
7. Are there any restraints impacting market growth?
The Growing Number of Smartphone and Tablets is Driving the Market; Technological Advancements is Driving the Market.
8. Can you provide examples of recent developments in the market?
May 2024: Alphabet Inc.'s Google and the augmented reality startup Magic Leap Inc. revealed a strategic partnership. The collaboration aims to focus on developing augmented reality (AR) and optical solutions.August 2023: In collaboration with Dufry, Blackjack Promotions, a UK travel retail and brand experience provider, introduced its first immersive augmented reality campaign targeted at families.
9. What pricing options are available for accessing the report?
Pricing options include single-user, multi-user, and enterprise licenses priced at USD 4750, USD 5250, and USD 8750 respectively.
10. Is the market size provided in terms of value or volume?
The market size is provided in terms of value, measured in Million and volume, measured in Billion.
11. Are there any specific market keywords associated with the report?
Yes, the market keyword associated with the report is "Augmented Shopping Market," which aids in identifying and referencing the specific market segment covered.
12. How do I determine which pricing option suits my needs best?
The pricing options vary based on user requirements and access needs. Individual users may opt for single-user licenses, while businesses requiring broader access may choose multi-user or enterprise licenses for cost-effective access to the report.
13. Are there any additional resources or data provided in the Augmented Shopping Market report?
While the report offers comprehensive insights, it's advisable to review the specific contents or supplementary materials provided to ascertain if additional resources or data are available.
14. How can I stay updated on further developments or reports in the Augmented Shopping Market?
To stay informed about further developments, trends, and reports in the Augmented Shopping Market, consider subscribing to industry newsletters, following relevant companies and organizations, or regularly checking reputable industry news sources and publications.
Methodology
Step 1 - Identification of Relevant Samples Size from Population Database


Step 2 - Approaches for Defining Global Market Size (Value, Volume* & Price*)

Note*: In applicable scenarios
Step 3 - Data Sources
Primary Research
- Web Analytics
- Survey Reports
- Research Institute
- Latest Research Reports
- Opinion Leaders
Secondary Research
- Annual Reports
- White Paper
- Latest Press Release
- Industry Association
- Paid Database
- Investor Presentations

Step 4 - Data Triangulation
Involves using different sources of information in order to increase the validity of a study
These sources are likely to be stakeholders in a program - participants, other researchers, program staff, other community members, and so on.
Then we put all data in single framework & apply various statistical tools to find out the dynamic on the market.
During the analysis stage, feedback from the stakeholder groups would be compared to determine areas of agreement as well as areas of divergence