
Key Insights
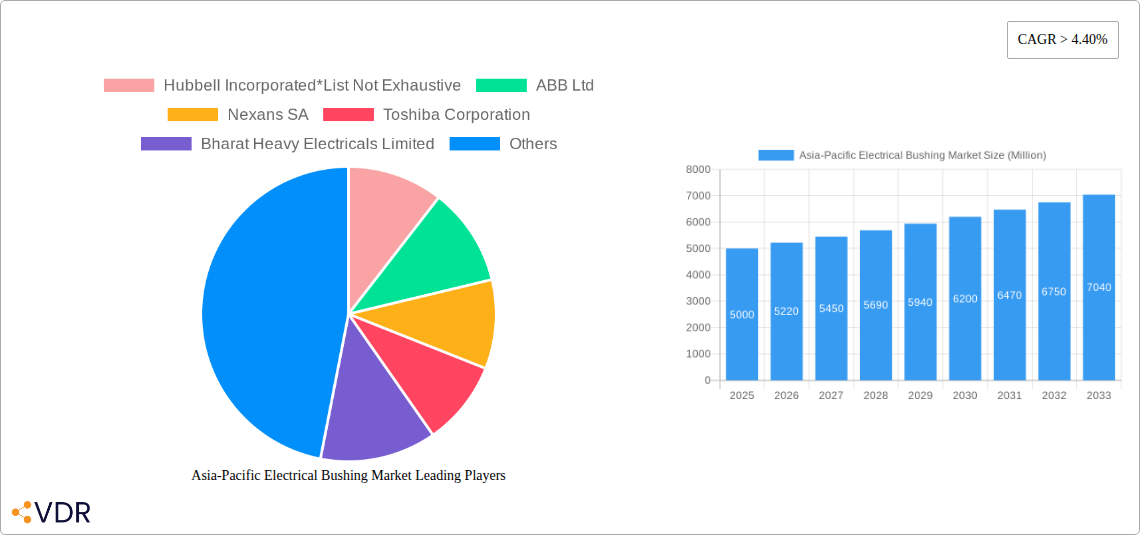
The Asia-Pacific electrical bushing market is experiencing robust growth, driven by the region's expanding power infrastructure, rapid industrialization, and increasing urbanization. A compound annual growth rate (CAGR) exceeding 4.40% from 2019 to 2024 suggests a significant market expansion. This growth is fueled by rising demand for electricity across diverse sectors, including power generation, transmission, and distribution. The increasing adoption of renewable energy sources further contributes to market expansion, as these sources often require specialized bushings for effective integration into the grid. Key segments within the market include oil-impregnated paper and resin-impregnated paper bushings, with transformers and switchgears representing major application areas. China, Japan, India, and South Korea are the leading national markets, reflecting their advanced power sectors and substantial infrastructure investments. However, growth opportunities also exist in other Asia-Pacific countries, as these nations continue to develop their electrical grids.
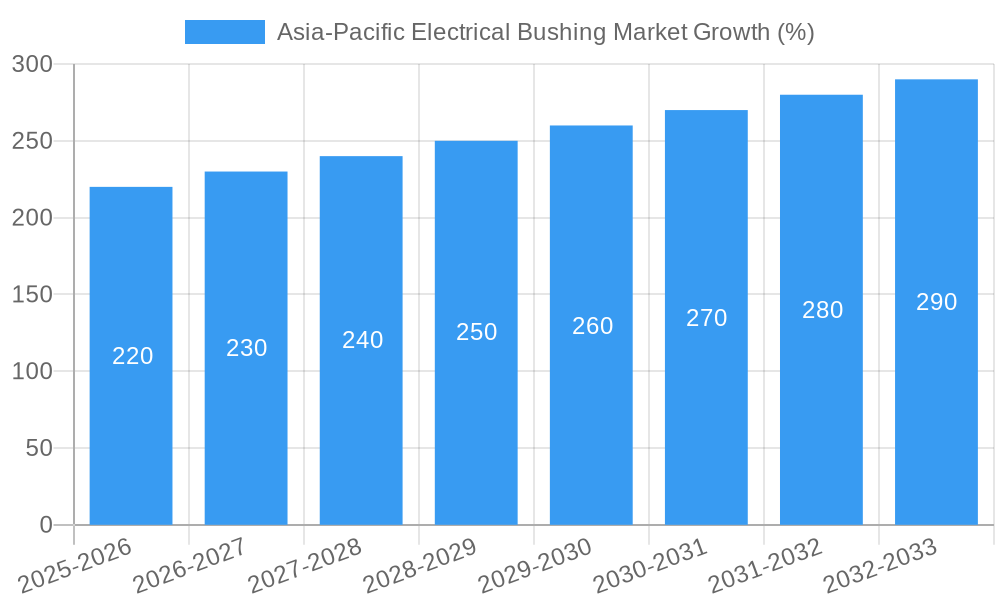
The market's growth trajectory is anticipated to remain positive through 2033. While challenges such as fluctuating raw material prices and stringent regulatory compliance requirements exist, technological advancements leading to higher efficiency and reliability of bushings, coupled with increasing investments in smart grids, are expected to offset these restraints. Leading players like Hubbell Incorporated, ABB Ltd, Nexans SA, and Toshiba Corporation are actively engaged in developing innovative bushing technologies and expanding their market presence through strategic partnerships and acquisitions. The market's future success will hinge on continued investment in grid modernization, a focus on sustainable energy solutions, and the ability of manufacturers to meet the growing demand for high-performance, reliable electrical bushings.
Asia-Pacific Electrical Bushing Market: A Comprehensive Report (2019-2033)
This in-depth report provides a comprehensive analysis of the Asia-Pacific electrical bushing market, covering market dynamics, growth trends, regional segmentation, product landscape, key players, and future outlook. The study period spans from 2019 to 2033, with 2025 as the base and estimated year. This report is crucial for industry professionals, investors, and stakeholders seeking a clear understanding of this dynamic market. The report segments the market by Type (Oil Impregnated Paper, Resin Impregnated Paper, Other Types) and Application (Transformers, Switchgears, Other Applications). The market size is presented in Million units.
Asia-Pacific Electrical Bushing Market Market Dynamics & Structure
The Asia-Pacific electrical bushing market is characterized by moderate concentration, with several key players holding significant market share. Technological innovation, particularly in resin-impregnated paper bushings, is a major growth driver. Stringent regulatory frameworks concerning safety and efficiency influence market dynamics. Competitive substitutes, like alternative insulation technologies, present challenges. End-user demographics, driven by expanding power grids and industrialization, fuel demand. M&A activity remains relatively low, with xx deals recorded in the historical period (2019-2024), representing a xx% market share shift.
- Market Concentration: Moderately concentrated, with top 5 players holding xx% market share (2024).
- Technological Innovation: Focus on improving thermal, electrical, and mechanical performance, leading to the adoption of resin-impregnated paper bushings.
- Regulatory Framework: Stringent safety standards and efficiency regulations drive market evolution.
- Competitive Substitutes: Emergence of alternative insulation materials creates competitive pressure.
- End-User Demographics: Rapid industrialization and expanding power grids in developing economies are key demand drivers.
- M&A Trends: Relatively low M&A activity, with xx deals recorded between 2019 and 2024.
Asia-Pacific Electrical Bushing Market Growth Trends & Insights
The Asia-Pacific electrical bushing market witnessed a CAGR of xx% during the historical period (2019-2024), reaching a market size of xx Million units in 2024. This growth is primarily attributed to increasing electricity demand, infrastructure development, and the adoption of advanced technologies. The market is projected to continue its expansion, with a forecast CAGR of xx% from 2025 to 2033, driven by factors such as rising investments in renewable energy and smart grid initiatives. Market penetration of resin-impregnated paper bushings is expected to increase significantly, reaching xx% by 2033. Technological disruptions, such as the development of next-generation insulation materials, are poised to reshape the market landscape. Consumer behavior shifts towards energy efficiency and sustainability are influencing purchasing decisions.
Dominant Regions, Countries, or Segments in Asia-Pacific Electrical Bushing Market
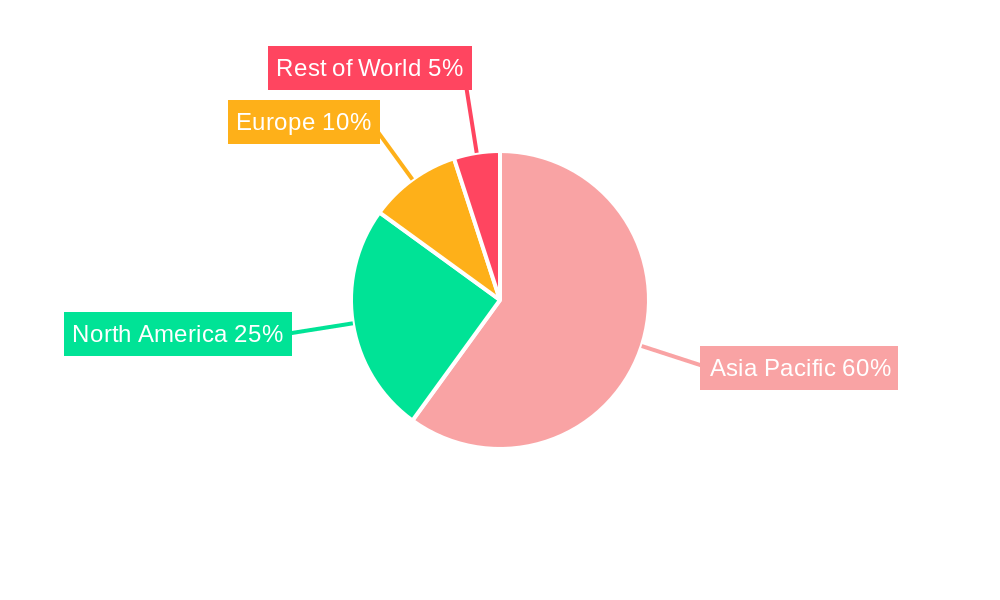
China and India are the dominant markets within the Asia-Pacific region, contributing to xx% and xx% of the total market share in 2024, respectively. The transformer segment holds the largest share within the applications category, followed by switchgears. Within bushing types, oil-impregnated paper bushings still dominate, but resin-impregnated paper bushings are witnessing rapid growth due to their superior performance characteristics.
- Key Drivers: Rapid industrialization and urbanization in China and India, strong government support for infrastructure development, and rising investments in renewable energy projects.
- Dominance Factors: Large power grids, significant manufacturing capabilities, and increasing electricity demand.
- Growth Potential: Untapped markets in Southeast Asia and other developing economies present significant growth opportunities.
Asia-Pacific Electrical Bushing Market Product Landscape
The Asia-Pacific electrical bushing market offers a diverse range of products, including oil-impregnated paper bushings, resin-impregnated paper bushings, and other specialized types. Resin-impregnated paper bushings are gaining traction due to their superior thermal, electrical, and mechanical performance. Key product innovations include improved insulation materials, enhanced designs for higher voltage applications, and integrated monitoring systems for improved reliability. These advancements cater to the demand for improved efficiency, durability, and safety in power transmission and distribution systems.
Key Drivers, Barriers & Challenges in Asia-Pacific Electrical Bushing Market
Key Drivers: Increasing electricity demand, expanding power grids, rising investments in renewable energy, and government initiatives promoting infrastructure development. Technological advancements in insulation materials and manufacturing processes are further accelerating market growth.
Key Challenges: Fluctuations in raw material prices, intense competition, supply chain disruptions, and stringent regulatory compliance requirements. These factors can impact market growth and profitability. The high initial cost of advanced bushing technologies can be a barrier to adoption in certain segments.
Emerging Opportunities in Asia-Pacific Electrical Bushing Market
Emerging opportunities lie in the expansion into untapped markets in Southeast Asia, the increasing demand for high-voltage bushings in renewable energy projects, and the development of smart grid technologies. Innovations in insulation materials and the integration of digital sensors for condition monitoring present significant growth potentials. Focus on energy efficiency and sustainability is creating demand for environmentally friendly bushing solutions.
Growth Accelerators in the Asia-Pacific Electrical Bushing Market Industry
Technological advancements in resin-impregnated paper bushings, strategic partnerships between manufacturers and utilities, and the expansion of manufacturing capabilities in key growth markets are driving long-term growth. Government initiatives to modernize power grids and improve energy efficiency are also creating favorable conditions for market expansion.
Key Players Shaping the Asia-Pacific Electrical Bushing Market Market
- Hubbell Incorporated
- ABB Ltd
- Nexans SA
- Toshiba Corporation
- Bharat Heavy Electricals Limited
- CG Power and Industrial Solutions Limited
- Siemens AG
- Eaton Corporation PLC
- General Electric Company
Notable Milestones in Asia-Pacific Electrical Bushing Market Sector
- May 2022: Hitachi Energy India Ltd. inaugurated its new transformer components factory in Vadodara, Gujarat, producing resin-impregnated paper bushings up to 400 kV. This significantly boosts the domestic manufacturing capacity for high-voltage bushings in India.
In-Depth Asia-Pacific Electrical Bushing Market Market Outlook
The Asia-Pacific electrical bushing market is poised for robust growth in the forecast period (2025-2033), driven by continuous infrastructure development, expanding renewable energy sectors, and technological advancements. Strategic partnerships and investments in research and development will further strengthen the market position of key players. The increasing adoption of high-voltage direct current (HVDC) transmission systems will also create new opportunities for specialized bushing technologies.
Asia-Pacific Electrical Bushing Market Segmentation
-
1. Type
- 1.1. Oil Impregnated Paper
- 1.2. Resin Impregnated Paper
- 1.3. Other Types
-
2. Application
- 2.1. Transformers
- 2.2. Switchgears
- 2.3. Other Applications
-
3. Geography
- 3.1. China
- 3.2. India
- 3.3. Japan
- 3.4. Rest of Asia-Pacific
Asia-Pacific Electrical Bushing Market Segmentation By Geography
- 1. China
- 2. India
- 3. Japan
- 4. Rest of Asia Pacific
Asia-Pacific Electrical Bushing Market REPORT HIGHLIGHTS
| Aspects | Details |
|---|---|
| Study Period | 2019-2033 |
| Base Year | 2024 |
| Estimated Year | 2025 |
| Forecast Period | 2025-2033 |
| Historical Period | 2019-2024 |
| Growth Rate | CAGR of > 4.40% from 2019-2033 |
| Segmentation |
|
Table of Contents
- 1. Introduction
- 1.1. Research Scope
- 1.2. Market Segmentation
- 1.3. Research Methodology
- 1.4. Definitions and Assumptions
- 2. Executive Summary
- 2.1. Introduction
- 3. Market Dynamics
- 3.1. Introduction
- 3.2. Market Drivers
- 3.2.1. Replacement of Existing Grids and the Expansion of Distribution Networks
- 3.3. Market Restrains
- 3.3.1. High Installation Costs
- 3.4. Market Trends
- 3.4.1. Transformer Application to Witness Significant Growth
- 4. Market Factor Analysis
- 4.1. Porters Five Forces
- 4.2. Supply/Value Chain
- 4.3. PESTEL analysis
- 4.4. Market Entropy
- 4.5. Patent/Trademark Analysis
- 5. Asia-Pacific Electrical Bushing Market Analysis, Insights and Forecast, 2019-2031
- 5.1. Market Analysis, Insights and Forecast - by Type
- 5.1.1. Oil Impregnated Paper
- 5.1.2. Resin Impregnated Paper
- 5.1.3. Other Types
- 5.2. Market Analysis, Insights and Forecast - by Application
- 5.2.1. Transformers
- 5.2.2. Switchgears
- 5.2.3. Other Applications
- 5.3. Market Analysis, Insights and Forecast - by Geography
- 5.3.1. China
- 5.3.2. India
- 5.3.3. Japan
- 5.3.4. Rest of Asia-Pacific
- 5.4. Market Analysis, Insights and Forecast - by Region
- 5.4.1. China
- 5.4.2. India
- 5.4.3. Japan
- 5.4.4. Rest of Asia Pacific
- 5.1. Market Analysis, Insights and Forecast - by Type
- 6. China Asia-Pacific Electrical Bushing Market Analysis, Insights and Forecast, 2019-2031
- 6.1. Market Analysis, Insights and Forecast - by Type
- 6.1.1. Oil Impregnated Paper
- 6.1.2. Resin Impregnated Paper
- 6.1.3. Other Types
- 6.2. Market Analysis, Insights and Forecast - by Application
- 6.2.1. Transformers
- 6.2.2. Switchgears
- 6.2.3. Other Applications
- 6.3. Market Analysis, Insights and Forecast - by Geography
- 6.3.1. China
- 6.3.2. India
- 6.3.3. Japan
- 6.3.4. Rest of Asia-Pacific
- 6.1. Market Analysis, Insights and Forecast - by Type
- 7. India Asia-Pacific Electrical Bushing Market Analysis, Insights and Forecast, 2019-2031
- 7.1. Market Analysis, Insights and Forecast - by Type
- 7.1.1. Oil Impregnated Paper
- 7.1.2. Resin Impregnated Paper
- 7.1.3. Other Types
- 7.2. Market Analysis, Insights and Forecast - by Application
- 7.2.1. Transformers
- 7.2.2. Switchgears
- 7.2.3. Other Applications
- 7.3. Market Analysis, Insights and Forecast - by Geography
- 7.3.1. China
- 7.3.2. India
- 7.3.3. Japan
- 7.3.4. Rest of Asia-Pacific
- 7.1. Market Analysis, Insights and Forecast - by Type
- 8. Japan Asia-Pacific Electrical Bushing Market Analysis, Insights and Forecast, 2019-2031
- 8.1. Market Analysis, Insights and Forecast - by Type
- 8.1.1. Oil Impregnated Paper
- 8.1.2. Resin Impregnated Paper
- 8.1.3. Other Types
- 8.2. Market Analysis, Insights and Forecast - by Application
- 8.2.1. Transformers
- 8.2.2. Switchgears
- 8.2.3. Other Applications
- 8.3. Market Analysis, Insights and Forecast - by Geography
- 8.3.1. China
- 8.3.2. India
- 8.3.3. Japan
- 8.3.4. Rest of Asia-Pacific
- 8.1. Market Analysis, Insights and Forecast - by Type
- 9. Rest of Asia Pacific Asia-Pacific Electrical Bushing Market Analysis, Insights and Forecast, 2019-2031
- 9.1. Market Analysis, Insights and Forecast - by Type
- 9.1.1. Oil Impregnated Paper
- 9.1.2. Resin Impregnated Paper
- 9.1.3. Other Types
- 9.2. Market Analysis, Insights and Forecast - by Application
- 9.2.1. Transformers
- 9.2.2. Switchgears
- 9.2.3. Other Applications
- 9.3. Market Analysis, Insights and Forecast - by Geography
- 9.3.1. China
- 9.3.2. India
- 9.3.3. Japan
- 9.3.4. Rest of Asia-Pacific
- 9.1. Market Analysis, Insights and Forecast - by Type
- 10. China Asia-Pacific Electrical Bushing Market Analysis, Insights and Forecast, 2019-2031
- 11. Japan Asia-Pacific Electrical Bushing Market Analysis, Insights and Forecast, 2019-2031
- 12. India Asia-Pacific Electrical Bushing Market Analysis, Insights and Forecast, 2019-2031
- 13. South Korea Asia-Pacific Electrical Bushing Market Analysis, Insights and Forecast, 2019-2031
- 14. Taiwan Asia-Pacific Electrical Bushing Market Analysis, Insights and Forecast, 2019-2031
- 15. Australia Asia-Pacific Electrical Bushing Market Analysis, Insights and Forecast, 2019-2031
- 16. Rest of Asia-Pacific Asia-Pacific Electrical Bushing Market Analysis, Insights and Forecast, 2019-2031
- 17. Competitive Analysis
- 17.1. Market Share Analysis 2024
- 17.2. Company Profiles
- 17.2.1 Hubbell Incorporated*List Not Exhaustive
- 17.2.1.1. Overview
- 17.2.1.2. Products
- 17.2.1.3. SWOT Analysis
- 17.2.1.4. Recent Developments
- 17.2.1.5. Financials (Based on Availability)
- 17.2.2 ABB Ltd
- 17.2.2.1. Overview
- 17.2.2.2. Products
- 17.2.2.3. SWOT Analysis
- 17.2.2.4. Recent Developments
- 17.2.2.5. Financials (Based on Availability)
- 17.2.3 Nexans SA
- 17.2.3.1. Overview
- 17.2.3.2. Products
- 17.2.3.3. SWOT Analysis
- 17.2.3.4. Recent Developments
- 17.2.3.5. Financials (Based on Availability)
- 17.2.4 Toshiba Corporation
- 17.2.4.1. Overview
- 17.2.4.2. Products
- 17.2.4.3. SWOT Analysis
- 17.2.4.4. Recent Developments
- 17.2.4.5. Financials (Based on Availability)
- 17.2.5 Bharat Heavy Electricals Limited
- 17.2.5.1. Overview
- 17.2.5.2. Products
- 17.2.5.3. SWOT Analysis
- 17.2.5.4. Recent Developments
- 17.2.5.5. Financials (Based on Availability)
- 17.2.6 CG Power and Industrial Solutions Limited
- 17.2.6.1. Overview
- 17.2.6.2. Products
- 17.2.6.3. SWOT Analysis
- 17.2.6.4. Recent Developments
- 17.2.6.5. Financials (Based on Availability)
- 17.2.7 Siemens AG
- 17.2.7.1. Overview
- 17.2.7.2. Products
- 17.2.7.3. SWOT Analysis
- 17.2.7.4. Recent Developments
- 17.2.7.5. Financials (Based on Availability)
- 17.2.8 Eaton Corporation PLC
- 17.2.8.1. Overview
- 17.2.8.2. Products
- 17.2.8.3. SWOT Analysis
- 17.2.8.4. Recent Developments
- 17.2.8.5. Financials (Based on Availability)
- 17.2.9 General Electric Company
- 17.2.9.1. Overview
- 17.2.9.2. Products
- 17.2.9.3. SWOT Analysis
- 17.2.9.4. Recent Developments
- 17.2.9.5. Financials (Based on Availability)
- 17.2.1 Hubbell Incorporated*List Not Exhaustive
List of Figures
- Figure 1: Asia-Pacific Electrical Bushing Market Revenue Breakdown (Million, %) by Product 2024 & 2032
- Figure 2: Asia-Pacific Electrical Bushing Market Share (%) by Company 2024
List of Tables
- Table 1: Asia-Pacific Electrical Bushing Market Revenue Million Forecast, by Region 2019 & 2032
- Table 2: Asia-Pacific Electrical Bushing Market Volume K Unit Forecast, by Region 2019 & 2032
- Table 3: Asia-Pacific Electrical Bushing Market Revenue Million Forecast, by Type 2019 & 2032
- Table 4: Asia-Pacific Electrical Bushing Market Volume K Unit Forecast, by Type 2019 & 2032
- Table 5: Asia-Pacific Electrical Bushing Market Revenue Million Forecast, by Application 2019 & 2032
- Table 6: Asia-Pacific Electrical Bushing Market Volume K Unit Forecast, by Application 2019 & 2032
- Table 7: Asia-Pacific Electrical Bushing Market Revenue Million Forecast, by Geography 2019 & 2032
- Table 8: Asia-Pacific Electrical Bushing Market Volume K Unit Forecast, by Geography 2019 & 2032
- Table 9: Asia-Pacific Electrical Bushing Market Revenue Million Forecast, by Region 2019 & 2032
- Table 10: Asia-Pacific Electrical Bushing Market Volume K Unit Forecast, by Region 2019 & 2032
- Table 11: Asia-Pacific Electrical Bushing Market Revenue Million Forecast, by Country 2019 & 2032
- Table 12: Asia-Pacific Electrical Bushing Market Volume K Unit Forecast, by Country 2019 & 2032
- Table 13: China Asia-Pacific Electrical Bushing Market Revenue (Million) Forecast, by Application 2019 & 2032
- Table 14: China Asia-Pacific Electrical Bushing Market Volume (K Unit) Forecast, by Application 2019 & 2032
- Table 15: Japan Asia-Pacific Electrical Bushing Market Revenue (Million) Forecast, by Application 2019 & 2032
- Table 16: Japan Asia-Pacific Electrical Bushing Market Volume (K Unit) Forecast, by Application 2019 & 2032
- Table 17: India Asia-Pacific Electrical Bushing Market Revenue (Million) Forecast, by Application 2019 & 2032
- Table 18: India Asia-Pacific Electrical Bushing Market Volume (K Unit) Forecast, by Application 2019 & 2032
- Table 19: South Korea Asia-Pacific Electrical Bushing Market Revenue (Million) Forecast, by Application 2019 & 2032
- Table 20: South Korea Asia-Pacific Electrical Bushing Market Volume (K Unit) Forecast, by Application 2019 & 2032
- Table 21: Taiwan Asia-Pacific Electrical Bushing Market Revenue (Million) Forecast, by Application 2019 & 2032
- Table 22: Taiwan Asia-Pacific Electrical Bushing Market Volume (K Unit) Forecast, by Application 2019 & 2032
- Table 23: Australia Asia-Pacific Electrical Bushing Market Revenue (Million) Forecast, by Application 2019 & 2032
- Table 24: Australia Asia-Pacific Electrical Bushing Market Volume (K Unit) Forecast, by Application 2019 & 2032
- Table 25: Rest of Asia-Pacific Asia-Pacific Electrical Bushing Market Revenue (Million) Forecast, by Application 2019 & 2032
- Table 26: Rest of Asia-Pacific Asia-Pacific Electrical Bushing Market Volume (K Unit) Forecast, by Application 2019 & 2032
- Table 27: Asia-Pacific Electrical Bushing Market Revenue Million Forecast, by Type 2019 & 2032
- Table 28: Asia-Pacific Electrical Bushing Market Volume K Unit Forecast, by Type 2019 & 2032
- Table 29: Asia-Pacific Electrical Bushing Market Revenue Million Forecast, by Application 2019 & 2032
- Table 30: Asia-Pacific Electrical Bushing Market Volume K Unit Forecast, by Application 2019 & 2032
- Table 31: Asia-Pacific Electrical Bushing Market Revenue Million Forecast, by Geography 2019 & 2032
- Table 32: Asia-Pacific Electrical Bushing Market Volume K Unit Forecast, by Geography 2019 & 2032
- Table 33: Asia-Pacific Electrical Bushing Market Revenue Million Forecast, by Country 2019 & 2032
- Table 34: Asia-Pacific Electrical Bushing Market Volume K Unit Forecast, by Country 2019 & 2032
- Table 35: Asia-Pacific Electrical Bushing Market Revenue Million Forecast, by Type 2019 & 2032
- Table 36: Asia-Pacific Electrical Bushing Market Volume K Unit Forecast, by Type 2019 & 2032
- Table 37: Asia-Pacific Electrical Bushing Market Revenue Million Forecast, by Application 2019 & 2032
- Table 38: Asia-Pacific Electrical Bushing Market Volume K Unit Forecast, by Application 2019 & 2032
- Table 39: Asia-Pacific Electrical Bushing Market Revenue Million Forecast, by Geography 2019 & 2032
- Table 40: Asia-Pacific Electrical Bushing Market Volume K Unit Forecast, by Geography 2019 & 2032
- Table 41: Asia-Pacific Electrical Bushing Market Revenue Million Forecast, by Country 2019 & 2032
- Table 42: Asia-Pacific Electrical Bushing Market Volume K Unit Forecast, by Country 2019 & 2032
- Table 43: Asia-Pacific Electrical Bushing Market Revenue Million Forecast, by Type 2019 & 2032
- Table 44: Asia-Pacific Electrical Bushing Market Volume K Unit Forecast, by Type 2019 & 2032
- Table 45: Asia-Pacific Electrical Bushing Market Revenue Million Forecast, by Application 2019 & 2032
- Table 46: Asia-Pacific Electrical Bushing Market Volume K Unit Forecast, by Application 2019 & 2032
- Table 47: Asia-Pacific Electrical Bushing Market Revenue Million Forecast, by Geography 2019 & 2032
- Table 48: Asia-Pacific Electrical Bushing Market Volume K Unit Forecast, by Geography 2019 & 2032
- Table 49: Asia-Pacific Electrical Bushing Market Revenue Million Forecast, by Country 2019 & 2032
- Table 50: Asia-Pacific Electrical Bushing Market Volume K Unit Forecast, by Country 2019 & 2032
- Table 51: Asia-Pacific Electrical Bushing Market Revenue Million Forecast, by Type 2019 & 2032
- Table 52: Asia-Pacific Electrical Bushing Market Volume K Unit Forecast, by Type 2019 & 2032
- Table 53: Asia-Pacific Electrical Bushing Market Revenue Million Forecast, by Application 2019 & 2032
- Table 54: Asia-Pacific Electrical Bushing Market Volume K Unit Forecast, by Application 2019 & 2032
- Table 55: Asia-Pacific Electrical Bushing Market Revenue Million Forecast, by Geography 2019 & 2032
- Table 56: Asia-Pacific Electrical Bushing Market Volume K Unit Forecast, by Geography 2019 & 2032
- Table 57: Asia-Pacific Electrical Bushing Market Revenue Million Forecast, by Country 2019 & 2032
- Table 58: Asia-Pacific Electrical Bushing Market Volume K Unit Forecast, by Country 2019 & 2032
Frequently Asked Questions
1. What is the projected Compound Annual Growth Rate (CAGR) of the Asia-Pacific Electrical Bushing Market?
The projected CAGR is approximately > 4.40%.
2. Which companies are prominent players in the Asia-Pacific Electrical Bushing Market?
Key companies in the market include Hubbell Incorporated*List Not Exhaustive, ABB Ltd, Nexans SA, Toshiba Corporation, Bharat Heavy Electricals Limited, CG Power and Industrial Solutions Limited, Siemens AG, Eaton Corporation PLC, General Electric Company.
3. What are the main segments of the Asia-Pacific Electrical Bushing Market?
The market segments include Type, Application, Geography.
4. Can you provide details about the market size?
The market size is estimated to be USD XX Million as of 2022.
5. What are some drivers contributing to market growth?
Replacement of Existing Grids and the Expansion of Distribution Networks.
6. What are the notable trends driving market growth?
Transformer Application to Witness Significant Growth.
7. Are there any restraints impacting market growth?
High Installation Costs.
8. Can you provide examples of recent developments in the market?
Hitachi Energy India Ltd., in May 2022, inaugurated its new transformer components factory in Vadodara, Gujarat. Located in its largest manufacturing location in India, this factory will produce dry bushings with the most reliable technology called 'Resin Impregnated Paper. This will be the first manufacturing facility in India to produce Resin Impregnated Paper bushings up to 400 kV voltage level. This dry technology improves transformer bushings' thermal, electrical, and mechanical performance, making them more resilient and reliable - critical in transformers deployed in the power grid.
9. What pricing options are available for accessing the report?
Pricing options include single-user, multi-user, and enterprise licenses priced at USD 4750, USD 5250, and USD 8750 respectively.
10. Is the market size provided in terms of value or volume?
The market size is provided in terms of value, measured in Million and volume, measured in K Unit.
11. Are there any specific market keywords associated with the report?
Yes, the market keyword associated with the report is "Asia-Pacific Electrical Bushing Market," which aids in identifying and referencing the specific market segment covered.
12. How do I determine which pricing option suits my needs best?
The pricing options vary based on user requirements and access needs. Individual users may opt for single-user licenses, while businesses requiring broader access may choose multi-user or enterprise licenses for cost-effective access to the report.
13. Are there any additional resources or data provided in the Asia-Pacific Electrical Bushing Market report?
While the report offers comprehensive insights, it's advisable to review the specific contents or supplementary materials provided to ascertain if additional resources or data are available.
14. How can I stay updated on further developments or reports in the Asia-Pacific Electrical Bushing Market?
To stay informed about further developments, trends, and reports in the Asia-Pacific Electrical Bushing Market, consider subscribing to industry newsletters, following relevant companies and organizations, or regularly checking reputable industry news sources and publications.
Methodology
Step 1 - Identification of Relevant Samples Size from Population Database


Step 2 - Approaches for Defining Global Market Size (Value, Volume* & Price*)

Note*: In applicable scenarios
Step 3 - Data Sources
Primary Research
- Web Analytics
- Survey Reports
- Research Institute
- Latest Research Reports
- Opinion Leaders
Secondary Research
- Annual Reports
- White Paper
- Latest Press Release
- Industry Association
- Paid Database
- Investor Presentations

Step 4 - Data Triangulation
Involves using different sources of information in order to increase the validity of a study
These sources are likely to be stakeholders in a program - participants, other researchers, program staff, other community members, and so on.
Then we put all data in single framework & apply various statistical tools to find out the dynamic on the market.
During the analysis stage, feedback from the stakeholder groups would be compared to determine areas of agreement as well as areas of divergence


