
Key Insights
The ASEAN Power EPC (Engineering, Procurement, and Construction) market is experiencing robust growth, driven by increasing energy demand fueled by rapid economic development and urbanization across the region. A CAGR exceeding 6% from 2019 to 2024 indicates a significant market expansion. This growth is propelled by substantial investments in renewable energy sources, particularly solar and wind power, to meet sustainability goals and diversify energy portfolios. Governments across ASEAN are actively promoting renewable energy adoption through supportive policies, incentives, and regulatory frameworks, further stimulating market expansion. While conventional thermal power plants still constitute a significant segment, the shift towards renewables is undeniable, creating opportunities for EPC companies specializing in solar, wind, and hybrid power projects. The robust infrastructure development plans within ASEAN nations also contribute to the market's expansion, generating demand for transmission and distribution network upgrades. However, challenges remain, including potential supply chain disruptions, skilled labor shortages, and fluctuating commodity prices, which could impact project timelines and profitability for EPC firms.
The competitive landscape is characterized by a mix of international and regional EPC players. Major international companies with extensive experience bring technological expertise and financial strength, while local players possess strong regional market knowledge and established relationships. Competition is likely to intensify as more companies enter the market, attracting investment and fostering innovation. The market's future growth trajectory hinges on the consistent implementation of government policies supporting renewable energy, the continued development of robust infrastructure, and the effective management of potential challenges related to resource availability and skilled workforce development. The successful navigation of these factors will be crucial in determining the long-term potential of the ASEAN Power EPC market. Focusing on sustainable solutions, digital technologies, and efficient project management will be key success factors for EPC companies in this dynamic market.
This comprehensive report provides an in-depth analysis of the ASEAN Power Engineering, Procurement, and Construction (EPC) market, encompassing historical data (2019-2024), current market size (2025), and future projections (2025-2033). It offers invaluable insights into market dynamics, growth trends, key players, and emerging opportunities within the parent market of ASEAN Infrastructure and the child market of Power Generation. The report covers key segments including Conventional Thermal Power, Renewables Power, and Nuclear Power, offering a granular view of the sector's evolution. With a detailed examination of market size (in Million units), CAGR, and key industry developments, this report is essential for investors, EPC companies, and industry professionals seeking to navigate this dynamic market.
ASEAN Power EPC Market Dynamics & Structure
The ASEAN Power EPC market exhibits a moderately concentrated structure, with several multinational corporations and regional players vying for market share. Technological innovation, particularly in renewable energy sources, is a key driver. Stringent regulatory frameworks focusing on sustainability and energy security shape the market landscape. The rise of renewable energy sources presents a competitive substitute to conventional thermal power. End-user demographics, including a rapidly growing population and increasing industrialization, fuel demand. M&A activity is expected to remain significant, driven by companies' efforts to consolidate market presence and gain access to new technologies.
- Market Concentration: Moderate, with a few dominant players and numerous smaller regional contractors. xx% market share held by the top 5 players in 2025 (estimated).
- Technological Innovation: Strong focus on renewable energy (solar, wind, hydro), smart grids, and energy storage solutions. Barriers to innovation include high upfront costs and limited access to advanced technologies in some ASEAN countries.
- Regulatory Frameworks: Vary across countries, but a general trend towards stricter environmental regulations and promotion of renewable energy sources.
- Competitive Product Substitutes: Renewable energy technologies are increasingly competitive with conventional thermal power, driving market transformation.
- End-User Demographics: Growing population and industrialization are increasing electricity demand. Urbanization also presents significant infrastructure development opportunities.
- M&A Trends: Consolidation expected through acquisitions and mergers to enhance market share and technological capabilities. xx M&A deals predicted in the forecast period.
ASEAN Power EPC Market Growth Trends & Insights
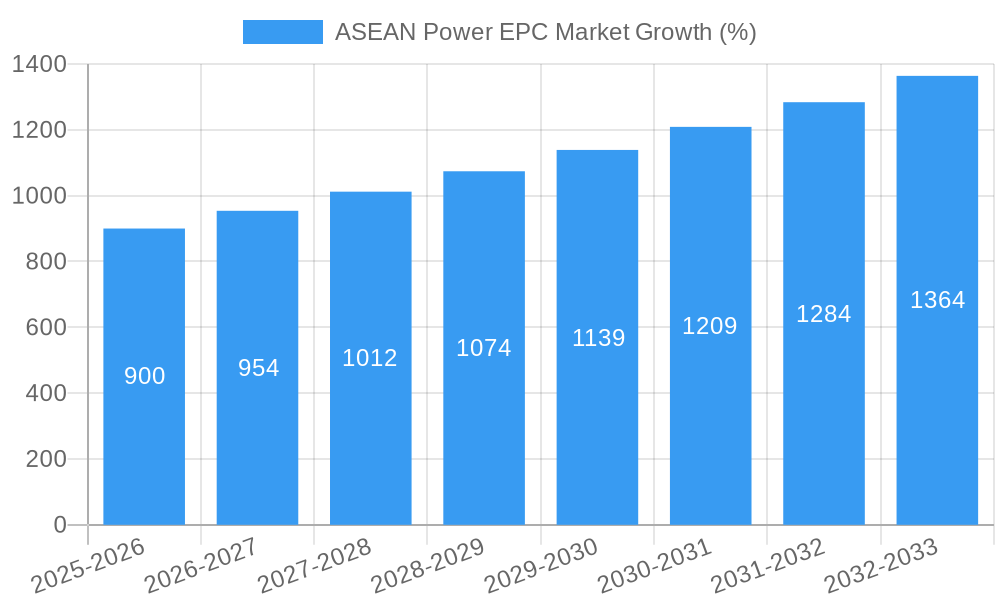
The ASEAN Power EPC market is experiencing robust growth, driven by increasing energy demand, infrastructure development, and government support for renewable energy. The market size has experienced significant growth in recent years. The CAGR from 2019 to 2024 was xx%, with the market size in 2025 estimated at xx Million units. This growth is fueled by rising adoption rates of renewable energy technologies, technological disruptions such as advanced energy storage, and shifting consumer behavior toward sustainability. Factors impacting growth include government policies promoting renewable energy and energy efficiency, investments in grid infrastructure, and increasing private sector participation. Market penetration of renewables is steadily increasing, with xx% market share projected in 2033 (estimated).
Dominant Regions, Countries, or Segments in ASEAN Power EPC Market
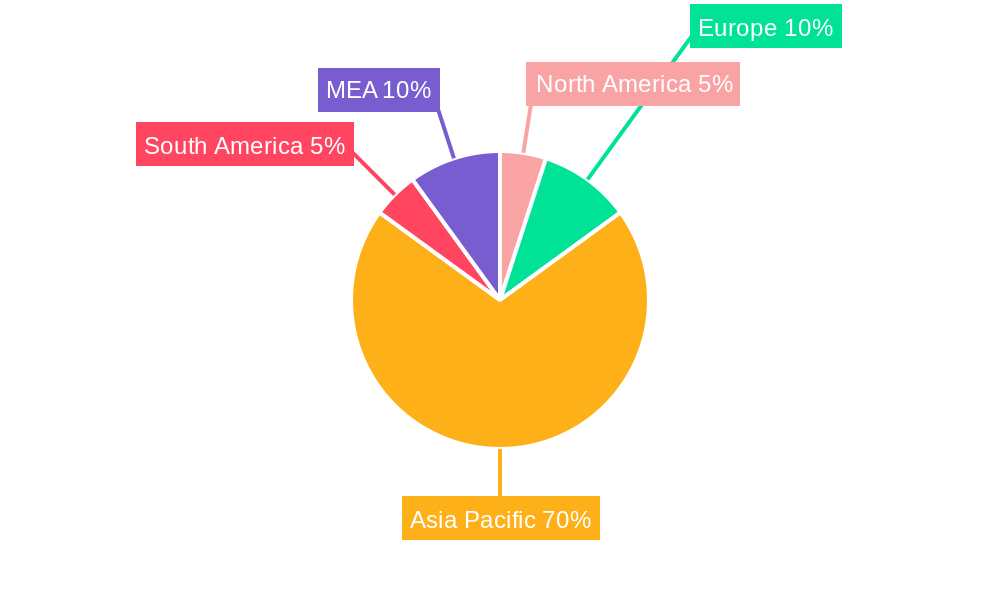
Indonesia, Vietnam, and the Philippines are the leading countries in the ASEAN Power EPC market, driven by strong economic growth and substantial investments in power generation capacity. The renewable energy segment is emerging as a major driver of growth, propelled by government initiatives and favorable environmental policies.
- Indonesia: Strong growth driven by large-scale infrastructure projects, a rapidly growing population, and increasing industrial activity. Significant investments in gas-fired power plants and renewable energy projects are fueling market expansion.
- Vietnam: High economic growth and rising energy demand are driving investment in power generation, with a focus on coal, gas, and renewable energy sources.
- Philippines: A robust pipeline of renewable energy projects, particularly solar and wind, is driving the market. Government support and private sector investments are fostering market expansion.
- Conventional Thermal Power: Remains a significant segment but faces pressure from rising renewable energy adoption and environmental regulations.
- Renewables Power: Experiencing the fastest growth, driven by decreasing costs of solar and wind technologies, supportive government policies, and increasing environmental awareness.
- Nuclear Power: Limited presence currently, but potential for future growth in select countries.
ASEAN Power EPC Market Product Landscape
The ASEAN Power EPC market offers a diverse product landscape, encompassing conventional thermal power plants, renewable energy projects (solar, wind, hydro, biomass), and combined cycle power plants. Advanced technologies such as smart grids and energy storage solutions are increasingly integrated into projects. Key performance indicators include efficiency, reliability, cost-effectiveness, and environmental impact. Unique selling propositions include turnkey solutions, advanced project management, and localized expertise. Technological advancements focus on improving efficiency, reducing environmental impact, and increasing energy security.
Key Drivers, Barriers & Challenges in ASEAN Power EPC Market
Key Drivers:
- Increasing energy demand driven by economic growth and population increase.
- Government support for renewable energy and infrastructure development.
- Decreasing costs of renewable energy technologies.
- Investments in grid modernization and expansion.
Key Challenges and Restraints:
- Regulatory complexities and inconsistent policies across ASEAN countries. (Quantifiable impact: xx% project delays due to regulatory hurdles).
- Dependence on imported equipment and technologies. (Quantifiable impact: xx% increased project costs due to import reliance).
- Competition from established international EPC players. (Quantifiable impact: pressure on pricing and profit margins).
- Skilled labor shortages in certain areas. (Quantifiable impact: xx% project delays due to workforce limitations).
Emerging Opportunities in ASEAN Power EPC Market
- Expansion of renewable energy projects, especially solar and wind.
- Development of smart grids and energy storage solutions.
- Growth in decentralized power generation and microgrids.
- Increasing demand for energy efficiency upgrades and retrofits.
- Opportunities in cross-border energy projects and regional cooperation.
Growth Accelerators in the ASEAN Power EPC Market Industry
The long-term growth of the ASEAN Power EPC market will be fueled by technological advancements in renewable energy, strategic partnerships between international and local companies, and the expansion of regional energy markets. Increased investment in grid infrastructure, further governmental support for renewable energy transition, and the implementation of smart grid technologies will also significantly accelerate market growth.
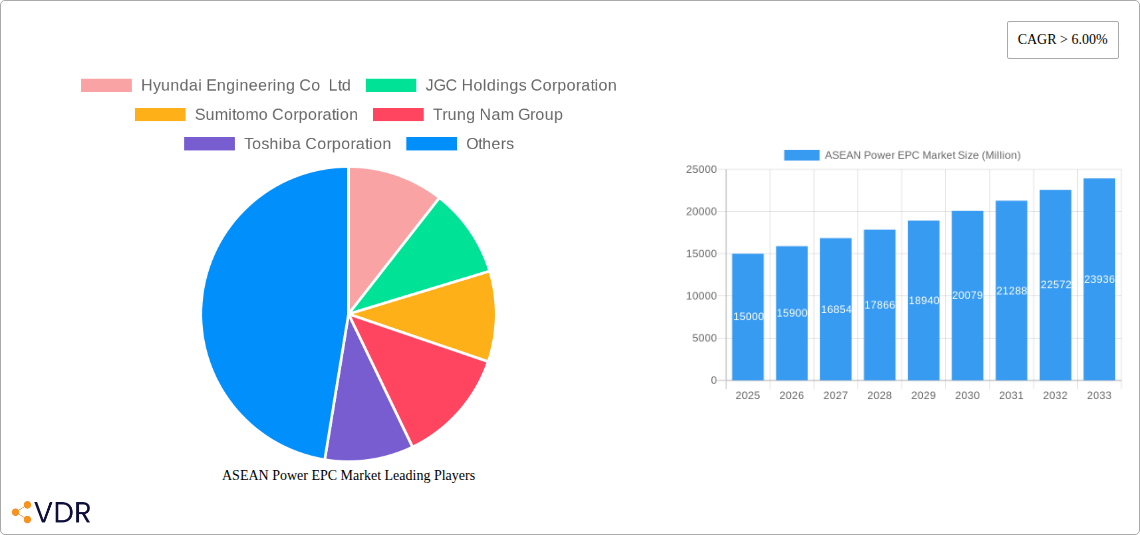
Key Players Shaping the ASEAN Power EPC Market Market
- Hyundai Engineering Co Ltd
- JGC Holdings Corporation
- Sumitomo Corporation
- Trung Nam Group
- Toshiba Corporation
- Doosan Heavy Industries & Construction Co Ltd
- Indika Energy
- Kawasaki Heavy Industries Ltd
- IHI Corporation
- Mitsubishi Heavy Industries Ltd
Notable Milestones in ASEAN Power EPC Market Sector
- December 2021: Solar Philippines Nueva Ecija Corporation (SPNEC) begins construction of a 500 MW solar PV facility in the Philippines.
- October 2021: Mitsubishi Power commissions a 500 MW natural gas turbine in Indonesia's Muara Karang Power Plant.
- March 2022: San Miguel Corp. plans to build two gas-fired power stations in the central Philippines (total capacity 1050 MW).
In-Depth ASEAN Power EPC Market Market Outlook
The ASEAN Power EPC market is poised for significant growth in the coming years, driven by a confluence of factors. Continued investment in renewable energy infrastructure, coupled with technological advancements and supportive government policies, will create substantial opportunities for EPC companies. The expansion of regional energy grids and cross-border energy trade will further stimulate market expansion. Strategic partnerships and collaborations will be crucial for players seeking to capitalize on this growth potential. The market outlook is highly positive, with significant potential for expansion across all major segments.
ASEAN Power EPC Market Segmentation
-
1. Source
- 1.1. Conventional Thermal Power
- 1.2. Renewables Power
- 1.3. Nuclear Power
-
2. Geography
- 2.1. Indonesia
- 2.2. Thailand
- 2.3. Malaysia
- 2.4. Vietnam
- 2.5. Philippines
- 2.6. Rest of the ASEAN Countries
ASEAN Power EPC Market Segmentation By Geography
- 1. Indonesia
- 2. Thailand
- 3. Malaysia
- 4. Vietnam
- 5. Philippines
- 6. Rest of the ASEAN Countries
ASEAN Power EPC Market REPORT HIGHLIGHTS
| Aspects | Details |
|---|---|
| Study Period | 2019-2033 |
| Base Year | 2024 |
| Estimated Year | 2025 |
| Forecast Period | 2025-2033 |
| Historical Period | 2019-2024 |
| Growth Rate | CAGR of > 6.00% from 2019-2033 |
| Segmentation |
|
Table of Contents
- 1. Introduction
- 1.1. Research Scope
- 1.2. Market Segmentation
- 1.3. Research Methodology
- 1.4. Definitions and Assumptions
- 2. Executive Summary
- 2.1. Introduction
- 3. Market Dynamics
- 3.1. Introduction
- 3.2. Market Drivers
- 3.2.1. 4.; Uninterrupted and Reliable Power Supply and Heavy Deployment of DG (diesel generator) Set4.; Improvement in Technology of Diesel Generator
- 3.3. Market Restrains
- 3.3.1. 4.; The Growing Trend of Renewable Power Generation
- 3.4. Market Trends
- 3.4.1. Renewables Power Source to Witness Significant Growth
- 4. Market Factor Analysis
- 4.1. Porters Five Forces
- 4.2. Supply/Value Chain
- 4.3. PESTEL analysis
- 4.4. Market Entropy
- 4.5. Patent/Trademark Analysis
- 5. Global ASEAN Power EPC Market Analysis, Insights and Forecast, 2019-2031
- 5.1. Market Analysis, Insights and Forecast - by Source
- 5.1.1. Conventional Thermal Power
- 5.1.2. Renewables Power
- 5.1.3. Nuclear Power
- 5.2. Market Analysis, Insights and Forecast - by Geography
- 5.2.1. Indonesia
- 5.2.2. Thailand
- 5.2.3. Malaysia
- 5.2.4. Vietnam
- 5.2.5. Philippines
- 5.2.6. Rest of the ASEAN Countries
- 5.3. Market Analysis, Insights and Forecast - by Region
- 5.3.1. Indonesia
- 5.3.2. Thailand
- 5.3.3. Malaysia
- 5.3.4. Vietnam
- 5.3.5. Philippines
- 5.3.6. Rest of the ASEAN Countries
- 5.1. Market Analysis, Insights and Forecast - by Source
- 6. Indonesia ASEAN Power EPC Market Analysis, Insights and Forecast, 2019-2031
- 6.1. Market Analysis, Insights and Forecast - by Source
- 6.1.1. Conventional Thermal Power
- 6.1.2. Renewables Power
- 6.1.3. Nuclear Power
- 6.2. Market Analysis, Insights and Forecast - by Geography
- 6.2.1. Indonesia
- 6.2.2. Thailand
- 6.2.3. Malaysia
- 6.2.4. Vietnam
- 6.2.5. Philippines
- 6.2.6. Rest of the ASEAN Countries
- 6.1. Market Analysis, Insights and Forecast - by Source
- 7. Thailand ASEAN Power EPC Market Analysis, Insights and Forecast, 2019-2031
- 7.1. Market Analysis, Insights and Forecast - by Source
- 7.1.1. Conventional Thermal Power
- 7.1.2. Renewables Power
- 7.1.3. Nuclear Power
- 7.2. Market Analysis, Insights and Forecast - by Geography
- 7.2.1. Indonesia
- 7.2.2. Thailand
- 7.2.3. Malaysia
- 7.2.4. Vietnam
- 7.2.5. Philippines
- 7.2.6. Rest of the ASEAN Countries
- 7.1. Market Analysis, Insights and Forecast - by Source
- 8. Malaysia ASEAN Power EPC Market Analysis, Insights and Forecast, 2019-2031
- 8.1. Market Analysis, Insights and Forecast - by Source
- 8.1.1. Conventional Thermal Power
- 8.1.2. Renewables Power
- 8.1.3. Nuclear Power
- 8.2. Market Analysis, Insights and Forecast - by Geography
- 8.2.1. Indonesia
- 8.2.2. Thailand
- 8.2.3. Malaysia
- 8.2.4. Vietnam
- 8.2.5. Philippines
- 8.2.6. Rest of the ASEAN Countries
- 8.1. Market Analysis, Insights and Forecast - by Source
- 9. Vietnam ASEAN Power EPC Market Analysis, Insights and Forecast, 2019-2031
- 9.1. Market Analysis, Insights and Forecast - by Source
- 9.1.1. Conventional Thermal Power
- 9.1.2. Renewables Power
- 9.1.3. Nuclear Power
- 9.2. Market Analysis, Insights and Forecast - by Geography
- 9.2.1. Indonesia
- 9.2.2. Thailand
- 9.2.3. Malaysia
- 9.2.4. Vietnam
- 9.2.5. Philippines
- 9.2.6. Rest of the ASEAN Countries
- 9.1. Market Analysis, Insights and Forecast - by Source
- 10. Philippines ASEAN Power EPC Market Analysis, Insights and Forecast, 2019-2031
- 10.1. Market Analysis, Insights and Forecast - by Source
- 10.1.1. Conventional Thermal Power
- 10.1.2. Renewables Power
- 10.1.3. Nuclear Power
- 10.2. Market Analysis, Insights and Forecast - by Geography
- 10.2.1. Indonesia
- 10.2.2. Thailand
- 10.2.3. Malaysia
- 10.2.4. Vietnam
- 10.2.5. Philippines
- 10.2.6. Rest of the ASEAN Countries
- 10.1. Market Analysis, Insights and Forecast - by Source
- 11. Rest of the ASEAN Countries ASEAN Power EPC Market Analysis, Insights and Forecast, 2019-2031
- 11.1. Market Analysis, Insights and Forecast - by Source
- 11.1.1. Conventional Thermal Power
- 11.1.2. Renewables Power
- 11.1.3. Nuclear Power
- 11.2. Market Analysis, Insights and Forecast - by Geography
- 11.2.1. Indonesia
- 11.2.2. Thailand
- 11.2.3. Malaysia
- 11.2.4. Vietnam
- 11.2.5. Philippines
- 11.2.6. Rest of the ASEAN Countries
- 11.1. Market Analysis, Insights and Forecast - by Source
- 12. North America ASEAN Power EPC Market Analysis, Insights and Forecast, 2019-2031
- 12.1. Market Analysis, Insights and Forecast - By Country/Sub-region
- 12.1.1 United States
- 12.1.2 Canada
- 12.1.3 Mexico
- 13. Europe ASEAN Power EPC Market Analysis, Insights and Forecast, 2019-2031
- 13.1. Market Analysis, Insights and Forecast - By Country/Sub-region
- 13.1.1 Germany
- 13.1.2 United Kingdom
- 13.1.3 France
- 13.1.4 Spain
- 13.1.5 Italy
- 13.1.6 Spain
- 13.1.7 Belgium
- 13.1.8 Netherland
- 13.1.9 Nordics
- 13.1.10 Rest of Europe
- 14. Asia Pacific ASEAN Power EPC Market Analysis, Insights and Forecast, 2019-2031
- 14.1. Market Analysis, Insights and Forecast - By Country/Sub-region
- 14.1.1 China
- 14.1.2 Japan
- 14.1.3 India
- 14.1.4 South Korea
- 14.1.5 Southeast Asia
- 14.1.6 Australia
- 14.1.7 Indonesia
- 14.1.8 Phillipes
- 14.1.9 Singapore
- 14.1.10 Thailandc
- 14.1.11 Rest of Asia Pacific
- 15. South America ASEAN Power EPC Market Analysis, Insights and Forecast, 2019-2031
- 15.1. Market Analysis, Insights and Forecast - By Country/Sub-region
- 15.1.1 Brazil
- 15.1.2 Argentina
- 15.1.3 Peru
- 15.1.4 Chile
- 15.1.5 Colombia
- 15.1.6 Ecuador
- 15.1.7 Venezuela
- 15.1.8 Rest of South America
- 16. MEA ASEAN Power EPC Market Analysis, Insights and Forecast, 2019-2031
- 16.1. Market Analysis, Insights and Forecast - By Country/Sub-region
- 16.1.1 United Arab Emirates
- 16.1.2 Saudi Arabia
- 16.1.3 South Africa
- 16.1.4 Rest of Middle East and Africa
- 17. Competitive Analysis
- 17.1. Global Market Share Analysis 2024
- 17.2. Company Profiles
- 17.2.1 Hyundai Engineering Co Ltd
- 17.2.1.1. Overview
- 17.2.1.2. Products
- 17.2.1.3. SWOT Analysis
- 17.2.1.4. Recent Developments
- 17.2.1.5. Financials (Based on Availability)
- 17.2.2 JGC Holdings Corporation
- 17.2.2.1. Overview
- 17.2.2.2. Products
- 17.2.2.3. SWOT Analysis
- 17.2.2.4. Recent Developments
- 17.2.2.5. Financials (Based on Availability)
- 17.2.3 Sumitomo Corporation
- 17.2.3.1. Overview
- 17.2.3.2. Products
- 17.2.3.3. SWOT Analysis
- 17.2.3.4. Recent Developments
- 17.2.3.5. Financials (Based on Availability)
- 17.2.4 Trung Nam Group
- 17.2.4.1. Overview
- 17.2.4.2. Products
- 17.2.4.3. SWOT Analysis
- 17.2.4.4. Recent Developments
- 17.2.4.5. Financials (Based on Availability)
- 17.2.5 Toshiba Corporation
- 17.2.5.1. Overview
- 17.2.5.2. Products
- 17.2.5.3. SWOT Analysis
- 17.2.5.4. Recent Developments
- 17.2.5.5. Financials (Based on Availability)
- 17.2.6 Doosan Heavy Industries & Construction Co Ltd
- 17.2.6.1. Overview
- 17.2.6.2. Products
- 17.2.6.3. SWOT Analysis
- 17.2.6.4. Recent Developments
- 17.2.6.5. Financials (Based on Availability)
- 17.2.7 Indika Energy
- 17.2.7.1. Overview
- 17.2.7.2. Products
- 17.2.7.3. SWOT Analysis
- 17.2.7.4. Recent Developments
- 17.2.7.5. Financials (Based on Availability)
- 17.2.8 Kawasaki Heavy Industries Ltd
- 17.2.8.1. Overview
- 17.2.8.2. Products
- 17.2.8.3. SWOT Analysis
- 17.2.8.4. Recent Developments
- 17.2.8.5. Financials (Based on Availability)
- 17.2.9 IHI Corporation
- 17.2.9.1. Overview
- 17.2.9.2. Products
- 17.2.9.3. SWOT Analysis
- 17.2.9.4. Recent Developments
- 17.2.9.5. Financials (Based on Availability)
- 17.2.10 Mitsubishi Heavy Industries Ltd
- 17.2.10.1. Overview
- 17.2.10.2. Products
- 17.2.10.3. SWOT Analysis
- 17.2.10.4. Recent Developments
- 17.2.10.5. Financials (Based on Availability)
- 17.2.1 Hyundai Engineering Co Ltd
List of Figures
- Figure 1: Global ASEAN Power EPC Market Revenue Breakdown (Million, %) by Region 2024 & 2032
- Figure 2: North America ASEAN Power EPC Market Revenue (Million), by Country 2024 & 2032
- Figure 3: North America ASEAN Power EPC Market Revenue Share (%), by Country 2024 & 2032
- Figure 4: Europe ASEAN Power EPC Market Revenue (Million), by Country 2024 & 2032
- Figure 5: Europe ASEAN Power EPC Market Revenue Share (%), by Country 2024 & 2032
- Figure 6: Asia Pacific ASEAN Power EPC Market Revenue (Million), by Country 2024 & 2032
- Figure 7: Asia Pacific ASEAN Power EPC Market Revenue Share (%), by Country 2024 & 2032
- Figure 8: South America ASEAN Power EPC Market Revenue (Million), by Country 2024 & 2032
- Figure 9: South America ASEAN Power EPC Market Revenue Share (%), by Country 2024 & 2032
- Figure 10: MEA ASEAN Power EPC Market Revenue (Million), by Country 2024 & 2032
- Figure 11: MEA ASEAN Power EPC Market Revenue Share (%), by Country 2024 & 2032
- Figure 12: Indonesia ASEAN Power EPC Market Revenue (Million), by Source 2024 & 2032
- Figure 13: Indonesia ASEAN Power EPC Market Revenue Share (%), by Source 2024 & 2032
- Figure 14: Indonesia ASEAN Power EPC Market Revenue (Million), by Geography 2024 & 2032
- Figure 15: Indonesia ASEAN Power EPC Market Revenue Share (%), by Geography 2024 & 2032
- Figure 16: Indonesia ASEAN Power EPC Market Revenue (Million), by Country 2024 & 2032
- Figure 17: Indonesia ASEAN Power EPC Market Revenue Share (%), by Country 2024 & 2032
- Figure 18: Thailand ASEAN Power EPC Market Revenue (Million), by Source 2024 & 2032
- Figure 19: Thailand ASEAN Power EPC Market Revenue Share (%), by Source 2024 & 2032
- Figure 20: Thailand ASEAN Power EPC Market Revenue (Million), by Geography 2024 & 2032
- Figure 21: Thailand ASEAN Power EPC Market Revenue Share (%), by Geography 2024 & 2032
- Figure 22: Thailand ASEAN Power EPC Market Revenue (Million), by Country 2024 & 2032
- Figure 23: Thailand ASEAN Power EPC Market Revenue Share (%), by Country 2024 & 2032
- Figure 24: Malaysia ASEAN Power EPC Market Revenue (Million), by Source 2024 & 2032
- Figure 25: Malaysia ASEAN Power EPC Market Revenue Share (%), by Source 2024 & 2032
- Figure 26: Malaysia ASEAN Power EPC Market Revenue (Million), by Geography 2024 & 2032
- Figure 27: Malaysia ASEAN Power EPC Market Revenue Share (%), by Geography 2024 & 2032
- Figure 28: Malaysia ASEAN Power EPC Market Revenue (Million), by Country 2024 & 2032
- Figure 29: Malaysia ASEAN Power EPC Market Revenue Share (%), by Country 2024 & 2032
- Figure 30: Vietnam ASEAN Power EPC Market Revenue (Million), by Source 2024 & 2032
- Figure 31: Vietnam ASEAN Power EPC Market Revenue Share (%), by Source 2024 & 2032
- Figure 32: Vietnam ASEAN Power EPC Market Revenue (Million), by Geography 2024 & 2032
- Figure 33: Vietnam ASEAN Power EPC Market Revenue Share (%), by Geography 2024 & 2032
- Figure 34: Vietnam ASEAN Power EPC Market Revenue (Million), by Country 2024 & 2032
- Figure 35: Vietnam ASEAN Power EPC Market Revenue Share (%), by Country 2024 & 2032
- Figure 36: Philippines ASEAN Power EPC Market Revenue (Million), by Source 2024 & 2032
- Figure 37: Philippines ASEAN Power EPC Market Revenue Share (%), by Source 2024 & 2032
- Figure 38: Philippines ASEAN Power EPC Market Revenue (Million), by Geography 2024 & 2032
- Figure 39: Philippines ASEAN Power EPC Market Revenue Share (%), by Geography 2024 & 2032
- Figure 40: Philippines ASEAN Power EPC Market Revenue (Million), by Country 2024 & 2032
- Figure 41: Philippines ASEAN Power EPC Market Revenue Share (%), by Country 2024 & 2032
- Figure 42: Rest of the ASEAN Countries ASEAN Power EPC Market Revenue (Million), by Source 2024 & 2032
- Figure 43: Rest of the ASEAN Countries ASEAN Power EPC Market Revenue Share (%), by Source 2024 & 2032
- Figure 44: Rest of the ASEAN Countries ASEAN Power EPC Market Revenue (Million), by Geography 2024 & 2032
- Figure 45: Rest of the ASEAN Countries ASEAN Power EPC Market Revenue Share (%), by Geography 2024 & 2032
- Figure 46: Rest of the ASEAN Countries ASEAN Power EPC Market Revenue (Million), by Country 2024 & 2032
- Figure 47: Rest of the ASEAN Countries ASEAN Power EPC Market Revenue Share (%), by Country 2024 & 2032
List of Tables
- Table 1: Global ASEAN Power EPC Market Revenue Million Forecast, by Region 2019 & 2032
- Table 2: Global ASEAN Power EPC Market Revenue Million Forecast, by Source 2019 & 2032
- Table 3: Global ASEAN Power EPC Market Revenue Million Forecast, by Geography 2019 & 2032
- Table 4: Global ASEAN Power EPC Market Revenue Million Forecast, by Region 2019 & 2032
- Table 5: Global ASEAN Power EPC Market Revenue Million Forecast, by Country 2019 & 2032
- Table 6: United States ASEAN Power EPC Market Revenue (Million) Forecast, by Application 2019 & 2032
- Table 7: Canada ASEAN Power EPC Market Revenue (Million) Forecast, by Application 2019 & 2032
- Table 8: Mexico ASEAN Power EPC Market Revenue (Million) Forecast, by Application 2019 & 2032
- Table 9: Global ASEAN Power EPC Market Revenue Million Forecast, by Country 2019 & 2032
- Table 10: Germany ASEAN Power EPC Market Revenue (Million) Forecast, by Application 2019 & 2032
- Table 11: United Kingdom ASEAN Power EPC Market Revenue (Million) Forecast, by Application 2019 & 2032
- Table 12: France ASEAN Power EPC Market Revenue (Million) Forecast, by Application 2019 & 2032
- Table 13: Spain ASEAN Power EPC Market Revenue (Million) Forecast, by Application 2019 & 2032
- Table 14: Italy ASEAN Power EPC Market Revenue (Million) Forecast, by Application 2019 & 2032
- Table 15: Spain ASEAN Power EPC Market Revenue (Million) Forecast, by Application 2019 & 2032
- Table 16: Belgium ASEAN Power EPC Market Revenue (Million) Forecast, by Application 2019 & 2032
- Table 17: Netherland ASEAN Power EPC Market Revenue (Million) Forecast, by Application 2019 & 2032
- Table 18: Nordics ASEAN Power EPC Market Revenue (Million) Forecast, by Application 2019 & 2032
- Table 19: Rest of Europe ASEAN Power EPC Market Revenue (Million) Forecast, by Application 2019 & 2032
- Table 20: Global ASEAN Power EPC Market Revenue Million Forecast, by Country 2019 & 2032
- Table 21: China ASEAN Power EPC Market Revenue (Million) Forecast, by Application 2019 & 2032
- Table 22: Japan ASEAN Power EPC Market Revenue (Million) Forecast, by Application 2019 & 2032
- Table 23: India ASEAN Power EPC Market Revenue (Million) Forecast, by Application 2019 & 2032
- Table 24: South Korea ASEAN Power EPC Market Revenue (Million) Forecast, by Application 2019 & 2032
- Table 25: Southeast Asia ASEAN Power EPC Market Revenue (Million) Forecast, by Application 2019 & 2032
- Table 26: Australia ASEAN Power EPC Market Revenue (Million) Forecast, by Application 2019 & 2032
- Table 27: Indonesia ASEAN Power EPC Market Revenue (Million) Forecast, by Application 2019 & 2032
- Table 28: Phillipes ASEAN Power EPC Market Revenue (Million) Forecast, by Application 2019 & 2032
- Table 29: Singapore ASEAN Power EPC Market Revenue (Million) Forecast, by Application 2019 & 2032
- Table 30: Thailandc ASEAN Power EPC Market Revenue (Million) Forecast, by Application 2019 & 2032
- Table 31: Rest of Asia Pacific ASEAN Power EPC Market Revenue (Million) Forecast, by Application 2019 & 2032
- Table 32: Global ASEAN Power EPC Market Revenue Million Forecast, by Country 2019 & 2032
- Table 33: Brazil ASEAN Power EPC Market Revenue (Million) Forecast, by Application 2019 & 2032
- Table 34: Argentina ASEAN Power EPC Market Revenue (Million) Forecast, by Application 2019 & 2032
- Table 35: Peru ASEAN Power EPC Market Revenue (Million) Forecast, by Application 2019 & 2032
- Table 36: Chile ASEAN Power EPC Market Revenue (Million) Forecast, by Application 2019 & 2032
- Table 37: Colombia ASEAN Power EPC Market Revenue (Million) Forecast, by Application 2019 & 2032
- Table 38: Ecuador ASEAN Power EPC Market Revenue (Million) Forecast, by Application 2019 & 2032
- Table 39: Venezuela ASEAN Power EPC Market Revenue (Million) Forecast, by Application 2019 & 2032
- Table 40: Rest of South America ASEAN Power EPC Market Revenue (Million) Forecast, by Application 2019 & 2032
- Table 41: Global ASEAN Power EPC Market Revenue Million Forecast, by Country 2019 & 2032
- Table 42: United Arab Emirates ASEAN Power EPC Market Revenue (Million) Forecast, by Application 2019 & 2032
- Table 43: Saudi Arabia ASEAN Power EPC Market Revenue (Million) Forecast, by Application 2019 & 2032
- Table 44: South Africa ASEAN Power EPC Market Revenue (Million) Forecast, by Application 2019 & 2032
- Table 45: Rest of Middle East and Africa ASEAN Power EPC Market Revenue (Million) Forecast, by Application 2019 & 2032
- Table 46: Global ASEAN Power EPC Market Revenue Million Forecast, by Source 2019 & 2032
- Table 47: Global ASEAN Power EPC Market Revenue Million Forecast, by Geography 2019 & 2032
- Table 48: Global ASEAN Power EPC Market Revenue Million Forecast, by Country 2019 & 2032
- Table 49: Global ASEAN Power EPC Market Revenue Million Forecast, by Source 2019 & 2032
- Table 50: Global ASEAN Power EPC Market Revenue Million Forecast, by Geography 2019 & 2032
- Table 51: Global ASEAN Power EPC Market Revenue Million Forecast, by Country 2019 & 2032
- Table 52: Global ASEAN Power EPC Market Revenue Million Forecast, by Source 2019 & 2032
- Table 53: Global ASEAN Power EPC Market Revenue Million Forecast, by Geography 2019 & 2032
- Table 54: Global ASEAN Power EPC Market Revenue Million Forecast, by Country 2019 & 2032
- Table 55: Global ASEAN Power EPC Market Revenue Million Forecast, by Source 2019 & 2032
- Table 56: Global ASEAN Power EPC Market Revenue Million Forecast, by Geography 2019 & 2032
- Table 57: Global ASEAN Power EPC Market Revenue Million Forecast, by Country 2019 & 2032
- Table 58: Global ASEAN Power EPC Market Revenue Million Forecast, by Source 2019 & 2032
- Table 59: Global ASEAN Power EPC Market Revenue Million Forecast, by Geography 2019 & 2032
- Table 60: Global ASEAN Power EPC Market Revenue Million Forecast, by Country 2019 & 2032
- Table 61: Global ASEAN Power EPC Market Revenue Million Forecast, by Source 2019 & 2032
- Table 62: Global ASEAN Power EPC Market Revenue Million Forecast, by Geography 2019 & 2032
- Table 63: Global ASEAN Power EPC Market Revenue Million Forecast, by Country 2019 & 2032
Frequently Asked Questions
1. What is the projected Compound Annual Growth Rate (CAGR) of the ASEAN Power EPC Market?
The projected CAGR is approximately > 6.00%.
2. Which companies are prominent players in the ASEAN Power EPC Market?
Key companies in the market include Hyundai Engineering Co Ltd, JGC Holdings Corporation, Sumitomo Corporation, Trung Nam Group, Toshiba Corporation, Doosan Heavy Industries & Construction Co Ltd, Indika Energy, Kawasaki Heavy Industries Ltd, IHI Corporation, Mitsubishi Heavy Industries Ltd.
3. What are the main segments of the ASEAN Power EPC Market?
The market segments include Source, Geography.
4. Can you provide details about the market size?
The market size is estimated to be USD XX Million as of 2022.
5. What are some drivers contributing to market growth?
4.; Uninterrupted and Reliable Power Supply and Heavy Deployment of DG (diesel generator) Set4.; Improvement in Technology of Diesel Generator.
6. What are the notable trends driving market growth?
Renewables Power Source to Witness Significant Growth.
7. Are there any restraints impacting market growth?
4.; The Growing Trend of Renewable Power Generation.
8. Can you provide examples of recent developments in the market?
In December 2021, Solar Philippines Nueva Ecija Corporation (SPNEC), a major project developer based in the Philippines, started constructing the first 50 MW unit of a 500 MW solar PV facility. The first 50 MW is planned to be commissioned by the end of 2022 and the rest of the project by 2023.
9. What pricing options are available for accessing the report?
Pricing options include single-user, multi-user, and enterprise licenses priced at USD 4750, USD 5250, and USD 8750 respectively.
10. Is the market size provided in terms of value or volume?
The market size is provided in terms of value, measured in Million.
11. Are there any specific market keywords associated with the report?
Yes, the market keyword associated with the report is "ASEAN Power EPC Market," which aids in identifying and referencing the specific market segment covered.
12. How do I determine which pricing option suits my needs best?
The pricing options vary based on user requirements and access needs. Individual users may opt for single-user licenses, while businesses requiring broader access may choose multi-user or enterprise licenses for cost-effective access to the report.
13. Are there any additional resources or data provided in the ASEAN Power EPC Market report?
While the report offers comprehensive insights, it's advisable to review the specific contents or supplementary materials provided to ascertain if additional resources or data are available.
14. How can I stay updated on further developments or reports in the ASEAN Power EPC Market?
To stay informed about further developments, trends, and reports in the ASEAN Power EPC Market, consider subscribing to industry newsletters, following relevant companies and organizations, or regularly checking reputable industry news sources and publications.
Methodology
Step 1 - Identification of Relevant Samples Size from Population Database


Step 2 - Approaches for Defining Global Market Size (Value, Volume* & Price*)

Note*: In applicable scenarios
Step 3 - Data Sources
Primary Research
- Web Analytics
- Survey Reports
- Research Institute
- Latest Research Reports
- Opinion Leaders
Secondary Research
- Annual Reports
- White Paper
- Latest Press Release
- Industry Association
- Paid Database
- Investor Presentations

Step 4 - Data Triangulation
Involves using different sources of information in order to increase the validity of a study
These sources are likely to be stakeholders in a program - participants, other researchers, program staff, other community members, and so on.
Then we put all data in single framework & apply various statistical tools to find out the dynamic on the market.
During the analysis stage, feedback from the stakeholder groups would be compared to determine areas of agreement as well as areas of divergence


