Areca Nuts Market Market Disruption Trends and Insights

Areca Nuts Market by Production Analysis, by Consumption Analysis, by Import Market Analysis (Value & Volume), by Export Market Analysis (Value & Volume), by Price Trend Analysis, by North America (United States, Canada, Mexico), by Europe (Germany, United Kingdom, Spain, Italy), by Asia Pacific (China, India, Indonesia, Myanmar), by South America (Chile, Brazil), by Africa (South Africa) Forecast 2025-2033

Jun 28 2025
Base Year: 2024

234 Pages
Main Logo

Areca Nuts Market Market Disruption Trends and Insights


Home
Industries
Agriculture
sponsor image

Tailored for you

  • In-depth Analysis Tailored to Specified Regions or Segments
  • Company Profiles Customized to User Preferences
  • Comprehensive Insights Focused on Specific Segments or Regions
  • Customized Evaluation of Competitive Landscape to Meet Your Needs
  • Tailored Customization to Address Other Specific Requirements
Ask for customization


Key Insights

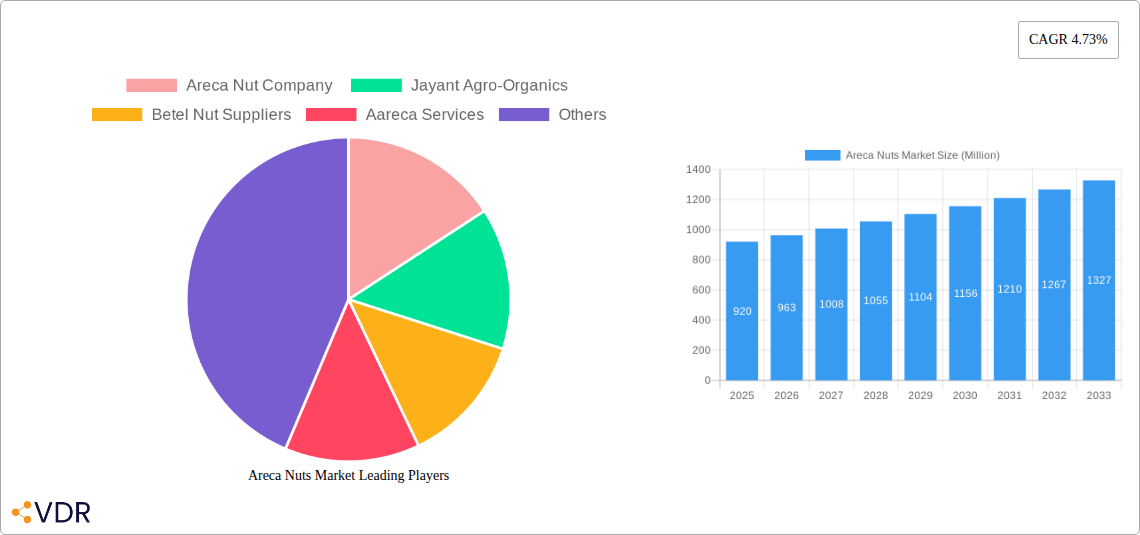
The global areca nut market, valued at $0.92 billion in 2025, is projected to experience robust growth, driven by increasing demand from the food and beverage industry, particularly in Asia-Pacific. The rising popularity of areca nut-based products like chewing mixes and confectionery, coupled with its traditional use in certain cultures, fuels market expansion. Furthermore, the pharmaceutical and personal care sectors are emerging as significant contributors, leveraging areca nut's purported medicinal and cosmetic properties. However, health concerns associated with excessive consumption and stringent regulations regarding its use are anticipated to pose challenges to market growth. The market is segmented by product form (whole nuts, split nuts, powder) and end-use industry, offering varied opportunities for players across the value chain. Growth is expected to be particularly strong in developing economies where consumption habits are deeply ingrained. The competitive landscape comprises both established players and smaller regional businesses, indicating a potential for consolidation and further market evolution in the coming years.

The projected Compound Annual Growth Rate (CAGR) of 4.73% from 2025 to 2033 suggests a steady increase in market value, reaching an estimated $1.4 billion by 2033. This growth will be influenced by factors such as increasing awareness of areca nut's potential health benefits (when consumed in moderation and with proper processing), alongside innovation in product development targeting healthier consumption patterns. Regional variations will exist, with the Asia-Pacific region expected to retain its dominant position owing to strong historical consumption patterns. North America and Europe will exhibit moderate growth, primarily driven by the increasing adoption of areca nut in niche markets like natural food products and dietary supplements. Strategic partnerships, product diversification, and expansion into new geographical markets are crucial for companies seeking to thrive in this dynamic environment.

Areca Nuts Market Research Report - Market Size, Growth & Forecast

Areca Nuts Market: A Comprehensive Report (2019-2033)

This comprehensive report provides a detailed analysis of the Areca Nuts market, offering invaluable insights for industry professionals, investors, and stakeholders. The study covers the period from 2019 to 2033, with 2025 as the base year and a forecast period spanning 2025-2033. The report segments the market by product form (Whole Nuts, Split Nuts, Powder) and end-use industry (Food & Beverages, Pharmaceuticals, Personal Care), providing a granular understanding of market dynamics and growth potential. The market size is presented in Million units.

Areca Nuts Market Dynamics & Structure

The Areca Nuts market exhibits a moderately concentrated structure, with key players holding significant market share. Technological innovation, particularly in processing and extraction techniques, is a key driver. Stringent regulatory frameworks concerning food safety and agricultural practices influence market operations. Competition from substitute products, such as other stimulants or flavoring agents, poses a challenge. End-user demographics, particularly in Asia, significantly influence market demand. M&A activity in the sector has been relatively moderate, with approximately xx deals recorded between 2019 and 2024, resulting in a xx% market share shift among the top 5 players.

  • Market Concentration: Moderately concentrated, with top 5 players holding xx% market share in 2024.
  • Technological Innovation: Focus on efficient processing, extraction of valuable compounds, and sustainable cultivation practices.
  • Regulatory Framework: Stringent food safety standards and agricultural regulations impacting production and trade.
  • Competitive Substitutes: Other stimulants and flavoring agents pose a moderate competitive threat.
  • End-User Demographics: Growing demand from Asia's burgeoning population drives market expansion.
  • M&A Trends: xx M&A deals between 2019-2024, leading to a xx% shift in market share among top players. Innovation barriers include high initial investment costs for advanced processing technologies and limited access to skilled labor in some regions.

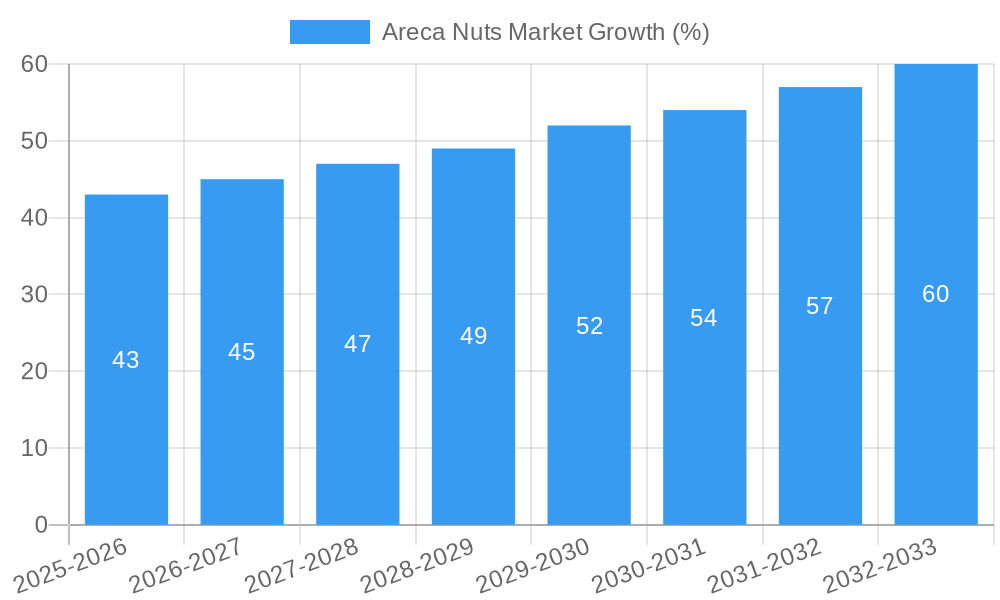
Areca Nuts Market Growth Trends & Insights

The Areca Nuts market witnessed steady growth during the historical period (2019-2024), with a CAGR of xx%. This growth is attributed to increasing consumer demand, particularly in emerging economies, driven by cultural practices and traditional uses. Technological advancements in processing and product diversification have expanded market applications. However, fluctuating prices of raw materials and inconsistent supply chains have presented challenges. Consumer behavior shifts towards health-conscious choices and a preference for sustainably sourced products are impacting market trends. We project a CAGR of xx% during the forecast period (2025-2033), reaching a market size of xx Million units by 2033. Market penetration in untapped regions presents significant growth opportunities.

Areca Nuts Market Growth

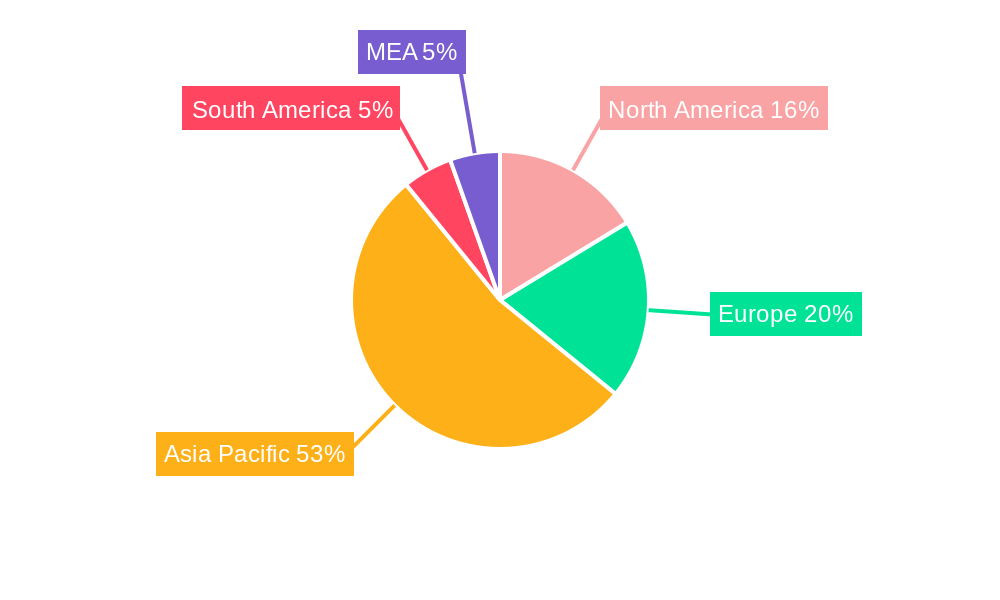
Dominant Regions, Countries, or Segments in Areca Nuts Market

Asia, particularly India and Southeast Asian countries, dominates the Areca Nuts market, accounting for xx% of global consumption in 2024. Within product forms, Whole Nuts hold the largest market share (xx%), followed by Split Nuts (xx%) and Powder (xx%). The Food & Beverages segment is the primary end-use industry, followed by Pharmaceuticals and Personal Care.

  • Key Drivers in Asia: Strong cultural traditions, established consumption patterns, and relatively lower production costs.
  • India's Dominance: Largest producer and consumer, driven by extensive cultivation and established processing infrastructure.
  • Southeast Asia's Growth: Rising disposable incomes and increasing awareness of Areca Nut's traditional uses fuel market expansion.
  • Product Form Segmentation: Whole Nuts dominate due to traditional usage, while powdered forms gain traction in processed food applications.
  • End-Use Industry Segmentation: Food & Beverages are the primary segment, with potential for growth in the Pharmaceuticals sector with further research and development.

Areca Nuts Market Product Landscape

The Areca Nuts market showcases diverse product forms, each catering to specific consumer preferences and industry needs. Innovations include improved processing techniques to enhance shelf life and product quality. The focus is on meeting stringent quality and safety standards, particularly in the food and pharmaceutical sectors. Unique selling propositions revolve around the natural origin of the product and its traditional medicinal uses. Technological advancements aim to increase the extraction efficiency of valuable compounds, thereby expanding applications in various industries.

Key Drivers, Barriers & Challenges in Areca Nuts Market

Key Drivers:

  • Growing demand from traditional markets in Asia.
  • Expanding applications in the food, pharmaceutical, and personal care industries.
  • Technological advancements improving processing and extraction techniques.

Challenges and Restraints:

  • Fluctuations in raw material prices due to climate changes and harvest variability.
  • Concerns regarding health effects resulting in stricter regulations and consumer hesitancy.
  • Supply chain inefficiencies and logistical challenges in remote production areas causing supply disruptions, estimated at a xx% impact on market growth annually.

Emerging Opportunities in Areca Nuts Market

Untapped markets in Africa and South America offer significant growth potential. Innovative applications in functional foods, nutraceuticals, and specialized cosmetic formulations are creating new market opportunities. Growing consumer preference for natural and traditional ingredients is driving demand. Further research and development focusing on the health benefits of Areca Nut compounds could expand market applications significantly.

Growth Accelerators in the Areca Nuts Market Industry

Technological breakthroughs in processing and extraction techniques, coupled with strategic partnerships between producers and end-use industries, will propel market growth. Market expansion strategies targeting untapped global markets, particularly in regions with emerging middle classes and growing demand for natural products, hold immense potential. Investment in sustainable agricultural practices to ensure consistent supply and address environmental concerns will also enhance long-term market growth.

Key Players Shaping the Areca Nuts Market Market

  • Areca Nut Company
  • Jayant Agro-Organics
  • Betel Nut Suppliers
  • Aareca Services

Notable Milestones in Areca Nuts Market Sector

  • 2021: Introduction of a new processing technology by Areca Nut Company, improving product quality and shelf life by 20%.
  • 2022: Jayant Agro-Organics launched a new range of Areca Nut-based functional food products.
  • 2023: Betel Nut Suppliers implemented sustainable farming practices across its supply chain.
  • 2024: Aareca Services expanded its distribution network to several new international markets.

In-Depth Areca Nuts Market Market Outlook

The Areca Nuts market is poised for sustained growth, driven by expanding applications, technological advancements, and increasing consumer demand in both traditional and emerging markets. Strategic partnerships between producers, processors, and end-users will be crucial in navigating challenges and realizing the market's full potential. Focus on sustainable sourcing, product diversification, and compliance with stringent regulatory standards will be key success factors in shaping the future of the Areca Nuts market.

Areca Nuts Market Segmentation

  • 1. Production Analysis
  • 2. Consumption Analysis
  • 3. Import Market Analysis (Value & Volume)
  • 4. Export Market Analysis (Value & Volume)
  • 5. Price Trend Analysis

Areca Nuts Market Segmentation By Geography

  • 1. North America
    • 1.1. United States
    • 1.2. Canada
    • 1.3. Mexico
  • 2. Europe
    • 2.1. Germany
    • 2.2. United Kingdom
    • 2.3. Spain
    • 2.4. Italy
  • 3. Asia Pacific
    • 3.1. China
    • 3.2. India
    • 3.3. Indonesia
    • 3.4. Myanmar
  • 4. South America
    • 4.1. Chile
    • 4.2. Brazil
  • 5. Africa
    • 5.1. South Africa
Areca Nuts Market Regional Share


Areca Nuts Market REPORT HIGHLIGHTS

AspectsDetails
Study Period 2019-2033
Base Year 2024
Estimated Year 2025
Forecast Period2025-2033
Historical Period2019-2024
Growth RateCAGR of 4.73% from 2019-2033
Segmentation
    • By Production Analysis
    • By Consumption Analysis
    • By Import Market Analysis (Value & Volume)
    • By Export Market Analysis (Value & Volume)
    • By Price Trend Analysis
  • By Geography
    • North America
      • United States
      • Canada
      • Mexico
    • Europe
      • Germany
      • United Kingdom
      • Spain
      • Italy
    • Asia Pacific
      • China
      • India
      • Indonesia
      • Myanmar
    • South America
      • Chile
      • Brazil
    • Africa
      • South Africa


Table of Contents

  1. 1. Introduction
    • 1.1. Research Scope
    • 1.2. Market Segmentation
    • 1.3. Research Methodology
    • 1.4. Definitions and Assumptions
  2. 2. Executive Summary
    • 2.1. Introduction
  3. 3. Market Dynamics
    • 3.1. Introduction
      • 3.2. Market Drivers
        • 3.2.1. Rise in Percentage of Area Harvested Under Almond Cultivation; Demand for Healthy Snacking Options
      • 3.3. Market Restrains
        • 3.3.1. Water Scarcity in Almond Producing Regions; Drop in the Prices of Almonds
      • 3.4. Market Trends
        • 3.4.1. Increasing Imports from India
  4. 4. Market Factor Analysis
    • 4.1. Porters Five Forces
    • 4.2. Supply/Value Chain
    • 4.3. PESTEL analysis
    • 4.4. Market Entropy
    • 4.5. Patent/Trademark Analysis
  5. 5. Global Areca Nuts Market Analysis, Insights and Forecast, 2019-2031
    • 5.1. Market Analysis, Insights and Forecast - by Production Analysis
      • 5.2. Market Analysis, Insights and Forecast - by Consumption Analysis
        • 5.3. Market Analysis, Insights and Forecast - by Import Market Analysis (Value & Volume)
          • 5.4. Market Analysis, Insights and Forecast - by Export Market Analysis (Value & Volume)
            • 5.5. Market Analysis, Insights and Forecast - by Price Trend Analysis
              • 5.6. Market Analysis, Insights and Forecast - by Region
                • 5.6.1. North America
                • 5.6.2. Europe
                • 5.6.3. Asia Pacific
                • 5.6.4. South America
                • 5.6.5. Africa
            • 6. North America Areca Nuts Market Analysis, Insights and Forecast, 2019-2031
              • 6.1. Market Analysis, Insights and Forecast - by Production Analysis
                • 6.2. Market Analysis, Insights and Forecast - by Consumption Analysis
                  • 6.3. Market Analysis, Insights and Forecast - by Import Market Analysis (Value & Volume)
                    • 6.4. Market Analysis, Insights and Forecast - by Export Market Analysis (Value & Volume)
                      • 6.5. Market Analysis, Insights and Forecast - by Price Trend Analysis
                      • 7. Europe Areca Nuts Market Analysis, Insights and Forecast, 2019-2031
                        • 7.1. Market Analysis, Insights and Forecast - by Production Analysis
                          • 7.2. Market Analysis, Insights and Forecast - by Consumption Analysis
                            • 7.3. Market Analysis, Insights and Forecast - by Import Market Analysis (Value & Volume)
                              • 7.4. Market Analysis, Insights and Forecast - by Export Market Analysis (Value & Volume)
                                • 7.5. Market Analysis, Insights and Forecast - by Price Trend Analysis
                                • 8. Asia Pacific Areca Nuts Market Analysis, Insights and Forecast, 2019-2031
                                  • 8.1. Market Analysis, Insights and Forecast - by Production Analysis
                                    • 8.2. Market Analysis, Insights and Forecast - by Consumption Analysis
                                      • 8.3. Market Analysis, Insights and Forecast - by Import Market Analysis (Value & Volume)
                                        • 8.4. Market Analysis, Insights and Forecast - by Export Market Analysis (Value & Volume)
                                          • 8.5. Market Analysis, Insights and Forecast - by Price Trend Analysis
                                          • 9. South America Areca Nuts Market Analysis, Insights and Forecast, 2019-2031
                                            • 9.1. Market Analysis, Insights and Forecast - by Production Analysis
                                              • 9.2. Market Analysis, Insights and Forecast - by Consumption Analysis
                                                • 9.3. Market Analysis, Insights and Forecast - by Import Market Analysis (Value & Volume)
                                                  • 9.4. Market Analysis, Insights and Forecast - by Export Market Analysis (Value & Volume)
                                                    • 9.5. Market Analysis, Insights and Forecast - by Price Trend Analysis
                                                    • 10. Africa Areca Nuts Market Analysis, Insights and Forecast, 2019-2031
                                                      • 10.1. Market Analysis, Insights and Forecast - by Production Analysis
                                                        • 10.2. Market Analysis, Insights and Forecast - by Consumption Analysis
                                                          • 10.3. Market Analysis, Insights and Forecast - by Import Market Analysis (Value & Volume)
                                                            • 10.4. Market Analysis, Insights and Forecast - by Export Market Analysis (Value & Volume)
                                                              • 10.5. Market Analysis, Insights and Forecast - by Price Trend Analysis
                                                              • 11. North America Areca Nuts Market Analysis, Insights and Forecast, 2019-2031
                                                                  • 11.1. Market Analysis, Insights and Forecast - By Country/Sub-region
                                                                    • 11.1.1 United States
                                                                    • 11.1.2 Canada
                                                                    • 11.1.3 Mexico
                                                              • 12. Europe Areca Nuts Market Analysis, Insights and Forecast, 2019-2031
                                                                  • 12.1. Market Analysis, Insights and Forecast - By Country/Sub-region
                                                                    • 12.1.1 Germany
                                                                    • 12.1.2 United Kingdom
                                                                    • 12.1.3 France
                                                                    • 12.1.4 Spain
                                                                    • 12.1.5 Italy
                                                                    • 12.1.6 Spain
                                                                    • 12.1.7 Belgium
                                                                    • 12.1.8 Netherland
                                                                    • 12.1.9 Nordics
                                                                    • 12.1.10 Rest of Europe
                                                              • 13. Asia Pacific Areca Nuts Market Analysis, Insights and Forecast, 2019-2031
                                                                  • 13.1. Market Analysis, Insights and Forecast - By Country/Sub-region
                                                                    • 13.1.1 China
                                                                    • 13.1.2 Japan
                                                                    • 13.1.3 India
                                                                    • 13.1.4 South Korea
                                                                    • 13.1.5 Southeast Asia
                                                                    • 13.1.6 Australia
                                                                    • 13.1.7 Indonesia
                                                                    • 13.1.8 Phillipes
                                                                    • 13.1.9 Singapore
                                                                    • 13.1.10 Thailandc
                                                                    • 13.1.11 Rest of Asia Pacific
                                                              • 14. South America Areca Nuts Market Analysis, Insights and Forecast, 2019-2031
                                                                  • 14.1. Market Analysis, Insights and Forecast - By Country/Sub-region
                                                                    • 14.1.1 Brazil
                                                                    • 14.1.2 Argentina
                                                                    • 14.1.3 Peru
                                                                    • 14.1.4 Chile
                                                                    • 14.1.5 Colombia
                                                                    • 14.1.6 Ecuador
                                                                    • 14.1.7 Venezuela
                                                                    • 14.1.8 Rest of South America
                                                              • 15. MEA Areca Nuts Market Analysis, Insights and Forecast, 2019-2031
                                                                  • 15.1. Market Analysis, Insights and Forecast - By Country/Sub-region
                                                                    • 15.1.1 United Arab Emirates
                                                                    • 15.1.2 Saudi Arabia
                                                                    • 15.1.3 South Africa
                                                                    • 15.1.4 Rest of Middle East and Africa
                                                              • 16. Competitive Analysis
                                                                • 16.1. Global Market Share Analysis 2024
                                                                  • 16.2. Company Profiles
                                                                    • 16.2.1 Areca Nut Company
                                                                      • 16.2.1.1. Overview
                                                                      • 16.2.1.2. Products
                                                                      • 16.2.1.3. SWOT Analysis
                                                                      • 16.2.1.4. Recent Developments
                                                                      • 16.2.1.5. Financials (Based on Availability)
                                                                    • 16.2.2 Jayant Agro-Organics
                                                                      • 16.2.2.1. Overview
                                                                      • 16.2.2.2. Products
                                                                      • 16.2.2.3. SWOT Analysis
                                                                      • 16.2.2.4. Recent Developments
                                                                      • 16.2.2.5. Financials (Based on Availability)
                                                                    • 16.2.3 Betel Nut Suppliers
                                                                      • 16.2.3.1. Overview
                                                                      • 16.2.3.2. Products
                                                                      • 16.2.3.3. SWOT Analysis
                                                                      • 16.2.3.4. Recent Developments
                                                                      • 16.2.3.5. Financials (Based on Availability)
                                                                    • 16.2.4 Aareca Services
                                                                      • 16.2.4.1. Overview
                                                                      • 16.2.4.2. Products
                                                                      • 16.2.4.3. SWOT Analysis
                                                                      • 16.2.4.4. Recent Developments
                                                                      • 16.2.4.5. Financials (Based on Availability)

                                                              List of Figures

                                                              1. Figure 1: Global Areca Nuts Market Revenue Breakdown (Million, %) by Region 2024 & 2032
                                                              2. Figure 2: North America Areca Nuts Market Revenue (Million), by Country 2024 & 2032
                                                              3. Figure 3: North America Areca Nuts Market Revenue Share (%), by Country 2024 & 2032
                                                              4. Figure 4: Europe Areca Nuts Market Revenue (Million), by Country 2024 & 2032
                                                              5. Figure 5: Europe Areca Nuts Market Revenue Share (%), by Country 2024 & 2032
                                                              6. Figure 6: Asia Pacific Areca Nuts Market Revenue (Million), by Country 2024 & 2032
                                                              7. Figure 7: Asia Pacific Areca Nuts Market Revenue Share (%), by Country 2024 & 2032
                                                              8. Figure 8: South America Areca Nuts Market Revenue (Million), by Country 2024 & 2032
                                                              9. Figure 9: South America Areca Nuts Market Revenue Share (%), by Country 2024 & 2032
                                                              10. Figure 10: MEA Areca Nuts Market Revenue (Million), by Country 2024 & 2032
                                                              11. Figure 11: MEA Areca Nuts Market Revenue Share (%), by Country 2024 & 2032
                                                              12. Figure 12: North America Areca Nuts Market Revenue (Million), by Production Analysis 2024 & 2032
                                                              13. Figure 13: North America Areca Nuts Market Revenue Share (%), by Production Analysis 2024 & 2032
                                                              14. Figure 14: North America Areca Nuts Market Revenue (Million), by Consumption Analysis 2024 & 2032
                                                              15. Figure 15: North America Areca Nuts Market Revenue Share (%), by Consumption Analysis 2024 & 2032
                                                              16. Figure 16: North America Areca Nuts Market Revenue (Million), by Import Market Analysis (Value & Volume) 2024 & 2032
                                                              17. Figure 17: North America Areca Nuts Market Revenue Share (%), by Import Market Analysis (Value & Volume) 2024 & 2032
                                                              18. Figure 18: North America Areca Nuts Market Revenue (Million), by Export Market Analysis (Value & Volume) 2024 & 2032
                                                              19. Figure 19: North America Areca Nuts Market Revenue Share (%), by Export Market Analysis (Value & Volume) 2024 & 2032
                                                              20. Figure 20: North America Areca Nuts Market Revenue (Million), by Price Trend Analysis 2024 & 2032
                                                              21. Figure 21: North America Areca Nuts Market Revenue Share (%), by Price Trend Analysis 2024 & 2032
                                                              22. Figure 22: North America Areca Nuts Market Revenue (Million), by Country 2024 & 2032
                                                              23. Figure 23: North America Areca Nuts Market Revenue Share (%), by Country 2024 & 2032
                                                              24. Figure 24: Europe Areca Nuts Market Revenue (Million), by Production Analysis 2024 & 2032
                                                              25. Figure 25: Europe Areca Nuts Market Revenue Share (%), by Production Analysis 2024 & 2032
                                                              26. Figure 26: Europe Areca Nuts Market Revenue (Million), by Consumption Analysis 2024 & 2032
                                                              27. Figure 27: Europe Areca Nuts Market Revenue Share (%), by Consumption Analysis 2024 & 2032
                                                              28. Figure 28: Europe Areca Nuts Market Revenue (Million), by Import Market Analysis (Value & Volume) 2024 & 2032
                                                              29. Figure 29: Europe Areca Nuts Market Revenue Share (%), by Import Market Analysis (Value & Volume) 2024 & 2032
                                                              30. Figure 30: Europe Areca Nuts Market Revenue (Million), by Export Market Analysis (Value & Volume) 2024 & 2032
                                                              31. Figure 31: Europe Areca Nuts Market Revenue Share (%), by Export Market Analysis (Value & Volume) 2024 & 2032
                                                              32. Figure 32: Europe Areca Nuts Market Revenue (Million), by Price Trend Analysis 2024 & 2032
                                                              33. Figure 33: Europe Areca Nuts Market Revenue Share (%), by Price Trend Analysis 2024 & 2032
                                                              34. Figure 34: Europe Areca Nuts Market Revenue (Million), by Country 2024 & 2032
                                                              35. Figure 35: Europe Areca Nuts Market Revenue Share (%), by Country 2024 & 2032
                                                              36. Figure 36: Asia Pacific Areca Nuts Market Revenue (Million), by Production Analysis 2024 & 2032
                                                              37. Figure 37: Asia Pacific Areca Nuts Market Revenue Share (%), by Production Analysis 2024 & 2032
                                                              38. Figure 38: Asia Pacific Areca Nuts Market Revenue (Million), by Consumption Analysis 2024 & 2032
                                                              39. Figure 39: Asia Pacific Areca Nuts Market Revenue Share (%), by Consumption Analysis 2024 & 2032
                                                              40. Figure 40: Asia Pacific Areca Nuts Market Revenue (Million), by Import Market Analysis (Value & Volume) 2024 & 2032
                                                              41. Figure 41: Asia Pacific Areca Nuts Market Revenue Share (%), by Import Market Analysis (Value & Volume) 2024 & 2032
                                                              42. Figure 42: Asia Pacific Areca Nuts Market Revenue (Million), by Export Market Analysis (Value & Volume) 2024 & 2032
                                                              43. Figure 43: Asia Pacific Areca Nuts Market Revenue Share (%), by Export Market Analysis (Value & Volume) 2024 & 2032
                                                              44. Figure 44: Asia Pacific Areca Nuts Market Revenue (Million), by Price Trend Analysis 2024 & 2032
                                                              45. Figure 45: Asia Pacific Areca Nuts Market Revenue Share (%), by Price Trend Analysis 2024 & 2032
                                                              46. Figure 46: Asia Pacific Areca Nuts Market Revenue (Million), by Country 2024 & 2032
                                                              47. Figure 47: Asia Pacific Areca Nuts Market Revenue Share (%), by Country 2024 & 2032
                                                              48. Figure 48: South America Areca Nuts Market Revenue (Million), by Production Analysis 2024 & 2032
                                                              49. Figure 49: South America Areca Nuts Market Revenue Share (%), by Production Analysis 2024 & 2032
                                                              50. Figure 50: South America Areca Nuts Market Revenue (Million), by Consumption Analysis 2024 & 2032
                                                              51. Figure 51: South America Areca Nuts Market Revenue Share (%), by Consumption Analysis 2024 & 2032
                                                              52. Figure 52: South America Areca Nuts Market Revenue (Million), by Import Market Analysis (Value & Volume) 2024 & 2032
                                                              53. Figure 53: South America Areca Nuts Market Revenue Share (%), by Import Market Analysis (Value & Volume) 2024 & 2032
                                                              54. Figure 54: South America Areca Nuts Market Revenue (Million), by Export Market Analysis (Value & Volume) 2024 & 2032
                                                              55. Figure 55: South America Areca Nuts Market Revenue Share (%), by Export Market Analysis (Value & Volume) 2024 & 2032
                                                              56. Figure 56: South America Areca Nuts Market Revenue (Million), by Price Trend Analysis 2024 & 2032
                                                              57. Figure 57: South America Areca Nuts Market Revenue Share (%), by Price Trend Analysis 2024 & 2032
                                                              58. Figure 58: South America Areca Nuts Market Revenue (Million), by Country 2024 & 2032
                                                              59. Figure 59: South America Areca Nuts Market Revenue Share (%), by Country 2024 & 2032
                                                              60. Figure 60: Africa Areca Nuts Market Revenue (Million), by Production Analysis 2024 & 2032
                                                              61. Figure 61: Africa Areca Nuts Market Revenue Share (%), by Production Analysis 2024 & 2032
                                                              62. Figure 62: Africa Areca Nuts Market Revenue (Million), by Consumption Analysis 2024 & 2032
                                                              63. Figure 63: Africa Areca Nuts Market Revenue Share (%), by Consumption Analysis 2024 & 2032
                                                              64. Figure 64: Africa Areca Nuts Market Revenue (Million), by Import Market Analysis (Value & Volume) 2024 & 2032
                                                              65. Figure 65: Africa Areca Nuts Market Revenue Share (%), by Import Market Analysis (Value & Volume) 2024 & 2032
                                                              66. Figure 66: Africa Areca Nuts Market Revenue (Million), by Export Market Analysis (Value & Volume) 2024 & 2032
                                                              67. Figure 67: Africa Areca Nuts Market Revenue Share (%), by Export Market Analysis (Value & Volume) 2024 & 2032
                                                              68. Figure 68: Africa Areca Nuts Market Revenue (Million), by Price Trend Analysis 2024 & 2032
                                                              69. Figure 69: Africa Areca Nuts Market Revenue Share (%), by Price Trend Analysis 2024 & 2032
                                                              70. Figure 70: Africa Areca Nuts Market Revenue (Million), by Country 2024 & 2032
                                                              71. Figure 71: Africa Areca Nuts Market Revenue Share (%), by Country 2024 & 2032

                                                              List of Tables

                                                              1. Table 1: Global Areca Nuts Market Revenue Million Forecast, by Region 2019 & 2032
                                                              2. Table 2: Global Areca Nuts Market Revenue Million Forecast, by Production Analysis 2019 & 2032
                                                              3. Table 3: Global Areca Nuts Market Revenue Million Forecast, by Consumption Analysis 2019 & 2032
                                                              4. Table 4: Global Areca Nuts Market Revenue Million Forecast, by Import Market Analysis (Value & Volume) 2019 & 2032
                                                              5. Table 5: Global Areca Nuts Market Revenue Million Forecast, by Export Market Analysis (Value & Volume) 2019 & 2032
                                                              6. Table 6: Global Areca Nuts Market Revenue Million Forecast, by Price Trend Analysis 2019 & 2032
                                                              7. Table 7: Global Areca Nuts Market Revenue Million Forecast, by Region 2019 & 2032
                                                              8. Table 8: Global Areca Nuts Market Revenue Million Forecast, by Country 2019 & 2032
                                                              9. Table 9: United States Areca Nuts Market Revenue (Million) Forecast, by Application 2019 & 2032
                                                              10. Table 10: Canada Areca Nuts Market Revenue (Million) Forecast, by Application 2019 & 2032
                                                              11. Table 11: Mexico Areca Nuts Market Revenue (Million) Forecast, by Application 2019 & 2032
                                                              12. Table 12: Global Areca Nuts Market Revenue Million Forecast, by Country 2019 & 2032
                                                              13. Table 13: Germany Areca Nuts Market Revenue (Million) Forecast, by Application 2019 & 2032
                                                              14. Table 14: United Kingdom Areca Nuts Market Revenue (Million) Forecast, by Application 2019 & 2032
                                                              15. Table 15: France Areca Nuts Market Revenue (Million) Forecast, by Application 2019 & 2032
                                                              16. Table 16: Spain Areca Nuts Market Revenue (Million) Forecast, by Application 2019 & 2032
                                                              17. Table 17: Italy Areca Nuts Market Revenue (Million) Forecast, by Application 2019 & 2032
                                                              18. Table 18: Spain Areca Nuts Market Revenue (Million) Forecast, by Application 2019 & 2032
                                                              19. Table 19: Belgium Areca Nuts Market Revenue (Million) Forecast, by Application 2019 & 2032
                                                              20. Table 20: Netherland Areca Nuts Market Revenue (Million) Forecast, by Application 2019 & 2032
                                                              21. Table 21: Nordics Areca Nuts Market Revenue (Million) Forecast, by Application 2019 & 2032
                                                              22. Table 22: Rest of Europe Areca Nuts Market Revenue (Million) Forecast, by Application 2019 & 2032
                                                              23. Table 23: Global Areca Nuts Market Revenue Million Forecast, by Country 2019 & 2032
                                                              24. Table 24: China Areca Nuts Market Revenue (Million) Forecast, by Application 2019 & 2032
                                                              25. Table 25: Japan Areca Nuts Market Revenue (Million) Forecast, by Application 2019 & 2032
                                                              26. Table 26: India Areca Nuts Market Revenue (Million) Forecast, by Application 2019 & 2032
                                                              27. Table 27: South Korea Areca Nuts Market Revenue (Million) Forecast, by Application 2019 & 2032
                                                              28. Table 28: Southeast Asia Areca Nuts Market Revenue (Million) Forecast, by Application 2019 & 2032
                                                              29. Table 29: Australia Areca Nuts Market Revenue (Million) Forecast, by Application 2019 & 2032
                                                              30. Table 30: Indonesia Areca Nuts Market Revenue (Million) Forecast, by Application 2019 & 2032
                                                              31. Table 31: Phillipes Areca Nuts Market Revenue (Million) Forecast, by Application 2019 & 2032
                                                              32. Table 32: Singapore Areca Nuts Market Revenue (Million) Forecast, by Application 2019 & 2032
                                                              33. Table 33: Thailandc Areca Nuts Market Revenue (Million) Forecast, by Application 2019 & 2032
                                                              34. Table 34: Rest of Asia Pacific Areca Nuts Market Revenue (Million) Forecast, by Application 2019 & 2032
                                                              35. Table 35: Global Areca Nuts Market Revenue Million Forecast, by Country 2019 & 2032
                                                              36. Table 36: Brazil Areca Nuts Market Revenue (Million) Forecast, by Application 2019 & 2032
                                                              37. Table 37: Argentina Areca Nuts Market Revenue (Million) Forecast, by Application 2019 & 2032
                                                              38. Table 38: Peru Areca Nuts Market Revenue (Million) Forecast, by Application 2019 & 2032
                                                              39. Table 39: Chile Areca Nuts Market Revenue (Million) Forecast, by Application 2019 & 2032
                                                              40. Table 40: Colombia Areca Nuts Market Revenue (Million) Forecast, by Application 2019 & 2032
                                                              41. Table 41: Ecuador Areca Nuts Market Revenue (Million) Forecast, by Application 2019 & 2032
                                                              42. Table 42: Venezuela Areca Nuts Market Revenue (Million) Forecast, by Application 2019 & 2032
                                                              43. Table 43: Rest of South America Areca Nuts Market Revenue (Million) Forecast, by Application 2019 & 2032
                                                              44. Table 44: Global Areca Nuts Market Revenue Million Forecast, by Country 2019 & 2032
                                                              45. Table 45: United Arab Emirates Areca Nuts Market Revenue (Million) Forecast, by Application 2019 & 2032
                                                              46. Table 46: Saudi Arabia Areca Nuts Market Revenue (Million) Forecast, by Application 2019 & 2032
                                                              47. Table 47: South Africa Areca Nuts Market Revenue (Million) Forecast, by Application 2019 & 2032
                                                              48. Table 48: Rest of Middle East and Africa Areca Nuts Market Revenue (Million) Forecast, by Application 2019 & 2032
                                                              49. Table 49: Global Areca Nuts Market Revenue Million Forecast, by Production Analysis 2019 & 2032
                                                              50. Table 50: Global Areca Nuts Market Revenue Million Forecast, by Consumption Analysis 2019 & 2032
                                                              51. Table 51: Global Areca Nuts Market Revenue Million Forecast, by Import Market Analysis (Value & Volume) 2019 & 2032
                                                              52. Table 52: Global Areca Nuts Market Revenue Million Forecast, by Export Market Analysis (Value & Volume) 2019 & 2032
                                                              53. Table 53: Global Areca Nuts Market Revenue Million Forecast, by Price Trend Analysis 2019 & 2032
                                                              54. Table 54: Global Areca Nuts Market Revenue Million Forecast, by Country 2019 & 2032
                                                              55. Table 55: United States Areca Nuts Market Revenue (Million) Forecast, by Application 2019 & 2032
                                                              56. Table 56: Canada Areca Nuts Market Revenue (Million) Forecast, by Application 2019 & 2032
                                                              57. Table 57: Mexico Areca Nuts Market Revenue (Million) Forecast, by Application 2019 & 2032
                                                              58. Table 58: Global Areca Nuts Market Revenue Million Forecast, by Production Analysis 2019 & 2032
                                                              59. Table 59: Global Areca Nuts Market Revenue Million Forecast, by Consumption Analysis 2019 & 2032
                                                              60. Table 60: Global Areca Nuts Market Revenue Million Forecast, by Import Market Analysis (Value & Volume) 2019 & 2032
                                                              61. Table 61: Global Areca Nuts Market Revenue Million Forecast, by Export Market Analysis (Value & Volume) 2019 & 2032
                                                              62. Table 62: Global Areca Nuts Market Revenue Million Forecast, by Price Trend Analysis 2019 & 2032
                                                              63. Table 63: Global Areca Nuts Market Revenue Million Forecast, by Country 2019 & 2032
                                                              64. Table 64: Germany Areca Nuts Market Revenue (Million) Forecast, by Application 2019 & 2032
                                                              65. Table 65: United Kingdom Areca Nuts Market Revenue (Million) Forecast, by Application 2019 & 2032
                                                              66. Table 66: Spain Areca Nuts Market Revenue (Million) Forecast, by Application 2019 & 2032
                                                              67. Table 67: Italy Areca Nuts Market Revenue (Million) Forecast, by Application 2019 & 2032
                                                              68. Table 68: Global Areca Nuts Market Revenue Million Forecast, by Production Analysis 2019 & 2032
                                                              69. Table 69: Global Areca Nuts Market Revenue Million Forecast, by Consumption Analysis 2019 & 2032
                                                              70. Table 70: Global Areca Nuts Market Revenue Million Forecast, by Import Market Analysis (Value & Volume) 2019 & 2032
                                                              71. Table 71: Global Areca Nuts Market Revenue Million Forecast, by Export Market Analysis (Value & Volume) 2019 & 2032
                                                              72. Table 72: Global Areca Nuts Market Revenue Million Forecast, by Price Trend Analysis 2019 & 2032
                                                              73. Table 73: Global Areca Nuts Market Revenue Million Forecast, by Country 2019 & 2032
                                                              74. Table 74: China Areca Nuts Market Revenue (Million) Forecast, by Application 2019 & 2032
                                                              75. Table 75: India Areca Nuts Market Revenue (Million) Forecast, by Application 2019 & 2032
                                                              76. Table 76: Indonesia Areca Nuts Market Revenue (Million) Forecast, by Application 2019 & 2032
                                                              77. Table 77: Myanmar Areca Nuts Market Revenue (Million) Forecast, by Application 2019 & 2032
                                                              78. Table 78: Global Areca Nuts Market Revenue Million Forecast, by Production Analysis 2019 & 2032
                                                              79. Table 79: Global Areca Nuts Market Revenue Million Forecast, by Consumption Analysis 2019 & 2032
                                                              80. Table 80: Global Areca Nuts Market Revenue Million Forecast, by Import Market Analysis (Value & Volume) 2019 & 2032
                                                              81. Table 81: Global Areca Nuts Market Revenue Million Forecast, by Export Market Analysis (Value & Volume) 2019 & 2032
                                                              82. Table 82: Global Areca Nuts Market Revenue Million Forecast, by Price Trend Analysis 2019 & 2032
                                                              83. Table 83: Global Areca Nuts Market Revenue Million Forecast, by Country 2019 & 2032
                                                              84. Table 84: Chile Areca Nuts Market Revenue (Million) Forecast, by Application 2019 & 2032
                                                              85. Table 85: Brazil Areca Nuts Market Revenue (Million) Forecast, by Application 2019 & 2032
                                                              86. Table 86: Global Areca Nuts Market Revenue Million Forecast, by Production Analysis 2019 & 2032
                                                              87. Table 87: Global Areca Nuts Market Revenue Million Forecast, by Consumption Analysis 2019 & 2032
                                                              88. Table 88: Global Areca Nuts Market Revenue Million Forecast, by Import Market Analysis (Value & Volume) 2019 & 2032
                                                              89. Table 89: Global Areca Nuts Market Revenue Million Forecast, by Export Market Analysis (Value & Volume) 2019 & 2032
                                                              90. Table 90: Global Areca Nuts Market Revenue Million Forecast, by Price Trend Analysis 2019 & 2032
                                                              91. Table 91: Global Areca Nuts Market Revenue Million Forecast, by Country 2019 & 2032
                                                              92. Table 92: South Africa Areca Nuts Market Revenue (Million) Forecast, by Application 2019 & 2032


                                                              Frequently Asked Questions

                                                              1. What is the projected Compound Annual Growth Rate (CAGR) of the Areca Nuts Market?

                                                              The projected CAGR is approximately 4.73%.

                                                              2. Which companies are prominent players in the Areca Nuts Market?

                                                              Key companies in the market include Areca Nut Company , Jayant Agro-Organics , Betel Nut Suppliers, Aareca Services.

                                                              3. What are the main segments of the Areca Nuts Market?

                                                              The market segments include Production Analysis, Consumption Analysis, Import Market Analysis (Value & Volume), Export Market Analysis (Value & Volume), Price Trend Analysis.

                                                              4. Can you provide details about the market size?

                                                              The market size is estimated to be USD 0.92 Million as of 2022.

                                                              5. What are some drivers contributing to market growth?

                                                              Rise in Percentage of Area Harvested Under Almond Cultivation; Demand for Healthy Snacking Options.

                                                              6. What are the notable trends driving market growth?

                                                              Increasing Imports from India.

                                                              7. Are there any restraints impacting market growth?

                                                              Water Scarcity in Almond Producing Regions; Drop in the Prices of Almonds.

                                                              8. Can you provide examples of recent developments in the market?

                                                              N/A

                                                              9. What pricing options are available for accessing the report?

                                                              Pricing options include single-user, multi-user, and enterprise licenses priced at USD 4750, USD 5250, and USD 8750 respectively.

                                                              10. Is the market size provided in terms of value or volume?

                                                              The market size is provided in terms of value, measured in Million.

                                                              11. Are there any specific market keywords associated with the report?

                                                              Yes, the market keyword associated with the report is "Areca Nuts Market," which aids in identifying and referencing the specific market segment covered.

                                                              12. How do I determine which pricing option suits my needs best?

                                                              The pricing options vary based on user requirements and access needs. Individual users may opt for single-user licenses, while businesses requiring broader access may choose multi-user or enterprise licenses for cost-effective access to the report.

                                                              13. Are there any additional resources or data provided in the Areca Nuts Market report?

                                                              While the report offers comprehensive insights, it's advisable to review the specific contents or supplementary materials provided to ascertain if additional resources or data are available.

                                                              14. How can I stay updated on further developments or reports in the Areca Nuts Market?

                                                              To stay informed about further developments, trends, and reports in the Areca Nuts Market, consider subscribing to industry newsletters, following relevant companies and organizations, or regularly checking reputable industry news sources and publications.


                                                              Methodology

                                                              Step 1 - Identification of Relevant Samples Size from Population Database

                                                              Step Chart
                                                              Bar Chart
                                                              Method Chart

                                                              Step 2 - Approaches for Defining Global Market Size (Value, Volume* & Price*)

                                                              Approach Chart
                                                              Top-down and bottom-up approaches are used to validate the global market size and estimate the market size for manufactures, regional segments, product, and application.

                                                              Note*: In applicable scenarios

                                                              Step 3 - Data Sources

                                                              Primary Research

                                                              • Web Analytics
                                                              • Survey Reports
                                                              • Research Institute
                                                              • Latest Research Reports
                                                              • Opinion Leaders

                                                              Secondary Research

                                                              • Annual Reports
                                                              • White Paper
                                                              • Latest Press Release
                                                              • Industry Association
                                                              • Paid Database
                                                              • Investor Presentations
                                                              Analyst Chart

                                                              Step 4 - Data Triangulation

                                                              Involves using different sources of information in order to increase the validity of a study

                                                              These sources are likely to be stakeholders in a program - participants, other researchers, program staff, other community members, and so on.

                                                              Then we put all data in single framework & apply various statistical tools to find out the dynamic on the market.

                                                              During the analysis stage, feedback from the stakeholder groups would be compared to determine areas of agreement as well as areas of divergence

                                                              Additionally, after gathering mixed and scattered data from a wide range of sources, data is triangulated and correlated to come up with estimated figures which are further validated through primary mediums or industry experts, opinion leaders.

                                                              About Visionary Data Reports

                                                              Visionary Data Reports provides future-focused market research, advanced analytics, and strategic insights for technology, healthcare, green energy, and finance. Our reports help you anticipate trends, innovate, and lead in your industry. Our expert team combines primary research, data science, and industry knowledge to deliver actionable intelligence. We offer syndicated reports, custom analytics, and consulting services tailored to your business needs. At Visionary Data Reports, we are committed to quality, transparency, and client satisfaction. Every report is rigorously validated to ensure accuracy and relevance. Our global perspective and forward-thinking approach help you understand both current and emerging market dynamics.

                                                              Stay ahead with Visionary Data Reports. Subscribe to our newsletter for the latest insights and research highlights, and follow us on social media for real-time updates. Visionary Data Reports – Your Guide to Tomorrow’s Opportunities.

                                                              artwork spiralartwork spiralRelated Reports
                                                              artwork underline

                                                              Sudan Alfalfa Market Trends and Forecasts: Comprehensive Insights

                                                              Discover the booming Sudan alfalfa market! Projected to reach $373.33 million by 2033, with a 5.5% CAGR, this report analyzes market drivers, trends, and key players like Syngenta and DLF Seeds across segments including hay, pellets & seeds for livestock and human consumption. Explore regional data and investment opportunities.

                                                              July 2025
                                                              Base Year: 2024
                                                              No Of Pages: 150
                                                              Price: $3800

                                                              North America Specialty Fertilizer Market 2025-2033 Overview: Trends, Competitor Dynamics, and Opportunities

                                                              The North American specialty fertilizer market is experiencing robust growth, driven by precision agriculture, sustainable farming practices, and demand for high-yield crops. Explore market size, CAGR, key players (Koch Industries, Mosaic, Nutrien), and regional trends (US, Canada, Mexico) in this in-depth analysis. Discover opportunities and challenges in the liquid, slow-release, and water-soluble fertilizer segments.

                                                              July 2025
                                                              Base Year: 2024
                                                              No Of Pages: 197
                                                              Price: $3800

                                                              Europe Chia Seeds Market Market’s Role in Emerging Tech: Insights and Projections 2025-2033

                                                              Discover the booming European chia seeds market! This in-depth analysis reveals market size, CAGR, key players (The Chia Company, Salba, Nutiva), and growth drivers. Explore trends in packaging, applications (food, supplements, personal care), and regional variations. Learn how this €414.20 million market is poised for significant expansion.

                                                              July 2025
                                                              Base Year: 2024
                                                              No Of Pages: 180
                                                              Price: $4750

                                                              Drivers of Change in Thailand Vegetable Seed Market Market 2025-2033

                                                              Discover the thriving Thailand vegetable seed market's growth trajectory (CAGR 5.20%), driven by consumer demand and technological advancements. Explore market segmentation, key players, and challenges impacting this dynamic sector projected to reach $XXX million by 2033.

                                                              July 2025
                                                              Base Year: 2024
                                                              No Of Pages: 150
                                                              Price: $3800

                                                              Consumer Trends Driving Indonesia Fungicide Market Market Growth

                                                              Discover the booming Indonesia Fungicide Market! This report reveals a projected 16.50% CAGR from 2025-2033, driven by rising disease prevalence, advanced application methods, and government support. Learn about market size, key players (Bayer, Syngenta, BASF), and future trends impacting this dynamic agricultural sector.

                                                              July 2025
                                                              Base Year: 2024
                                                              No Of Pages: 197
                                                              Price: $3800

                                                              Tomato Seed Market 2025-2033 Overview: Trends, Competitor Dynamics, and Opportunities

                                                              Discover the booming global tomato seed market! This comprehensive analysis reveals key trends, growth drivers (hybrid seeds, protected cultivation), restraints, and regional insights (Asia-Pacific leading) for the period 2019-2033, featuring top players like Sakata Seeds and Syngenta. Projected CAGR of 4.70% showcases significant investment opportunities.

                                                              July 2025
                                                              Base Year: 2024
                                                              No Of Pages: 180
                                                              Price: $3800

                                                              Emerging Trends in Brazil Maize Market: A Technology Perspective 2025-2033

                                                              Discover the dynamic Brazil maize market forecast (2025-2033)! This in-depth analysis reveals key growth drivers, including animal feed, biofuel, and human consumption, alongside major players like Syngenta and Corteva. Explore market size, CAGR, and regional insights to understand this lucrative opportunity.

                                                              July 2025
                                                              Base Year: 2024
                                                              No Of Pages: 180
                                                              Price: $3800

                                                              Future Forecasts for North America Seed Treatment Market Industry Growth

                                                              Discover the booming North American seed treatment market! This in-depth analysis reveals a CAGR of 4.20% (2025-2033), driven by precision farming, pest control needs, and government support. Explore key players, market segments (fungicides, insecticides, crops), and regional trends in the US, Canada, and Mexico. Get the data-driven insights you need to succeed.

                                                              July 2025
                                                              Base Year: 2024
                                                              No Of Pages: 150
                                                              Price: $3800

                                                              Africa Chia Seeds Industry Market’s Drivers and Challenges: Strategic Overview 2025-2033

                                                              Discover the booming African chia seed market! Our analysis reveals a $13.87M market in 2025, projected to grow at a 2.10% CAGR through 2033. Explore key trends, segments (organic, hybrid, processed, omega-3 rich), applications (food & beverage, supplements, personal care), and leading companies. Get insights for investment and market entry.

                                                              July 2025
                                                              Base Year: 2024
                                                              No Of Pages: 180
                                                              Price: $4750

                                                              Strategic Trends in Asia-Pacific Seed Coating Materials Market Market 2025-2033

                                                              The Asia-Pacific seed coating materials market is booming, with an 8% CAGR. Discover key trends, leading companies (BASF, Bayer), and segment analysis (polymers, colorants) driving growth in this $XX million market. Explore the forecast to 2033.

                                                              July 2025
                                                              Base Year: 2024
                                                              No Of Pages: 150
                                                              Price: $3800

                                                              Comprehensive Review of UK Fruits and Vegetables Market Growth Potential

                                                              Discover the booming UK fruits and vegetables market! This in-depth analysis reveals a £31.58 billion market with a 2.97% CAGR (2025-2033), driven by health trends and major players like Tesco and Sainsbury's. Explore regional data, consumption patterns, and future growth potential.

                                                              July 2025
                                                              Base Year: 2024
                                                              No Of Pages: 180
                                                              Price: $3800

                                                              Malaysia Agrochemical Market Market’s Drivers and Challenges: Strategic Overview 2025-2033

                                                              Discover the booming Malaysian agrochemical market! This comprehensive analysis reveals a RM 679.59 million market in 2025, projected to grow at a 4.56% CAGR until 2033. Explore key drivers, trends, restraints, and leading companies shaping this dynamic sector. Learn about fertilizers, pesticides, and other agrochemical segments.

                                                              July 2025
                                                              Base Year: 2024
                                                              No Of Pages: 150
                                                              Price: $3800

                                                              Drivers of Change in Agricultural Surfactant Market Market 2025-2033

                                                              The global agricultural surfactant market is booming, projected to reach $3.56 billion by 2033 with a 6.70% CAGR. Driven by precision agriculture and sustainable farming, this market analysis explores key segments (anionic, nonionic, bio-based), top players (BASF, Clariant), and regional growth trends. Discover the future of agricultural surfactants.

                                                              July 2025
                                                              Base Year: 2024
                                                              No Of Pages: 234
                                                              Price: $4750

                                                              Cameroon Grains Industry Industry Analysis and Consumer Behavior

                                                              Discover the booming Cameroon grains industry! Explore market size, growth trends (4.80% CAGR), key players (Sodecoton, CDC, etc.), and challenges impacting cereals, pulses, and oilseeds in Cameroon from 2019-2033. Invest wisely in this promising African market.

                                                              July 2025
                                                              Base Year: 2024
                                                              No Of Pages: 180
                                                              Price: $3800

                                                              Analyzing Consumer Behavior in Agriculture Market in Tanzania Market

                                                              Discover the booming Tanzanian agriculture market! Projected to reach $17.44 billion in 2025, with a 5.63% CAGR, this report analyzes market size, key players (Syngenta, Rijk Zwaan), growth drivers, and future trends in Tanzania's agricultural sector. Explore market segments, including food crops and investment opportunities.

                                                              July 2025
                                                              Base Year: 2024
                                                              No Of Pages: 150
                                                              Price: $3800

                                                              Analyzing Consumer Behavior in Artificial Intelligence in Agriculture Industry Market

                                                              Discover the booming AI in Agriculture market! This comprehensive analysis reveals a 4.20% CAGR, key drivers, trends, restraints, and regional insights from 2019-2033. Learn about leading companies and applications like precision farming, drone analytics, and weather tracking. Explore market size projections and future growth potential.

                                                              July 2025
                                                              Base Year: 2024
                                                              No Of Pages: 150
                                                              Price: $4750

                                                              Exploring Forestry Machinery Market’s Market Size Dynamics 2025-2033

                                                              The global forestry machinery market is booming, projected to reach $15 billion by 2033, driven by rising timber demand and technological advancements. Explore market trends, key players (Deere, Komatsu, etc.), and regional growth in our comprehensive analysis.

                                                              July 2025
                                                              Base Year: 2024
                                                              No Of Pages: 150
                                                              Price: $4750

                                                              Nutrition Canary Seed Market Competitive Strategies: Trends and Forecasts 2025-2033

                                                              Discover the booming nutrition canary seed market! Explore key trends, growth drivers, and regional market share projections for 2025-2033. Learn about leading companies and the increasing demand driven by health-conscious consumers and the birdseed industry.

                                                              July 2025
                                                              Base Year: 2024
                                                              No Of Pages: 234
                                                              Price: $4750

                                                              Consumer Behavior and Cashews Market in South America Trends

                                                              Discover the booming South American cashew market! This comprehensive analysis reveals a $582.24 million market in 2025, projected to grow at a 5.20% CAGR through 2033. Explore key trends, drivers, and leading companies shaping this lucrative industry.

                                                              July 2025
                                                              Base Year: 2024
                                                              No Of Pages: 180
                                                              Price: $3800

                                                              Strategic Growth Drivers for Rye Industry Market

                                                              Discover the latest market analysis of the global rye industry, projecting a steady CAGR of 2.20% to 2033. Explore key drivers, restraints, and regional trends impacting the growth of rye in food, feed, and beverage applications. Learn about leading companies and future market opportunities.

                                                              July 2025
                                                              Base Year: 2024
                                                              No Of Pages: 234
                                                              Price: $4750
                                                              • Home
                                                              • About Us
                                                              • Industries
                                                                • Aerospace & Defense
                                                                • Agriculture
                                                                • Animal Nutrition & Wellness
                                                                • Automotive
                                                                • Chemicals & Materials
                                                                • Consumer Goods and Services
                                                                • Energy & Power
                                                                • Financial Services and Investment Intelligence
                                                                • Food & Beverage
                                                                • Home and Property Improvement
                                                                • Hospitality and Tourism
                                                                • Logistics
                                                                • Manufacturing Products and Services
                                                                • Packaging
                                                                • Professional and Commercial Services
                                                                • Real Estate and Construction
                                                                • Retail
                                                                • Technology, Media and Telecom
                                                                • Healthcare
                                                              • Services
                                                              • Contact
                                                              Main Logo
                                                              • Home
                                                              • About Us
                                                              • Industries
                                                                • Aerospace & Defense
                                                                • Agriculture
                                                                • Animal Nutrition & Wellness
                                                                • Automotive
                                                                • Chemicals & Materials
                                                                • Consumer Goods and Services
                                                                • Energy & Power
                                                                • Financial Services and Investment Intelligence
                                                                • Food & Beverage
                                                                • Home and Property Improvement
                                                                • Hospitality and Tourism
                                                                • Logistics
                                                                • Manufacturing Products and Services
                                                                • Packaging
                                                                • Professional and Commercial Services
                                                                • Real Estate and Construction
                                                                • Retail
                                                                • Technology, Media and Telecom
                                                                • Healthcare
                                                              • Services
                                                              • Contact
                                                              +17162654855
                                                              [email protected]

                                                              +17162654855

                                                              [email protected]

                                                              Business Address

                                                              Head Office

                                                              Office no. A 5010, fifth floor, Solitaire Business Hub, Near Phoenix mall, Pune, Maharashtra 411014

                                                              Contact Information

                                                              Craig Francis

                                                              Business Development Head

                                                              +17162654855

                                                              [email protected]

                                                              Connect With Us

                                                              Secure Payment Partners

                                                              payment image
                                                              RetailLogisticsPackagingAutomotiveHealthcareAgricultureEnergy & PowerFood & BeverageAerospace & DefenseChemicals & MaterialsHospitality and TourismAnimal Nutrition & WellnessConsumer Goods and ServicesReal Estate and ConstructionHome and Property ImprovementTechnology, Media and TelecomManufacturing Products and ServicesFinancial Services and Investment Intelligence

                                                              © 2025 All rights reserved


                                                              Privacy Policy
                                                              Terms and Conditions
                                                              FAQ