

Key Insights
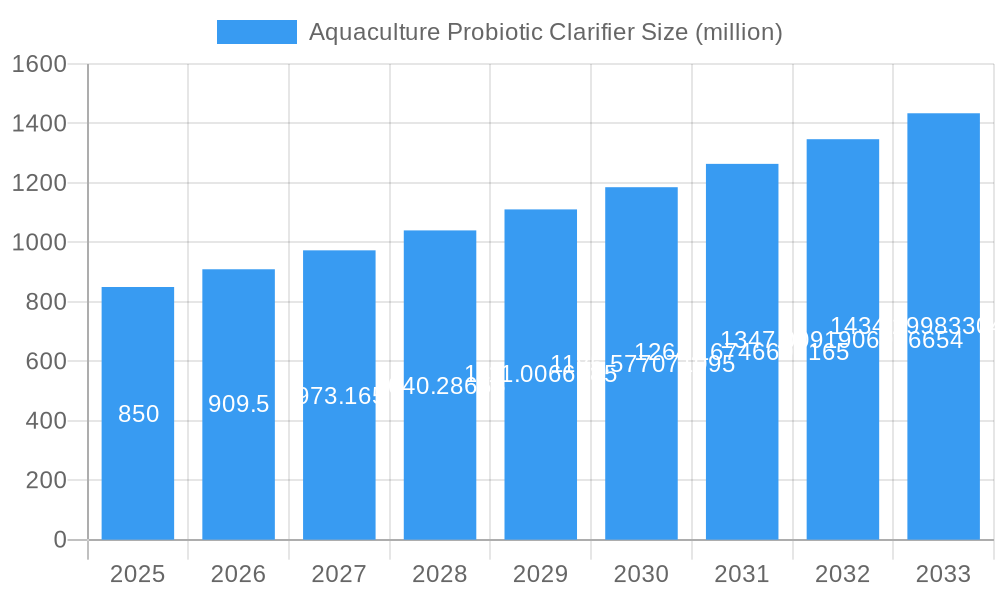
The global Aquaculture Probiotic Clarifier market is poised for significant expansion, projected to reach approximately $850 million by 2025. This robust growth is underpinned by a compelling Compound Annual Growth Rate (CAGR) of 7%, indicating sustained demand for innovative solutions in aquaculture. The primary driver behind this surge is the increasing global demand for seafood, necessitating more efficient and sustainable farming practices. Probiotic clarifiers play a crucial role in enhancing water quality, reducing disease outbreaks, and improving overall fish health, thereby boosting yield and profitability for aquaculture operations. Furthermore, growing consumer awareness regarding the environmental impact of conventional aquaculture methods is propelling the adoption of eco-friendly alternatives like probiotic clarifiers, which contribute to a healthier aquatic ecosystem and minimize the need for chemical treatments. Emerging economies, particularly in Asia Pacific, are witnessing rapid advancements in aquaculture infrastructure and are becoming key consumption hubs, further fueling market expansion.
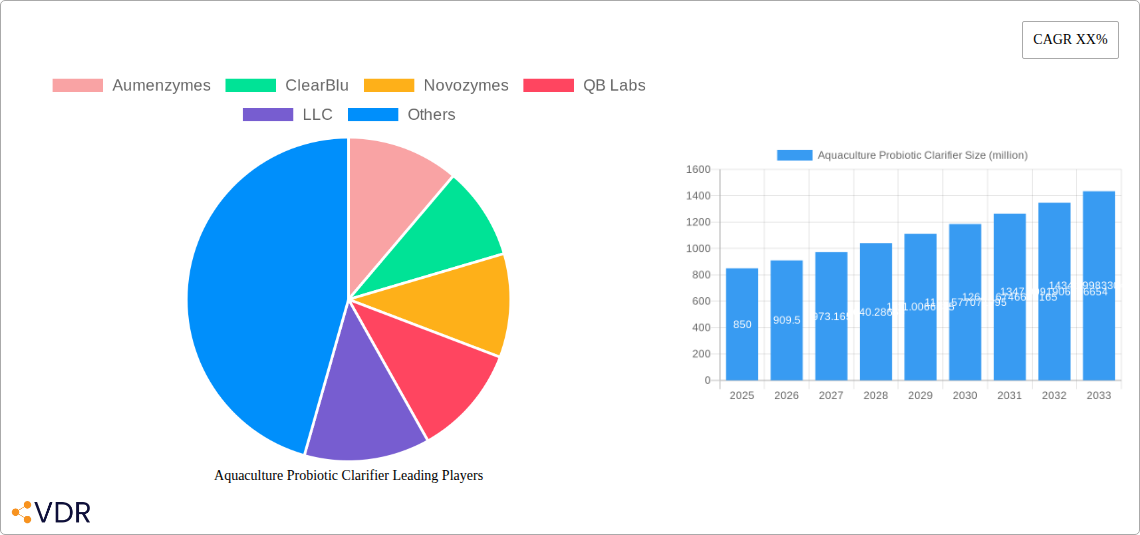
Aquaculture Probiotic Clarifier Market Size (In Million)
The market is characterized by a dynamic interplay of trends, including a strong emphasis on research and development for novel probiotic strains with enhanced efficacy and broader application ranges. The integration of advanced biotechnology and microbial science is leading to the development of customized probiotic solutions tailored to specific aquaculture species and environmental conditions. While the market is experiencing substantial growth, certain restraints such as the cost of implementation for small-scale farmers and the need for consistent technical support and training can pose challenges. However, the prevailing trends of sustainability, disease prevention, and improved feed conversion ratios are expected to outweigh these limitations. The market is segmented into various applications, with Fish and Crustaceans dominating the demand, and diverse types, including Freshwater and Saltwater, catering to a wide spectrum of aquaculture setups. Key players are actively engaged in strategic collaborations and product innovation to capture a larger market share and address the evolving needs of the aquaculture industry.
Aquaculture Probiotic Clarifier Company Market Share
This comprehensive report offers an in-depth analysis of the global Aquaculture Probiotic Clarifier market, a rapidly evolving sector crucial for sustainable aquaculture practices. Discover key market dynamics, growth trends, regional dominance, product landscape, and future opportunities. This report is an indispensable resource for stakeholders seeking to understand and capitalize on the burgeoning fish farming probiotic, shrimp farming probiotic, and aquatic probiotic markets.
Aquaculture Probiotic Clarifier Market Dynamics & Structure
The Aquaculture Probiotic Clarifier market exhibits a moderately concentrated structure, with key players investing heavily in research and development to enhance product efficacy and sustainability. Technological innovation is a primary driver, fueled by the growing demand for environmentally friendly solutions to improve water quality and reduce reliance on chemical treatments in fish aquaculture, crustacean aquaculture, and other aquatic farming segments. Regulatory frameworks, particularly concerning water quality standards and the permissible use of biological agents, are shaping market entry and product development. Competitive product substitutes, such as chemical clarifiers and traditional water treatment methods, pose a challenge, but the increasing awareness of the long-term benefits of probiotics is shifting preferences. End-user demographics range from large-scale commercial aquaculture operations to smaller, specialized farms, all seeking to optimize production and minimize environmental impact. Mergers and acquisitions (M&A) activity is expected to increase as established companies seek to expand their product portfolios and market reach in the freshwater aquaculture probiotic and saltwater aquaculture probiotic sectors.
- Market Concentration: Moderately concentrated, with top players holding significant market share.
- Technological Innovation Drivers: Demand for sustainable solutions, improved water quality, disease prevention, and enhanced feed conversion ratios.
- Regulatory Frameworks: Stringent water quality regulations, growing emphasis on biological solutions, and evolving guidelines for probiotic use.
- Competitive Product Substitutes: Chemical clarifiers, aeration systems, UV sterilization, and traditional filtration methods.
- End-User Demographics: Commercial fish farms, shrimp farms, ornamental fish producers, and integrated aquaculture operations.
- M&A Trends: Increasing consolidation anticipated to gain market share and technological expertise.
Aquaculture Probiotic Clarifier Growth Trends & Insights
The Aquaculture Probiotic Clarifier market is poised for substantial growth, driven by increasing global demand for seafood and the imperative for sustainable aquaculture practices. The market size is projected to expand significantly, moving from approximately 450 million units in 2024 to an estimated 980 million units by 2033. This growth will be propelled by a compound annual growth rate (CAGR) of approximately 8.5% during the forecast period (2025-2033). Adoption rates of probiotic clarifiers are accelerating as aquaculturists recognize their multifaceted benefits, including improved water clarity, reduced pathogen load, enhanced nutrient cycling, and better overall pond health. Technological disruptions are leading to the development of more potent and targeted probiotic formulations, offering tailored solutions for specific aquaculture challenges. Consumer behavior shifts, characterized by a growing preference for sustainably produced seafood, are indirectly fueling the demand for aquaculture inputs like probiotic clarifiers. The market penetration of these advanced solutions is expected to rise as their economic and environmental advantages become more evident.
The market's expansion will be further underpinned by advancements in research and development, leading to novel strains of probiotics with enhanced capabilities for waste decomposition, ammonia reduction, and disease resistance. The integration of smart farming technologies and data analytics will also play a role, enabling farmers to optimize probiotic application for maximum efficacy. As awareness campaigns and educational initiatives gain traction, more aquaculturists will embrace these biological solutions, contributing to a healthier and more productive aquaculture industry. The shift away from chemical-intensive farming will be a major catalyst, positioning probiotic clarifiers as a cornerstone of modern aquaculture.
Dominant Regions, Countries, or Segments in Aquaculture Probiotic Clarifier
The fish segment within the Aquaculture Probiotic Clarifier market is the dominant force driving global growth, accounting for an estimated 60% of the market share in 2025. This dominance stems from the sheer scale of global fish production and the widespread application of probiotics in various fish farming systems, including intensive and extensive methods. Within this segment, freshwater aquaculture applications are particularly influential, driven by widespread freshwater fish farming operations in Asia, Europe, and North America. Countries like China, India, Vietnam, and Brazil are major contributors due to their significant freshwater fish production volumes and increasing adoption of advanced aquaculture technologies. The demand for improved water quality and disease management in large-scale freshwater fish farms creates a robust market for probiotic clarifiers.
The crustacean segment, particularly shrimp farming, is also a significant and rapidly growing contributor, representing approximately 35% of the market share. The intensive nature of shrimp farming often leads to water quality challenges, making probiotic clarifiers essential for maintaining optimal conditions and preventing disease outbreaks. Countries in Southeast Asia and Latin America, leading shrimp producers, are key markets for these products. The remaining 5% of the market is captured by the others segment, which includes applications in shellfish, ornamental fish, and other specialized aquaculture ventures. These segments, while smaller, are crucial for niche applications and innovation.
Across all segments, saltwater aquaculture applications are gaining traction, particularly in coastal regions with large-scale marine fish and shrimp farming. The challenges of managing water quality in the marine environment make probiotic solutions increasingly valuable. Economic policies supporting sustainable aquaculture, government initiatives promoting technological adoption, and the development of robust aquaculture infrastructure are key factors enabling the dominance of these regions and segments. The growth potential in emerging markets, coupled with ongoing innovation, ensures continued expansion across all application areas.
Aquaculture Probiotic Clarifier Product Landscape
The Aquaculture Probiotic Clarifier market is characterized by a dynamic product landscape focused on developing highly effective and sustainable biological solutions. Innovations are centered on creating multi-strain probiotic formulations with specific functionalities, such as enhanced decomposition of organic waste, reduction of ammonia and nitrite levels, and suppression of pathogenic bacteria. Products are designed for optimal performance in both freshwater aquaculture and saltwater aquaculture environments, addressing the unique microbial challenges of each. Key applications include improving water clarity, boosting immune systems of aquatic organisms, and reducing the incidence of diseases, thereby improving feed conversion ratios and overall production yields. Unique selling propositions often revolve around the specificity of the probiotic strains, their environmental compatibility, and their ability to contribute to a circular economy within aquaculture systems. Technological advancements are enabling the development of shelf-stable and easy-to-apply probiotic products, making them accessible to a wider range of aquaculturists.
Key Drivers, Barriers & Challenges in Aquaculture Probiotic Clarifier
The Aquaculture Probiotic Clarifier market is propelled by several key drivers, including the escalating global demand for sustainable seafood, increasing awareness of the environmental benefits of biological water treatment, and growing concerns over the impact of chemical alternatives. Technological advancements in microbial science are enabling the development of more effective and targeted probiotic formulations. Supportive government policies promoting sustainable aquaculture and rising investments in R&D further accelerate market growth.
However, significant barriers and challenges exist. A primary challenge is the lack of widespread awareness and understanding of probiotic benefits among some aquaculturists, leading to slow adoption rates. Stringent and varying regulatory landscapes across different regions can hinder market entry and product approval. The relatively higher initial cost of probiotic solutions compared to conventional chemical treatments can also be a deterrent for some farmers. Supply chain complexities and the need for precise handling and storage conditions for live probiotic cultures present logistical hurdles. Furthermore, the competition from established chemical alternatives, though less sustainable, remains a significant competitive pressure.
Emerging Opportunities in Aquaculture Probiotic Clarifier
Emerging opportunities in the Aquaculture Probiotic Clarifier market are abundant and ripe for exploration. The untapped potential in developing economies with expanding aquaculture sectors represents a significant growth avenue. Innovative applications, such as the development of probiotics specifically designed for recirculating aquaculture systems (RAS) and integrated multi-trophic aquaculture (IMTA), offer niche markets. Evolving consumer preferences for "clean label" and sustainably sourced seafood are creating a strong pull for inputs that support these production methods. Furthermore, the integration of probiotics with other bio-technologies, like enzyme applications for waste degradation, presents synergistic opportunities for creating comprehensive aquaculture health management solutions.
Growth Accelerators in the Aquaculture Probiotic Clarifier Industry
Several factors are accelerating long-term growth in the Aquaculture Probiotic Clarifier industry. Technological breakthroughs in genetic engineering and fermentation processes are leading to the creation of more potent and specialized probiotic strains with enhanced functionalities. Strategic partnerships between probiotic manufacturers and aquaculture feed producers are crucial for integrated product offerings and wider market reach. Market expansion strategies, particularly focusing on educating aquaculturists about the economic and environmental advantages of probiotics, are vital. The increasing global focus on food security and sustainable food production will continue to drive demand for solutions that enhance aquaculture productivity and environmental stewardship.
Key Players Shaping the Aquaculture Probiotic Clarifier Market
- Aumenzymes
- ClearBlu
- Novozymes
- QB Labs, LLC
- United Tech
- ENVIRONMENTAL CHOICES
- Fragile Earth
- Organica Biotech
- Afrizymes
- Baxel Co.,Ltd
- Genesis Biosciences
- Tangsons Biotech
- MicroSynergies
Notable Milestones in Aquaculture Probiotic Clarifier Sector
- 2019: Increased research publications highlighting the efficacy of multi-strain probiotics in disease prevention.
- 2020: Launch of novel probiotic formulations targeting specific water quality parameters like ammonia reduction.
- 2021: Growing interest in probiotic applications for shrimp farming due to disease outbreaks in key production regions.
- 2022: Several companies announced strategic partnerships to expand distribution networks for aquaculture probiotics.
- 2023: Emergence of advanced probiotic delivery systems for improved application efficiency.
- 2024: Increased regulatory scrutiny and support for biological solutions in aquaculture, driving market development.
In-Depth Aquaculture Probiotic Clarifier Market Outlook
The future market outlook for Aquaculture Probiotic Clarifiers is exceptionally strong, driven by their pivotal role in achieving sustainable and profitable aquaculture. Growth accelerators, including advancements in microbial science, strategic collaborations, and market education initiatives, will continue to fuel expansion. The increasing demand for responsibly produced seafood, coupled with stringent environmental regulations, positions probiotic clarifiers as indispensable tools for aquaculturists worldwide. Strategic opportunities lie in further developing tailored solutions for emerging aquaculture technologies and expanding into under-penetrated geographical markets, solidifying their position as a cornerstone of modern aquaculture.
Aquaculture Probiotic Clarifier Segmentation
-
1. Application
- 1.1. Fish
- 1.2. Crusceans
- 1.3. Others
-
2. Types
- 2.1. Freshwater
- 2.2. Saltwater
Aquaculture Probiotic Clarifier Segmentation By Geography
-
1. North America
- 1.1. United States
- 1.2. Canada
- 1.3. Mexico
-
2. South America
- 2.1. Brazil
- 2.2. Argentina
- 2.3. Rest of South America
-
3. Europe
- 3.1. United Kingdom
- 3.2. Germany
- 3.3. France
- 3.4. Italy
- 3.5. Spain
- 3.6. Russia
- 3.7. Benelux
- 3.8. Nordics
- 3.9. Rest of Europe
-
4. Middle East & Africa
- 4.1. Turkey
- 4.2. Israel
- 4.3. GCC
- 4.4. North Africa
- 4.5. South Africa
- 4.6. Rest of Middle East & Africa
-
5. Asia Pacific
- 5.1. China
- 5.2. India
- 5.3. Japan
- 5.4. South Korea
- 5.5. ASEAN
- 5.6. Oceania
- 5.7. Rest of Asia Pacific
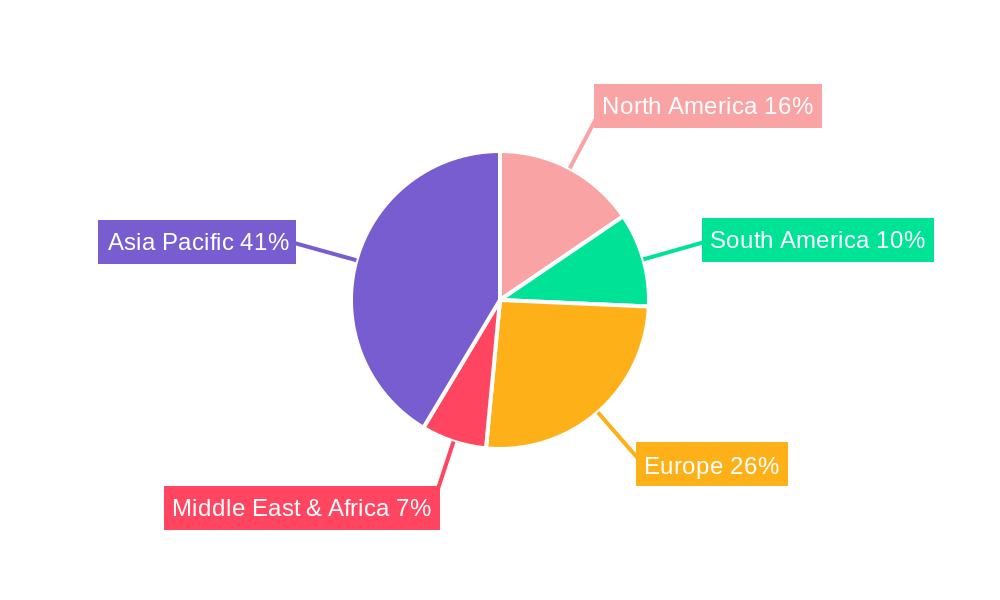
Aquaculture Probiotic Clarifier Regional Market Share
Geographic Coverage of Aquaculture Probiotic Clarifier
Aquaculture Probiotic Clarifier REPORT HIGHLIGHTS
| Aspects | Details |
|---|---|
| Study Period | 2020-2034 |
| Base Year | 2025 |
| Estimated Year | 2026 |
| Forecast Period | 2026-2034 |
| Historical Period | 2020-2025 |
| Growth Rate | CAGR of 7% from 2020-2034 |
| Segmentation |
|
Table of Contents
- 1. Introduction
- 1.1. Research Scope
- 1.2. Market Segmentation
- 1.3. Research Objective
- 1.4. Definitions and Assumptions
- 2. Executive Summary
- 2.1. Market Snapshot
- 3. Market Dynamics
- 3.1. Market Drivers
- 3.2. Market Restrains
- 3.3. Market Trends
- 3.4. Market Opportunities
- 4. Market Factor Analysis
- 4.1. Porters Five Forces
- 4.1.1. Bargaining Power of Suppliers
- 4.1.2. Bargaining Power of Buyers
- 4.1.3. Threat of New Entrants
- 4.1.4. Threat of Substitutes
- 4.1.5. Competitive Rivalry
- 4.2. PESTEL analysis
- 4.3. BCG Analysis
- 4.3.1. Stars (High Growth, High Market Share)
- 4.3.2. Cash Cows (Low Growth, High Market Share)
- 4.3.3. Question Mark (High Growth, Low Market Share)
- 4.3.4. Dogs (Low Growth, Low Market Share)
- 4.4. Ansoff Matrix Analysis
- 4.5. Supply Chain Analysis
- 4.6. Regulatory Landscape
- 4.7. Current Market Potential and Opportunity Assessment (TAM–SAM–SOM Framework)
- 4.8. VDR Analyst Note
- 4.1. Porters Five Forces
- 5. Market Analysis, Insights and Forecast 2021-2033
- 5.1. Market Analysis, Insights and Forecast - by Application
- 5.1.1. Fish
- 5.1.2. Crusceans
- 5.1.3. Others
- 5.2. Market Analysis, Insights and Forecast - by Types
- 5.2.1. Freshwater
- 5.2.2. Saltwater
- 5.3. Market Analysis, Insights and Forecast - by Region
- 5.3.1. North America
- 5.3.2. South America
- 5.3.3. Europe
- 5.3.4. Middle East & Africa
- 5.3.5. Asia Pacific
- 5.1. Market Analysis, Insights and Forecast - by Application
- 6. Global Aquaculture Probiotic Clarifier Analysis, Insights and Forecast, 2021-2033
- 6.1. Market Analysis, Insights and Forecast - by Application
- 6.1.1. Fish
- 6.1.2. Crusceans
- 6.1.3. Others
- 6.2. Market Analysis, Insights and Forecast - by Types
- 6.2.1. Freshwater
- 6.2.2. Saltwater
- 6.1. Market Analysis, Insights and Forecast - by Application
- 7. North America Aquaculture Probiotic Clarifier Analysis, Insights and Forecast, 2021-2033
- 7.1. Market Analysis, Insights and Forecast - by Application
- 7.1.1. Fish
- 7.1.2. Crusceans
- 7.1.3. Others
- 7.2. Market Analysis, Insights and Forecast - by Types
- 7.2.1. Freshwater
- 7.2.2. Saltwater
- 7.1. Market Analysis, Insights and Forecast - by Application
- 8. South America Aquaculture Probiotic Clarifier Analysis, Insights and Forecast, 2021-2033
- 8.1. Market Analysis, Insights and Forecast - by Application
- 8.1.1. Fish
- 8.1.2. Crusceans
- 8.1.3. Others
- 8.2. Market Analysis, Insights and Forecast - by Types
- 8.2.1. Freshwater
- 8.2.2. Saltwater
- 8.1. Market Analysis, Insights and Forecast - by Application
- 9. Europe Aquaculture Probiotic Clarifier Analysis, Insights and Forecast, 2021-2033
- 9.1. Market Analysis, Insights and Forecast - by Application
- 9.1.1. Fish
- 9.1.2. Crusceans
- 9.1.3. Others
- 9.2. Market Analysis, Insights and Forecast - by Types
- 9.2.1. Freshwater
- 9.2.2. Saltwater
- 9.1. Market Analysis, Insights and Forecast - by Application
- 10. Middle East & Africa Aquaculture Probiotic Clarifier Analysis, Insights and Forecast, 2021-2033
- 10.1. Market Analysis, Insights and Forecast - by Application
- 10.1.1. Fish
- 10.1.2. Crusceans
- 10.1.3. Others
- 10.2. Market Analysis, Insights and Forecast - by Types
- 10.2.1. Freshwater
- 10.2.2. Saltwater
- 10.1. Market Analysis, Insights and Forecast - by Application
- 11. Asia Pacific Aquaculture Probiotic Clarifier Analysis, Insights and Forecast, 2021-2033
- 11.1. Market Analysis, Insights and Forecast - by Application
- 11.1.1. Fish
- 11.1.2. Crusceans
- 11.1.3. Others
- 11.2. Market Analysis, Insights and Forecast - by Types
- 11.2.1. Freshwater
- 11.2.2. Saltwater
- 11.1. Market Analysis, Insights and Forecast - by Application
- 12. Competitive Analysis
- 12.1. Company Profiles
- 12.1.1 Aumenzymes
- 12.1.1.1. Company Overview
- 12.1.1.2. Products
- 12.1.1.3. Company Financials
- 12.1.1.4. SWOT Analysis
- 12.1.2 ClearBlu
- 12.1.2.1. Company Overview
- 12.1.2.2. Products
- 12.1.2.3. Company Financials
- 12.1.2.4. SWOT Analysis
- 12.1.3 Novozymes
- 12.1.3.1. Company Overview
- 12.1.3.2. Products
- 12.1.3.3. Company Financials
- 12.1.3.4. SWOT Analysis
- 12.1.4 QB Labs
- 12.1.4.1. Company Overview
- 12.1.4.2. Products
- 12.1.4.3. Company Financials
- 12.1.4.4. SWOT Analysis
- 12.1.5 LLC
- 12.1.5.1. Company Overview
- 12.1.5.2. Products
- 12.1.5.3. Company Financials
- 12.1.5.4. SWOT Analysis
- 12.1.6 United Tech
- 12.1.6.1. Company Overview
- 12.1.6.2. Products
- 12.1.6.3. Company Financials
- 12.1.6.4. SWOT Analysis
- 12.1.7 ENVIRONMENTAL CHOICES
- 12.1.7.1. Company Overview
- 12.1.7.2. Products
- 12.1.7.3. Company Financials
- 12.1.7.4. SWOT Analysis
- 12.1.8 Fragile Earth
- 12.1.8.1. Company Overview
- 12.1.8.2. Products
- 12.1.8.3. Company Financials
- 12.1.8.4. SWOT Analysis
- 12.1.9 Organica Biotech
- 12.1.9.1. Company Overview
- 12.1.9.2. Products
- 12.1.9.3. Company Financials
- 12.1.9.4. SWOT Analysis
- 12.1.10 Afrizymes
- 12.1.10.1. Company Overview
- 12.1.10.2. Products
- 12.1.10.3. Company Financials
- 12.1.10.4. SWOT Analysis
- 12.1.11 Baxel Co.
- 12.1.11.1. Company Overview
- 12.1.11.2. Products
- 12.1.11.3. Company Financials
- 12.1.11.4. SWOT Analysis
- 12.1.12 Ltd
- 12.1.12.1. Company Overview
- 12.1.12.2. Products
- 12.1.12.3. Company Financials
- 12.1.12.4. SWOT Analysis
- 12.1.13 Genesis Biosciences
- 12.1.13.1. Company Overview
- 12.1.13.2. Products
- 12.1.13.3. Company Financials
- 12.1.13.4. SWOT Analysis
- 12.1.14 Tangsons Biotech
- 12.1.14.1. Company Overview
- 12.1.14.2. Products
- 12.1.14.3. Company Financials
- 12.1.14.4. SWOT Analysis
- 12.1.15 MicroSynergies
- 12.1.15.1. Company Overview
- 12.1.15.2. Products
- 12.1.15.3. Company Financials
- 12.1.15.4. SWOT Analysis
- 12.1.1 Aumenzymes
- 12.2. Market Entropy
- 12.2.1 Company's Key Areas Served
- 12.2.2 Recent Developments
- 12.3. Company Market Share Analysis 2025
- 12.3.1 Top 5 Companies Market Share Analysis
- 12.3.2 Top 3 Companies Market Share Analysis
- 12.4. List of Potential Customers
- 13. Research Methodology
List of Figures
- Figure 1: Global Aquaculture Probiotic Clarifier Revenue Breakdown (undefined, %) by Region 2025 & 2033
- Figure 2: Global Aquaculture Probiotic Clarifier Volume Breakdown (K, %) by Region 2025 & 2033
- Figure 3: North America Aquaculture Probiotic Clarifier Revenue (undefined), by Application 2025 & 2033
- Figure 4: North America Aquaculture Probiotic Clarifier Volume (K), by Application 2025 & 2033
- Figure 5: North America Aquaculture Probiotic Clarifier Revenue Share (%), by Application 2025 & 2033
- Figure 6: North America Aquaculture Probiotic Clarifier Volume Share (%), by Application 2025 & 2033
- Figure 7: North America Aquaculture Probiotic Clarifier Revenue (undefined), by Types 2025 & 2033
- Figure 8: North America Aquaculture Probiotic Clarifier Volume (K), by Types 2025 & 2033
- Figure 9: North America Aquaculture Probiotic Clarifier Revenue Share (%), by Types 2025 & 2033
- Figure 10: North America Aquaculture Probiotic Clarifier Volume Share (%), by Types 2025 & 2033
- Figure 11: North America Aquaculture Probiotic Clarifier Revenue (undefined), by Country 2025 & 2033
- Figure 12: North America Aquaculture Probiotic Clarifier Volume (K), by Country 2025 & 2033
- Figure 13: North America Aquaculture Probiotic Clarifier Revenue Share (%), by Country 2025 & 2033
- Figure 14: North America Aquaculture Probiotic Clarifier Volume Share (%), by Country 2025 & 2033
- Figure 15: South America Aquaculture Probiotic Clarifier Revenue (undefined), by Application 2025 & 2033
- Figure 16: South America Aquaculture Probiotic Clarifier Volume (K), by Application 2025 & 2033
- Figure 17: South America Aquaculture Probiotic Clarifier Revenue Share (%), by Application 2025 & 2033
- Figure 18: South America Aquaculture Probiotic Clarifier Volume Share (%), by Application 2025 & 2033
- Figure 19: South America Aquaculture Probiotic Clarifier Revenue (undefined), by Types 2025 & 2033
- Figure 20: South America Aquaculture Probiotic Clarifier Volume (K), by Types 2025 & 2033
- Figure 21: South America Aquaculture Probiotic Clarifier Revenue Share (%), by Types 2025 & 2033
- Figure 22: South America Aquaculture Probiotic Clarifier Volume Share (%), by Types 2025 & 2033
- Figure 23: South America Aquaculture Probiotic Clarifier Revenue (undefined), by Country 2025 & 2033
- Figure 24: South America Aquaculture Probiotic Clarifier Volume (K), by Country 2025 & 2033
- Figure 25: South America Aquaculture Probiotic Clarifier Revenue Share (%), by Country 2025 & 2033
- Figure 26: South America Aquaculture Probiotic Clarifier Volume Share (%), by Country 2025 & 2033
- Figure 27: Europe Aquaculture Probiotic Clarifier Revenue (undefined), by Application 2025 & 2033
- Figure 28: Europe Aquaculture Probiotic Clarifier Volume (K), by Application 2025 & 2033
- Figure 29: Europe Aquaculture Probiotic Clarifier Revenue Share (%), by Application 2025 & 2033
- Figure 30: Europe Aquaculture Probiotic Clarifier Volume Share (%), by Application 2025 & 2033
- Figure 31: Europe Aquaculture Probiotic Clarifier Revenue (undefined), by Types 2025 & 2033
- Figure 32: Europe Aquaculture Probiotic Clarifier Volume (K), by Types 2025 & 2033
- Figure 33: Europe Aquaculture Probiotic Clarifier Revenue Share (%), by Types 2025 & 2033
- Figure 34: Europe Aquaculture Probiotic Clarifier Volume Share (%), by Types 2025 & 2033
- Figure 35: Europe Aquaculture Probiotic Clarifier Revenue (undefined), by Country 2025 & 2033
- Figure 36: Europe Aquaculture Probiotic Clarifier Volume (K), by Country 2025 & 2033
- Figure 37: Europe Aquaculture Probiotic Clarifier Revenue Share (%), by Country 2025 & 2033
- Figure 38: Europe Aquaculture Probiotic Clarifier Volume Share (%), by Country 2025 & 2033
- Figure 39: Middle East & Africa Aquaculture Probiotic Clarifier Revenue (undefined), by Application 2025 & 2033
- Figure 40: Middle East & Africa Aquaculture Probiotic Clarifier Volume (K), by Application 2025 & 2033
- Figure 41: Middle East & Africa Aquaculture Probiotic Clarifier Revenue Share (%), by Application 2025 & 2033
- Figure 42: Middle East & Africa Aquaculture Probiotic Clarifier Volume Share (%), by Application 2025 & 2033
- Figure 43: Middle East & Africa Aquaculture Probiotic Clarifier Revenue (undefined), by Types 2025 & 2033
- Figure 44: Middle East & Africa Aquaculture Probiotic Clarifier Volume (K), by Types 2025 & 2033
- Figure 45: Middle East & Africa Aquaculture Probiotic Clarifier Revenue Share (%), by Types 2025 & 2033
- Figure 46: Middle East & Africa Aquaculture Probiotic Clarifier Volume Share (%), by Types 2025 & 2033
- Figure 47: Middle East & Africa Aquaculture Probiotic Clarifier Revenue (undefined), by Country 2025 & 2033
- Figure 48: Middle East & Africa Aquaculture Probiotic Clarifier Volume (K), by Country 2025 & 2033
- Figure 49: Middle East & Africa Aquaculture Probiotic Clarifier Revenue Share (%), by Country 2025 & 2033
- Figure 50: Middle East & Africa Aquaculture Probiotic Clarifier Volume Share (%), by Country 2025 & 2033
- Figure 51: Asia Pacific Aquaculture Probiotic Clarifier Revenue (undefined), by Application 2025 & 2033
- Figure 52: Asia Pacific Aquaculture Probiotic Clarifier Volume (K), by Application 2025 & 2033
- Figure 53: Asia Pacific Aquaculture Probiotic Clarifier Revenue Share (%), by Application 2025 & 2033
- Figure 54: Asia Pacific Aquaculture Probiotic Clarifier Volume Share (%), by Application 2025 & 2033
- Figure 55: Asia Pacific Aquaculture Probiotic Clarifier Revenue (undefined), by Types 2025 & 2033
- Figure 56: Asia Pacific Aquaculture Probiotic Clarifier Volume (K), by Types 2025 & 2033
- Figure 57: Asia Pacific Aquaculture Probiotic Clarifier Revenue Share (%), by Types 2025 & 2033
- Figure 58: Asia Pacific Aquaculture Probiotic Clarifier Volume Share (%), by Types 2025 & 2033
- Figure 59: Asia Pacific Aquaculture Probiotic Clarifier Revenue (undefined), by Country 2025 & 2033
- Figure 60: Asia Pacific Aquaculture Probiotic Clarifier Volume (K), by Country 2025 & 2033
- Figure 61: Asia Pacific Aquaculture Probiotic Clarifier Revenue Share (%), by Country 2025 & 2033
- Figure 62: Asia Pacific Aquaculture Probiotic Clarifier Volume Share (%), by Country 2025 & 2033
List of Tables
- Table 1: Global Aquaculture Probiotic Clarifier Revenue undefined Forecast, by Application 2020 & 2033
- Table 2: Global Aquaculture Probiotic Clarifier Volume K Forecast, by Application 2020 & 2033
- Table 3: Global Aquaculture Probiotic Clarifier Revenue undefined Forecast, by Types 2020 & 2033
- Table 4: Global Aquaculture Probiotic Clarifier Volume K Forecast, by Types 2020 & 2033
- Table 5: Global Aquaculture Probiotic Clarifier Revenue undefined Forecast, by Region 2020 & 2033
- Table 6: Global Aquaculture Probiotic Clarifier Volume K Forecast, by Region 2020 & 2033
- Table 7: Global Aquaculture Probiotic Clarifier Revenue undefined Forecast, by Application 2020 & 2033
- Table 8: Global Aquaculture Probiotic Clarifier Volume K Forecast, by Application 2020 & 2033
- Table 9: Global Aquaculture Probiotic Clarifier Revenue undefined Forecast, by Types 2020 & 2033
- Table 10: Global Aquaculture Probiotic Clarifier Volume K Forecast, by Types 2020 & 2033
- Table 11: Global Aquaculture Probiotic Clarifier Revenue undefined Forecast, by Country 2020 & 2033
- Table 12: Global Aquaculture Probiotic Clarifier Volume K Forecast, by Country 2020 & 2033
- Table 13: United States Aquaculture Probiotic Clarifier Revenue (undefined) Forecast, by Application 2020 & 2033
- Table 14: United States Aquaculture Probiotic Clarifier Volume (K) Forecast, by Application 2020 & 2033
- Table 15: Canada Aquaculture Probiotic Clarifier Revenue (undefined) Forecast, by Application 2020 & 2033
- Table 16: Canada Aquaculture Probiotic Clarifier Volume (K) Forecast, by Application 2020 & 2033
- Table 17: Mexico Aquaculture Probiotic Clarifier Revenue (undefined) Forecast, by Application 2020 & 2033
- Table 18: Mexico Aquaculture Probiotic Clarifier Volume (K) Forecast, by Application 2020 & 2033
- Table 19: Global Aquaculture Probiotic Clarifier Revenue undefined Forecast, by Application 2020 & 2033
- Table 20: Global Aquaculture Probiotic Clarifier Volume K Forecast, by Application 2020 & 2033
- Table 21: Global Aquaculture Probiotic Clarifier Revenue undefined Forecast, by Types 2020 & 2033
- Table 22: Global Aquaculture Probiotic Clarifier Volume K Forecast, by Types 2020 & 2033
- Table 23: Global Aquaculture Probiotic Clarifier Revenue undefined Forecast, by Country 2020 & 2033
- Table 24: Global Aquaculture Probiotic Clarifier Volume K Forecast, by Country 2020 & 2033
- Table 25: Brazil Aquaculture Probiotic Clarifier Revenue (undefined) Forecast, by Application 2020 & 2033
- Table 26: Brazil Aquaculture Probiotic Clarifier Volume (K) Forecast, by Application 2020 & 2033
- Table 27: Argentina Aquaculture Probiotic Clarifier Revenue (undefined) Forecast, by Application 2020 & 2033
- Table 28: Argentina Aquaculture Probiotic Clarifier Volume (K) Forecast, by Application 2020 & 2033
- Table 29: Rest of South America Aquaculture Probiotic Clarifier Revenue (undefined) Forecast, by Application 2020 & 2033
- Table 30: Rest of South America Aquaculture Probiotic Clarifier Volume (K) Forecast, by Application 2020 & 2033
- Table 31: Global Aquaculture Probiotic Clarifier Revenue undefined Forecast, by Application 2020 & 2033
- Table 32: Global Aquaculture Probiotic Clarifier Volume K Forecast, by Application 2020 & 2033
- Table 33: Global Aquaculture Probiotic Clarifier Revenue undefined Forecast, by Types 2020 & 2033
- Table 34: Global Aquaculture Probiotic Clarifier Volume K Forecast, by Types 2020 & 2033
- Table 35: Global Aquaculture Probiotic Clarifier Revenue undefined Forecast, by Country 2020 & 2033
- Table 36: Global Aquaculture Probiotic Clarifier Volume K Forecast, by Country 2020 & 2033
- Table 37: United Kingdom Aquaculture Probiotic Clarifier Revenue (undefined) Forecast, by Application 2020 & 2033
- Table 38: United Kingdom Aquaculture Probiotic Clarifier Volume (K) Forecast, by Application 2020 & 2033
- Table 39: Germany Aquaculture Probiotic Clarifier Revenue (undefined) Forecast, by Application 2020 & 2033
- Table 40: Germany Aquaculture Probiotic Clarifier Volume (K) Forecast, by Application 2020 & 2033
- Table 41: France Aquaculture Probiotic Clarifier Revenue (undefined) Forecast, by Application 2020 & 2033
- Table 42: France Aquaculture Probiotic Clarifier Volume (K) Forecast, by Application 2020 & 2033
- Table 43: Italy Aquaculture Probiotic Clarifier Revenue (undefined) Forecast, by Application 2020 & 2033
- Table 44: Italy Aquaculture Probiotic Clarifier Volume (K) Forecast, by Application 2020 & 2033
- Table 45: Spain Aquaculture Probiotic Clarifier Revenue (undefined) Forecast, by Application 2020 & 2033
- Table 46: Spain Aquaculture Probiotic Clarifier Volume (K) Forecast, by Application 2020 & 2033
- Table 47: Russia Aquaculture Probiotic Clarifier Revenue (undefined) Forecast, by Application 2020 & 2033
- Table 48: Russia Aquaculture Probiotic Clarifier Volume (K) Forecast, by Application 2020 & 2033
- Table 49: Benelux Aquaculture Probiotic Clarifier Revenue (undefined) Forecast, by Application 2020 & 2033
- Table 50: Benelux Aquaculture Probiotic Clarifier Volume (K) Forecast, by Application 2020 & 2033
- Table 51: Nordics Aquaculture Probiotic Clarifier Revenue (undefined) Forecast, by Application 2020 & 2033
- Table 52: Nordics Aquaculture Probiotic Clarifier Volume (K) Forecast, by Application 2020 & 2033
- Table 53: Rest of Europe Aquaculture Probiotic Clarifier Revenue (undefined) Forecast, by Application 2020 & 2033
- Table 54: Rest of Europe Aquaculture Probiotic Clarifier Volume (K) Forecast, by Application 2020 & 2033
- Table 55: Global Aquaculture Probiotic Clarifier Revenue undefined Forecast, by Application 2020 & 2033
- Table 56: Global Aquaculture Probiotic Clarifier Volume K Forecast, by Application 2020 & 2033
- Table 57: Global Aquaculture Probiotic Clarifier Revenue undefined Forecast, by Types 2020 & 2033
- Table 58: Global Aquaculture Probiotic Clarifier Volume K Forecast, by Types 2020 & 2033
- Table 59: Global Aquaculture Probiotic Clarifier Revenue undefined Forecast, by Country 2020 & 2033
- Table 60: Global Aquaculture Probiotic Clarifier Volume K Forecast, by Country 2020 & 2033
- Table 61: Turkey Aquaculture Probiotic Clarifier Revenue (undefined) Forecast, by Application 2020 & 2033
- Table 62: Turkey Aquaculture Probiotic Clarifier Volume (K) Forecast, by Application 2020 & 2033
- Table 63: Israel Aquaculture Probiotic Clarifier Revenue (undefined) Forecast, by Application 2020 & 2033
- Table 64: Israel Aquaculture Probiotic Clarifier Volume (K) Forecast, by Application 2020 & 2033
- Table 65: GCC Aquaculture Probiotic Clarifier Revenue (undefined) Forecast, by Application 2020 & 2033
- Table 66: GCC Aquaculture Probiotic Clarifier Volume (K) Forecast, by Application 2020 & 2033
- Table 67: North Africa Aquaculture Probiotic Clarifier Revenue (undefined) Forecast, by Application 2020 & 2033
- Table 68: North Africa Aquaculture Probiotic Clarifier Volume (K) Forecast, by Application 2020 & 2033
- Table 69: South Africa Aquaculture Probiotic Clarifier Revenue (undefined) Forecast, by Application 2020 & 2033
- Table 70: South Africa Aquaculture Probiotic Clarifier Volume (K) Forecast, by Application 2020 & 2033
- Table 71: Rest of Middle East & Africa Aquaculture Probiotic Clarifier Revenue (undefined) Forecast, by Application 2020 & 2033
- Table 72: Rest of Middle East & Africa Aquaculture Probiotic Clarifier Volume (K) Forecast, by Application 2020 & 2033
- Table 73: Global Aquaculture Probiotic Clarifier Revenue undefined Forecast, by Application 2020 & 2033
- Table 74: Global Aquaculture Probiotic Clarifier Volume K Forecast, by Application 2020 & 2033
- Table 75: Global Aquaculture Probiotic Clarifier Revenue undefined Forecast, by Types 2020 & 2033
- Table 76: Global Aquaculture Probiotic Clarifier Volume K Forecast, by Types 2020 & 2033
- Table 77: Global Aquaculture Probiotic Clarifier Revenue undefined Forecast, by Country 2020 & 2033
- Table 78: Global Aquaculture Probiotic Clarifier Volume K Forecast, by Country 2020 & 2033
- Table 79: China Aquaculture Probiotic Clarifier Revenue (undefined) Forecast, by Application 2020 & 2033
- Table 80: China Aquaculture Probiotic Clarifier Volume (K) Forecast, by Application 2020 & 2033
- Table 81: India Aquaculture Probiotic Clarifier Revenue (undefined) Forecast, by Application 2020 & 2033
- Table 82: India Aquaculture Probiotic Clarifier Volume (K) Forecast, by Application 2020 & 2033
- Table 83: Japan Aquaculture Probiotic Clarifier Revenue (undefined) Forecast, by Application 2020 & 2033
- Table 84: Japan Aquaculture Probiotic Clarifier Volume (K) Forecast, by Application 2020 & 2033
- Table 85: South Korea Aquaculture Probiotic Clarifier Revenue (undefined) Forecast, by Application 2020 & 2033
- Table 86: South Korea Aquaculture Probiotic Clarifier Volume (K) Forecast, by Application 2020 & 2033
- Table 87: ASEAN Aquaculture Probiotic Clarifier Revenue (undefined) Forecast, by Application 2020 & 2033
- Table 88: ASEAN Aquaculture Probiotic Clarifier Volume (K) Forecast, by Application 2020 & 2033
- Table 89: Oceania Aquaculture Probiotic Clarifier Revenue (undefined) Forecast, by Application 2020 & 2033
- Table 90: Oceania Aquaculture Probiotic Clarifier Volume (K) Forecast, by Application 2020 & 2033
- Table 91: Rest of Asia Pacific Aquaculture Probiotic Clarifier Revenue (undefined) Forecast, by Application 2020 & 2033
- Table 92: Rest of Asia Pacific Aquaculture Probiotic Clarifier Volume (K) Forecast, by Application 2020 & 2033
Frequently Asked Questions
1. What is the projected Compound Annual Growth Rate (CAGR) of the Aquaculture Probiotic Clarifier?
The projected CAGR is approximately 7%.
2. Which companies are prominent players in the Aquaculture Probiotic Clarifier?
Key companies in the market include Aumenzymes, ClearBlu, Novozymes, QB Labs, LLC, United Tech, ENVIRONMENTAL CHOICES, Fragile Earth, Organica Biotech, Afrizymes, Baxel Co., Ltd, Genesis Biosciences, Tangsons Biotech, MicroSynergies.
3. What are the main segments of the Aquaculture Probiotic Clarifier?
The market segments include Application, Types.
4. Can you provide details about the market size?
The market size is estimated to be USD XXX N/A as of 2022.
5. What are some drivers contributing to market growth?
N/A
6. What are the notable trends driving market growth?
N/A
7. Are there any restraints impacting market growth?
N/A
8. Can you provide examples of recent developments in the market?
N/A
9. What pricing options are available for accessing the report?
Pricing options include single-user, multi-user, and enterprise licenses priced at USD 3350.00, USD 5025.00, and USD 6700.00 respectively.
10. Is the market size provided in terms of value or volume?
The market size is provided in terms of value, measured in N/A and volume, measured in K.
11. Are there any specific market keywords associated with the report?
Yes, the market keyword associated with the report is "Aquaculture Probiotic Clarifier," which aids in identifying and referencing the specific market segment covered.
12. How do I determine which pricing option suits my needs best?
The pricing options vary based on user requirements and access needs. Individual users may opt for single-user licenses, while businesses requiring broader access may choose multi-user or enterprise licenses for cost-effective access to the report.
13. Are there any additional resources or data provided in the Aquaculture Probiotic Clarifier report?
While the report offers comprehensive insights, it's advisable to review the specific contents or supplementary materials provided to ascertain if additional resources or data are available.
14. How can I stay updated on further developments or reports in the Aquaculture Probiotic Clarifier?
To stay informed about further developments, trends, and reports in the Aquaculture Probiotic Clarifier, consider subscribing to industry newsletters, following relevant companies and organizations, or regularly checking reputable industry news sources and publications.
Methodology
Step 1 - Identification of Relevant Samples Size from Population Database


Step 2 - Approaches for Defining Global Market Size (Value, Volume* & Price*)

Note*: In applicable scenarios
Step 3 - Data Sources
Primary Research
- Web Analytics
- Survey Reports
- Research Institute
- Latest Research Reports
- Opinion Leaders
Secondary Research
- Annual Reports
- White Paper
- Latest Press Release
- Industry Association
- Paid Database
- Investor Presentations

Step 4 - Data Triangulation
Involves using different sources of information in order to increase the validity of a study
These sources are likely to be stakeholders in a program - participants, other researchers, program staff, other community members, and so on.
Then we put all data in single framework & apply various statistical tools to find out the dynamic on the market.
During the analysis stage, feedback from the stakeholder groups would be compared to determine areas of agreement as well as areas of divergence