

Key Insights
The U.S. crop protection chemicals market is projected to reach an estimated $16.9 billion in 2025, exhibiting a steady compound annual growth rate (CAGR) of 3.96% throughout the forecast period of 2025-2033. This sustained growth is underpinned by several critical drivers, including the increasing global demand for food production, necessitating enhanced crop yields and quality, and the continuous innovation in developing more targeted and environmentally conscious pest and disease management solutions. Farmers are increasingly adopting advanced crop protection strategies to mitigate losses from a wide array of threats, from fungal infections and insect infestations to invasive weeds and nematodes. The market is being significantly shaped by the growing preference for integrated pest management (IPM) approaches, which combine chemical applications with biological controls and cultural practices, as well as the rising adoption of precision agriculture techniques that optimize the application of these chemicals, reducing waste and environmental impact.
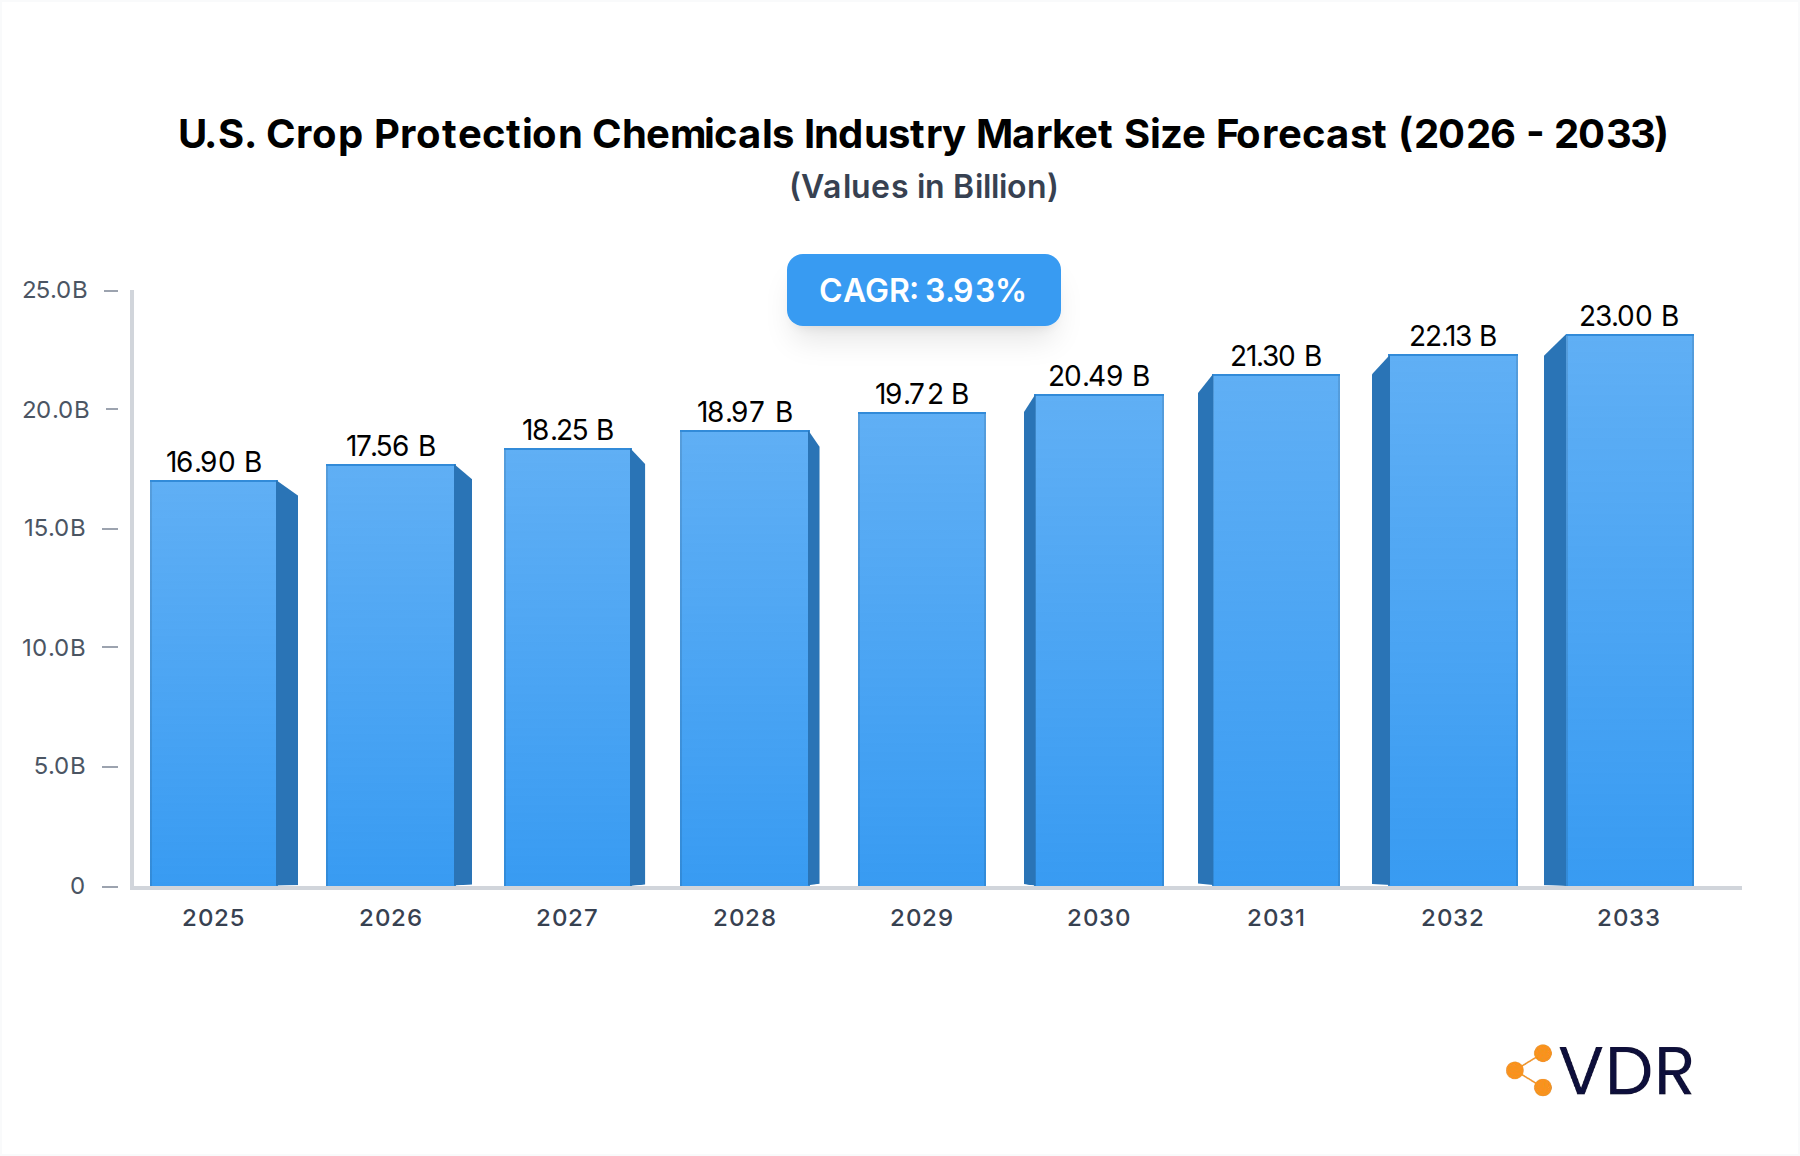
U.S. Crop Protection Chemicals Industry Market Size (In Billion)
Key trends further fueling this market expansion include the development of next-generation fungicides, herbicides, and insecticides with improved efficacy and reduced environmental persistence. Seed treatment technologies are gaining considerable traction, offering early-stage protection against pests and diseases, thereby improving germination rates and seedling vigor. Chemigation and foliar application methods are also seeing increased uptake due to their efficiency in delivering active ingredients directly to the plant or soil. However, the market also faces certain restraints, such as evolving regulatory landscapes and growing consumer demand for organic produce, which can impact the market share of synthetic crop protection chemicals. Despite these challenges, the necessity to safeguard agricultural output against escalating biotic stresses ensures a robust and resilient market for crop protection solutions.

U.S. Crop Protection Chemicals Industry Company Market Share
U.S. Crop Protection Chemicals Industry: Comprehensive Market Analysis and Forecast 2019-2033
This comprehensive report delivers an in-depth analysis of the U.S. Crop Protection Chemicals Industry, encompassing a detailed market structure, growth trends, regional dominance, product landscape, key drivers, barriers, and emerging opportunities. Leveraging extensive data from 2019-2024 (Historical Period) and projecting forward to 2033 (Forecast Period), with a Base Year and Estimated Year of 2025, this report offers critical insights for stakeholders seeking to navigate this dynamic sector. Explore parent and child market segments, including functions like fungicides, herbicides, and insecticides, application modes such as chemigation and foliar, and crop types from commercial crops to grains & cereals, to understand the intricate market dynamics and identify lucrative growth avenues. All values are presented in billions of U.S. dollars.
U.S. Crop Protection Chemicals Industry Market Dynamics & Structure
The U.S. Crop Protection Chemicals Industry is characterized by a moderate to high degree of market concentration, with several multinational corporations holding significant market shares. Technological innovation is a primary driver, fueled by the continuous need for more effective, sustainable, and pest-resistant crop protection solutions. Regulatory frameworks, overseen by bodies like the Environmental Protection Agency (EPA), play a crucial role in shaping product development and market access, often acting as a barrier to entry for smaller players and necessitating substantial investment in research and development for new product registrations. Competitive product substitutes, including biological pest control agents and genetically modified crops with inherent resistance, are increasingly influencing market dynamics, prompting traditional chemical manufacturers to diversify their portfolios. End-user demographics, primarily commercial farmers and agricultural cooperatives, are influenced by factors such as farm size, crop specialization, and adoption of precision agriculture technologies. Mergers and acquisitions (M&A) have been a significant trend, consolidating market power and expanding product offerings.
- Market Concentration: Dominated by key players like Bayer AG, Syngenta Group, and BASF SE, indicating a competitive yet consolidated landscape.
- Technological Innovation Drivers: Focus on novel active ingredients, improved formulations for enhanced efficacy and reduced environmental impact, and integration with digital farming solutions.
- Regulatory Frameworks: Stringent approval processes impacting R&D timelines and market entry, with a growing emphasis on environmental and human health safety.
- Competitive Product Substitutes: Rise of biopesticides, bio-stimulants, and precision agriculture tools presenting alternative solutions.
- End-User Demographics: Farmers seeking cost-effective, high-yield solutions with increasing awareness of sustainable practices.
- M&A Trends: Strategic acquisitions aimed at portfolio expansion, market share consolidation, and R&D synergy.
U.S. Crop Protection Chemicals Industry Growth Trends & Insights
The U.S. Crop Protection Chemicals Industry is projected to experience robust growth driven by increasing global food demand, evolving agricultural practices, and the persistent threat of pests and diseases. The market size has shown consistent expansion, fueled by rising adoption rates of advanced crop protection technologies among U.S. farmers. Technological disruptions, such as the development of targeted delivery systems and precision application methods, are transforming how crop protection chemicals are utilized, leading to improved efficiency and reduced environmental footprint. Consumer behavior shifts, including a growing preference for sustainably grown produce and increased demand for food security, are indirectly influencing the need for effective crop protection to ensure stable yields. The Compound Annual Growth Rate (CAGR) is anticipated to remain healthy throughout the forecast period, driven by ongoing innovation and the essential nature of these products for modern agriculture. Market penetration of advanced formulations and integrated pest management solutions is expected to increase significantly.
- Market Size Evolution: Projected to reach an estimated market value of $XX billion by 2033, showcasing consistent upward trajectory.
- Adoption Rates: Increasing adoption of integrated pest management (IPM) strategies and digital farming tools enhancing the utilization of crop protection chemicals.
- Technological Disruptions: Advancement in formulation technologies (e.g., nano-formulations) and precision agriculture leading to more targeted and efficient application.
- Consumer Behavior Shifts: Growing consumer demand for food security and sustainably produced goods, indirectly boosting the need for effective crop protection.
- CAGR: Expected to grow at a CAGR of approximately XX% from 2025 to 2033.
- Market Penetration: Increasing penetration of seed treatment and chemigation application modes due to their efficiency and targeted delivery.
Dominant Regions, Countries, or Segments in U.S. Crop Protection Chemicals Industry
Within the U.S. Crop Protection Chemicals Industry, the Grains & Cereals crop type segment consistently drives market growth, closely followed by Commercial Crops. This dominance is attributed to the vast acreage dedicated to grains like corn, wheat, and soybeans, which are susceptible to a wide range of pests and diseases requiring comprehensive protection. The Herbicide function segment represents the largest share within the industry, reflecting the continuous battle against weed infestation that impacts crop yields and quality. In terms of application mode, Foliar application remains prevalent due to its versatility and effectiveness across various crop types and pest pressures.
- Crop Type Dominance:
- Grains & Cereals: The largest segment due to extensive cultivation area and significant pest/disease challenges, particularly for corn and soybeans. This segment contributes approximately XX% to the total market value.
- Commercial Crops: A substantial contributor, encompassing a diverse range of crops requiring specialized protection strategies.
- Function Dominance:
- Herbicide: The leading function, accounting for an estimated XX% of the market, driven by the persistent need to manage weed competition.
- Fungicide and Insecticide: These segments also hold significant market share due to crop-specific vulnerabilities and seasonal pest outbreaks.
- Application Mode Dominance:
- Foliar: The most widely adopted application mode, offering flexibility for broad-spectrum protection. Estimated to account for XX% of the application market.
- Seed Treatment: Growing in importance due to its targeted approach and ability to protect young seedlings from early-stage threats.
U.S. Crop Protection Chemicals Industry Product Landscape
The U.S. Crop Protection Chemicals Industry is witnessing continuous product innovation focused on enhancing efficacy, improving safety profiles, and reducing environmental impact. Companies are investing heavily in developing novel active ingredients and advanced formulations that offer targeted action against specific pests and diseases, thereby minimizing off-target effects. Unique selling propositions include the development of low-toxicity products, enhanced residual activity, and synergistic combinations of active ingredients for broader spectrum control. Technological advancements are evident in the creation of smart delivery systems, microencapsulation techniques for controlled release, and the integration of biological agents with traditional chemical solutions, offering farmers a more sustainable and effective approach to crop protection.
Key Drivers, Barriers & Challenges in U.S. Crop Protection Chemicals Industry
Key Drivers:
- Growing Global Food Demand: The imperative to feed a growing global population necessitates efficient crop production, driving demand for crop protection chemicals.
- Technological Advancements: Innovations in formulation, delivery systems, and active ingredients enhance product efficacy and sustainability.
- Climate Change Impacts: Changing weather patterns and increased pest and disease pressure due to climate change necessitate more robust crop protection strategies.
- Government Initiatives: Support for agricultural productivity and food security often translates to favorable policies for the crop protection industry.
Barriers & Challenges:
- Stringent Regulatory Landscape: The complex and lengthy approval process for new crop protection chemicals poses a significant barrier.
- Pest Resistance: The evolution of pest resistance to existing chemicals requires continuous R&D investment for new solutions.
- Environmental Concerns and Public Perception: Increasing awareness and scrutiny regarding the environmental and health impacts of chemicals can lead to market resistance and stricter regulations.
- Supply Chain Disruptions: Global supply chain volatility can impact the availability and cost of raw materials and finished products. The estimated impact of these challenges can lead to a XX% increase in operational costs.
Emerging Opportunities in U.S. Crop Protection Chemicals Industry
Emerging opportunities within the U.S. Crop Protection Chemicals Industry lie in the development and adoption of integrated pest management (IPM) solutions that combine chemical, biological, and cultural control methods. The growing demand for sustainable and organic farming practices is spurring innovation in biopesticides and natural compounds. Furthermore, the expansion of precision agriculture technologies, including drone application and sensor-based monitoring, presents opportunities for highly targeted and efficient use of crop protection chemicals, reducing waste and environmental impact. Untapped markets include specialized niche crops and regions with developing agricultural sectors seeking to improve yield and quality.
Growth Accelerators in the U.S. Crop Protection Chemicals Industry Industry
Long-term growth in the U.S. Crop Protection Chemicals Industry will be accelerated by continued technological breakthroughs in areas such as gene editing for pest resistance, advanced formulation technologies for enhanced efficacy and reduced environmental impact, and the development of novel, more environmentally benign active ingredients. Strategic partnerships between chemical manufacturers, research institutions, and technology providers will foster innovation and expedite product development. Market expansion strategies, including the development of products tailored to specific regional needs and the penetration of emerging agricultural sectors, will also contribute significantly to sustained growth.
Key Players Shaping the U.S. Crop Protection Chemicals Industry Market
- Sumitomo Chemical Co Ltd
- American Vanguard Corporation
- ADAMA Agricultural Solutions Ltd
- Bayer AG
- Syngenta Group
- BASF SE
- FMC Corporation
- UPL Limited
- Corteva Agriscience
- Nufarm Ltd
Notable Milestones in U.S. Crop Protection Chemicals Industry Sector
- April 2023: Nufarm launched a new liquid formulation fungicide, Tourney EZ, exclusively for turf and ornamental crops based on customer demand, further strengthening its position in the turf and ornamental segment.
- March 2023: AMVAC launched a portfolio of herbicides, including Impact Core and Sinate, to combat weed resistance in maize, addressing a critical challenge for corn growers.
- January 2023: Bayer formed a new partnership with Oerth Bio to enhance crop protection technology and create more eco-friendly crop protection solutions, signaling a commitment to sustainable innovation.
In-Depth U.S. Crop Protection Chemicals Industry Market Outlook
The outlook for the U.S. Crop Protection Chemicals Industry remains highly promising, driven by the relentless pursuit of food security and agricultural sustainability. Growth accelerators such as advancements in precision agriculture and the development of novel, environmentally conscious formulations will continue to shape the market. Strategic partnerships and a focus on integrated pest management strategies are poised to unlock new avenues for innovation and market penetration. The industry is expected to witness increased investment in R&D, focusing on solutions that balance efficacy with ecological responsibility, ensuring long-term growth and resilience in the face of evolving agricultural challenges. The market is projected to expand significantly, offering substantial opportunities for companies that can adapt to changing regulatory landscapes and meet the evolving demands of modern agriculture.
U.S. Crop Protection Chemicals Industry Segmentation
-
1. Function
- 1.1. Fungicide
- 1.2. Herbicide
- 1.3. Insecticide
- 1.4. Molluscicide
- 1.5. Nematicide
-
2. Application Mode
- 2.1. Chemigation
- 2.2. Foliar
- 2.3. Fumigation
- 2.4. Seed Treatment
- 2.5. Soil Treatment
-
3. Crop Type
- 3.1. Commercial Crops
- 3.2. Fruits & Vegetables
- 3.3. Grains & Cereals
- 3.4. Pulses & Oilseeds
- 3.5. Turf & Ornamental
-
4. Function
- 4.1. Fungicide
- 4.2. Herbicide
- 4.3. Insecticide
- 4.4. Molluscicide
- 4.5. Nematicide
-
5. Application Mode
- 5.1. Chemigation
- 5.2. Foliar
- 5.3. Fumigation
- 5.4. Seed Treatment
- 5.5. Soil Treatment
-
6. Crop Type
- 6.1. Commercial Crops
- 6.2. Fruits & Vegetables
- 6.3. Grains & Cereals
- 6.4. Pulses & Oilseeds
- 6.5. Turf & Ornamental
U.S. Crop Protection Chemicals Industry Segmentation By Geography
- 1. U.S.
U.S. Crop Protection Chemicals Industry Regional Market Share
Geographic Coverage of U.S. Crop Protection Chemicals Industry
U.S. Crop Protection Chemicals Industry REPORT HIGHLIGHTS
| Aspects | Details |
|---|---|
| Study Period | 2020-2034 |
| Base Year | 2025 |
| Estimated Year | 2026 |
| Forecast Period | 2026-2034 |
| Historical Period | 2020-2025 |
| Growth Rate | CAGR of 5% from 2020-2034 |
| Segmentation |
|
Table of Contents
- 1. Introduction
- 1.1. Research Scope
- 1.2. Market Segmentation
- 1.3. Research Objective
- 1.4. Definitions and Assumptions
- 2. Executive Summary
- 2.1. Market Snapshot
- 3. Market Dynamics
- 3.1. Market Drivers
- 3.2. Market Restrains
- 3.3. Market Trends
- 3.4. Market Opportunities
- 4. Market Factor Analysis
- 4.1. Porters Five Forces
- 4.1.1. Bargaining Power of Suppliers
- 4.1.2. Bargaining Power of Buyers
- 4.1.3. Threat of New Entrants
- 4.1.4. Threat of Substitutes
- 4.1.5. Competitive Rivalry
- 4.2. PESTEL analysis
- 4.3. BCG Analysis
- 4.3.1. Stars (High Growth, High Market Share)
- 4.3.2. Cash Cows (Low Growth, High Market Share)
- 4.3.3. Question Mark (High Growth, Low Market Share)
- 4.3.4. Dogs (Low Growth, Low Market Share)
- 4.4. Ansoff Matrix Analysis
- 4.5. Supply Chain Analysis
- 4.6. Regulatory Landscape
- 4.7. Current Market Potential and Opportunity Assessment (TAM–SAM–SOM Framework)
- 4.8. VDR Analyst Note
- 4.1. Porters Five Forces
- 5. Market Analysis, Insights and Forecast 2021-2033
- 5.1. Market Analysis, Insights and Forecast - by Function
- 5.1.1. Fungicide
- 5.1.2. Herbicide
- 5.1.3. Insecticide
- 5.1.4. Molluscicide
- 5.1.5. Nematicide
- 5.2. Market Analysis, Insights and Forecast - by Application Mode
- 5.2.1. Chemigation
- 5.2.2. Foliar
- 5.2.3. Fumigation
- 5.2.4. Seed Treatment
- 5.2.5. Soil Treatment
- 5.3. Market Analysis, Insights and Forecast - by Crop Type
- 5.3.1. Commercial Crops
- 5.3.2. Fruits & Vegetables
- 5.3.3. Grains & Cereals
- 5.3.4. Pulses & Oilseeds
- 5.3.5. Turf & Ornamental
- 5.4. Market Analysis, Insights and Forecast - by Function
- 5.4.1. Fungicide
- 5.4.2. Herbicide
- 5.4.3. Insecticide
- 5.4.4. Molluscicide
- 5.4.5. Nematicide
- 5.5. Market Analysis, Insights and Forecast - by Application Mode
- 5.5.1. Chemigation
- 5.5.2. Foliar
- 5.5.3. Fumigation
- 5.5.4. Seed Treatment
- 5.5.5. Soil Treatment
- 5.6. Market Analysis, Insights and Forecast - by Crop Type
- 5.6.1. Commercial Crops
- 5.6.2. Fruits & Vegetables
- 5.6.3. Grains & Cereals
- 5.6.4. Pulses & Oilseeds
- 5.6.5. Turf & Ornamental
- 5.7. Market Analysis, Insights and Forecast - by Region
- 5.7.1. U.S.
- 5.1. Market Analysis, Insights and Forecast - by Function
- 6. U.S. Crop Protection Chemicals Industry Analysis, Insights and Forecast, 2021-2033
- 6.1. Market Analysis, Insights and Forecast - by Function
- 6.1.1. Fungicide
- 6.1.2. Herbicide
- 6.1.3. Insecticide
- 6.1.4. Molluscicide
- 6.1.5. Nematicide
- 6.2. Market Analysis, Insights and Forecast - by Application Mode
- 6.2.1. Chemigation
- 6.2.2. Foliar
- 6.2.3. Fumigation
- 6.2.4. Seed Treatment
- 6.2.5. Soil Treatment
- 6.3. Market Analysis, Insights and Forecast - by Crop Type
- 6.3.1. Commercial Crops
- 6.3.2. Fruits & Vegetables
- 6.3.3. Grains & Cereals
- 6.3.4. Pulses & Oilseeds
- 6.3.5. Turf & Ornamental
- 6.4. Market Analysis, Insights and Forecast - by Function
- 6.4.1. Fungicide
- 6.4.2. Herbicide
- 6.4.3. Insecticide
- 6.4.4. Molluscicide
- 6.4.5. Nematicide
- 6.5. Market Analysis, Insights and Forecast - by Application Mode
- 6.5.1. Chemigation
- 6.5.2. Foliar
- 6.5.3. Fumigation
- 6.5.4. Seed Treatment
- 6.5.5. Soil Treatment
- 6.6. Market Analysis, Insights and Forecast - by Crop Type
- 6.6.1. Commercial Crops
- 6.6.2. Fruits & Vegetables
- 6.6.3. Grains & Cereals
- 6.6.4. Pulses & Oilseeds
- 6.6.5. Turf & Ornamental
- 6.1. Market Analysis, Insights and Forecast - by Function
- 7. Competitive Analysis
- 7.1. Company Profiles
- 7.1.1 Sumitomo Chemical Co Ltd
- 7.1.1.1. Company Overview
- 7.1.1.2. Products
- 7.1.1.3. Company Financials
- 7.1.1.4. SWOT Analysis
- 7.1.2 American Vanguard Corporation
- 7.1.2.1. Company Overview
- 7.1.2.2. Products
- 7.1.2.3. Company Financials
- 7.1.2.4. SWOT Analysis
- 7.1.3 ADAMA Agricultural Solutions Ltd
- 7.1.3.1. Company Overview
- 7.1.3.2. Products
- 7.1.3.3. Company Financials
- 7.1.3.4. SWOT Analysis
- 7.1.4 Bayer AG
- 7.1.4.1. Company Overview
- 7.1.4.2. Products
- 7.1.4.3. Company Financials
- 7.1.4.4. SWOT Analysis
- 7.1.5 Syngenta Group
- 7.1.5.1. Company Overview
- 7.1.5.2. Products
- 7.1.5.3. Company Financials
- 7.1.5.4. SWOT Analysis
- 7.1.6 BASF SE
- 7.1.6.1. Company Overview
- 7.1.6.2. Products
- 7.1.6.3. Company Financials
- 7.1.6.4. SWOT Analysis
- 7.1.7 FMC Corporation
- 7.1.7.1. Company Overview
- 7.1.7.2. Products
- 7.1.7.3. Company Financials
- 7.1.7.4. SWOT Analysis
- 7.1.8 UPL Limite
- 7.1.8.1. Company Overview
- 7.1.8.2. Products
- 7.1.8.3. Company Financials
- 7.1.8.4. SWOT Analysis
- 7.1.9 Corteva Agriscience
- 7.1.9.1. Company Overview
- 7.1.9.2. Products
- 7.1.9.3. Company Financials
- 7.1.9.4. SWOT Analysis
- 7.1.10 Nufarm Ltd
- 7.1.10.1. Company Overview
- 7.1.10.2. Products
- 7.1.10.3. Company Financials
- 7.1.10.4. SWOT Analysis
- 7.1.1 Sumitomo Chemical Co Ltd
- 7.2. Market Entropy
- 7.2.1 Company's Key Areas Served
- 7.2.2 Recent Developments
- 7.3. Company Market Share Analysis 2025
- 7.3.1 Top 5 Companies Market Share Analysis
- 7.3.2 Top 3 Companies Market Share Analysis
- 7.4. List of Potential Customers
- 8. Research Methodology
List of Figures
- Figure 1: U.S. Crop Protection Chemicals Industry Revenue Breakdown (billion, %) by Product 2025 & 2033
- Figure 2: U.S. Crop Protection Chemicals Industry Share (%) by Company 2025
List of Tables
- Table 1: U.S. Crop Protection Chemicals Industry Revenue billion Forecast, by Function 2020 & 2033
- Table 2: U.S. Crop Protection Chemicals Industry Volume Kiloton Forecast, by Function 2020 & 2033
- Table 3: U.S. Crop Protection Chemicals Industry Revenue billion Forecast, by Application Mode 2020 & 2033
- Table 4: U.S. Crop Protection Chemicals Industry Volume Kiloton Forecast, by Application Mode 2020 & 2033
- Table 5: U.S. Crop Protection Chemicals Industry Revenue billion Forecast, by Crop Type 2020 & 2033
- Table 6: U.S. Crop Protection Chemicals Industry Volume Kiloton Forecast, by Crop Type 2020 & 2033
- Table 7: U.S. Crop Protection Chemicals Industry Revenue billion Forecast, by Function 2020 & 2033
- Table 8: U.S. Crop Protection Chemicals Industry Volume Kiloton Forecast, by Function 2020 & 2033
- Table 9: U.S. Crop Protection Chemicals Industry Revenue billion Forecast, by Application Mode 2020 & 2033
- Table 10: U.S. Crop Protection Chemicals Industry Volume Kiloton Forecast, by Application Mode 2020 & 2033
- Table 11: U.S. Crop Protection Chemicals Industry Revenue billion Forecast, by Crop Type 2020 & 2033
- Table 12: U.S. Crop Protection Chemicals Industry Volume Kiloton Forecast, by Crop Type 2020 & 2033
- Table 13: U.S. Crop Protection Chemicals Industry Revenue billion Forecast, by Region 2020 & 2033
- Table 14: U.S. Crop Protection Chemicals Industry Volume Kiloton Forecast, by Region 2020 & 2033
- Table 15: U.S. Crop Protection Chemicals Industry Revenue billion Forecast, by Function 2020 & 2033
- Table 16: U.S. Crop Protection Chemicals Industry Volume Kiloton Forecast, by Function 2020 & 2033
- Table 17: U.S. Crop Protection Chemicals Industry Revenue billion Forecast, by Application Mode 2020 & 2033
- Table 18: U.S. Crop Protection Chemicals Industry Volume Kiloton Forecast, by Application Mode 2020 & 2033
- Table 19: U.S. Crop Protection Chemicals Industry Revenue billion Forecast, by Crop Type 2020 & 2033
- Table 20: U.S. Crop Protection Chemicals Industry Volume Kiloton Forecast, by Crop Type 2020 & 2033
- Table 21: U.S. Crop Protection Chemicals Industry Revenue billion Forecast, by Function 2020 & 2033
- Table 22: U.S. Crop Protection Chemicals Industry Volume Kiloton Forecast, by Function 2020 & 2033
- Table 23: U.S. Crop Protection Chemicals Industry Revenue billion Forecast, by Application Mode 2020 & 2033
- Table 24: U.S. Crop Protection Chemicals Industry Volume Kiloton Forecast, by Application Mode 2020 & 2033
- Table 25: U.S. Crop Protection Chemicals Industry Revenue billion Forecast, by Crop Type 2020 & 2033
- Table 26: U.S. Crop Protection Chemicals Industry Volume Kiloton Forecast, by Crop Type 2020 & 2033
- Table 27: U.S. Crop Protection Chemicals Industry Revenue billion Forecast, by Country 2020 & 2033
- Table 28: U.S. Crop Protection Chemicals Industry Volume Kiloton Forecast, by Country 2020 & 2033
Frequently Asked Questions
1. What is the projected Compound Annual Growth Rate (CAGR) of the U.S. Crop Protection Chemicals Industry?
The projected CAGR is approximately 5%.
2. Which companies are prominent players in the U.S. Crop Protection Chemicals Industry?
Key companies in the market include Sumitomo Chemical Co Ltd, American Vanguard Corporation, ADAMA Agricultural Solutions Ltd, Bayer AG, Syngenta Group, BASF SE, FMC Corporation, UPL Limite, Corteva Agriscience, Nufarm Ltd.
3. What are the main segments of the U.S. Crop Protection Chemicals Industry?
The market segments include Function, Application Mode, Crop Type, Function, Application Mode, Crop Type.
4. Can you provide details about the market size?
The market size is estimated to be USD 83.32 billion as of 2022.
5. What are some drivers contributing to market growth?
Seed Treatment As A Solution To Enhance Yield; Growing Awareness For Seed Treatment Among The Farmers; Rising Trend Of Organic Farming.
6. What are the notable trends driving market growth?
Rise in weed infestations. shortage of labor. increased wages. and need for higher food production may drive the herbicide market in the country.
7. Are there any restraints impacting market growth?
Limitations Across Farm-Level Seed Treatment; Rising Environmental Concerns.
8. Can you provide examples of recent developments in the market?
April 2023: Nufarm launched a new liquid formulation fungicide, Tourney EZ, exclusively for turf and ornamental crops based on customer demand, which further strengthens the company's role in turf and ornamental crop protection.March 2023: AMVAC launched a portfolio of herbicides, including Impact Core and Sinate, to combat weed resistance in maize.January 2023: Bayer formed a new partnership with Oerth Bio to enhance crop protection technology and create more eco-friendly crop protection solutions.
9. What pricing options are available for accessing the report?
Pricing options include single-user, multi-user, and enterprise licenses priced at USD 3800, USD 4500, and USD 5800 respectively.
10. Is the market size provided in terms of value or volume?
The market size is provided in terms of value, measured in billion and volume, measured in Kiloton.
11. Are there any specific market keywords associated with the report?
Yes, the market keyword associated with the report is "U.S. Crop Protection Chemicals Industry," which aids in identifying and referencing the specific market segment covered.
12. How do I determine which pricing option suits my needs best?
The pricing options vary based on user requirements and access needs. Individual users may opt for single-user licenses, while businesses requiring broader access may choose multi-user or enterprise licenses for cost-effective access to the report.
13. Are there any additional resources or data provided in the U.S. Crop Protection Chemicals Industry report?
While the report offers comprehensive insights, it's advisable to review the specific contents or supplementary materials provided to ascertain if additional resources or data are available.
14. How can I stay updated on further developments or reports in the U.S. Crop Protection Chemicals Industry?
To stay informed about further developments, trends, and reports in the U.S. Crop Protection Chemicals Industry, consider subscribing to industry newsletters, following relevant companies and organizations, or regularly checking reputable industry news sources and publications.
Methodology
Step 1 - Identification of Relevant Samples Size from Population Database


Step 2 - Approaches for Defining Global Market Size (Value, Volume* & Price*)

Note*: In applicable scenarios
Step 3 - Data Sources
Primary Research
- Web Analytics
- Survey Reports
- Research Institute
- Latest Research Reports
- Opinion Leaders
Secondary Research
- Annual Reports
- White Paper
- Latest Press Release
- Industry Association
- Paid Database
- Investor Presentations

Step 4 - Data Triangulation
Involves using different sources of information in order to increase the validity of a study
These sources are likely to be stakeholders in a program - participants, other researchers, program staff, other community members, and so on.
Then we put all data in single framework & apply various statistical tools to find out the dynamic on the market.
During the analysis stage, feedback from the stakeholder groups would be compared to determine areas of agreement as well as areas of divergence