
Key Insights
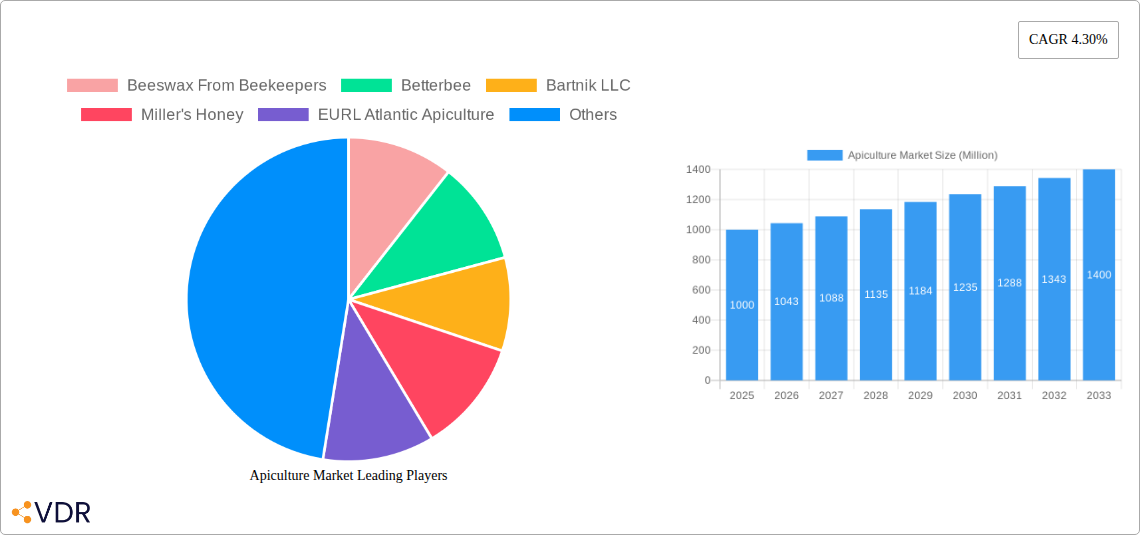
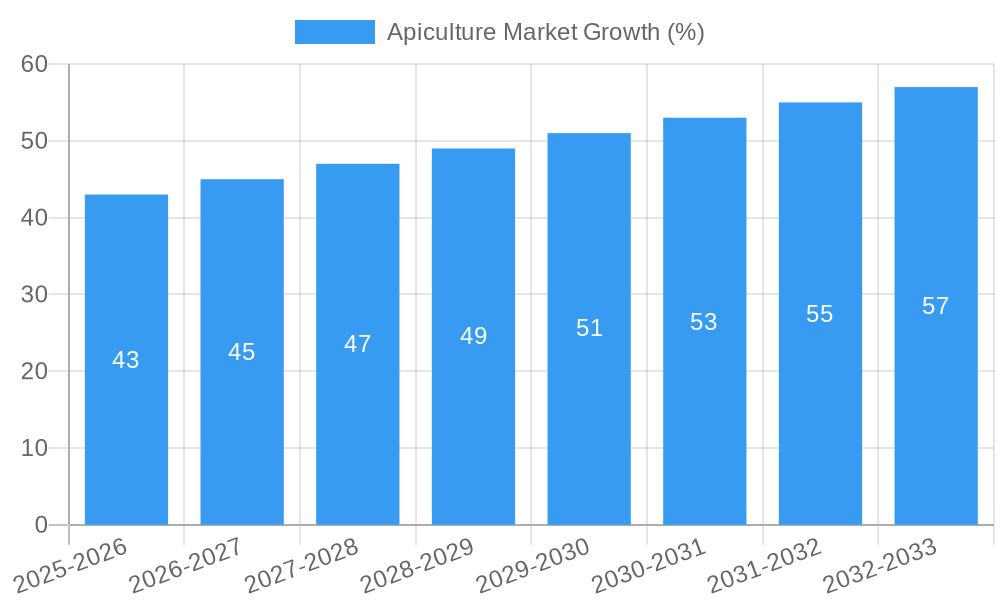
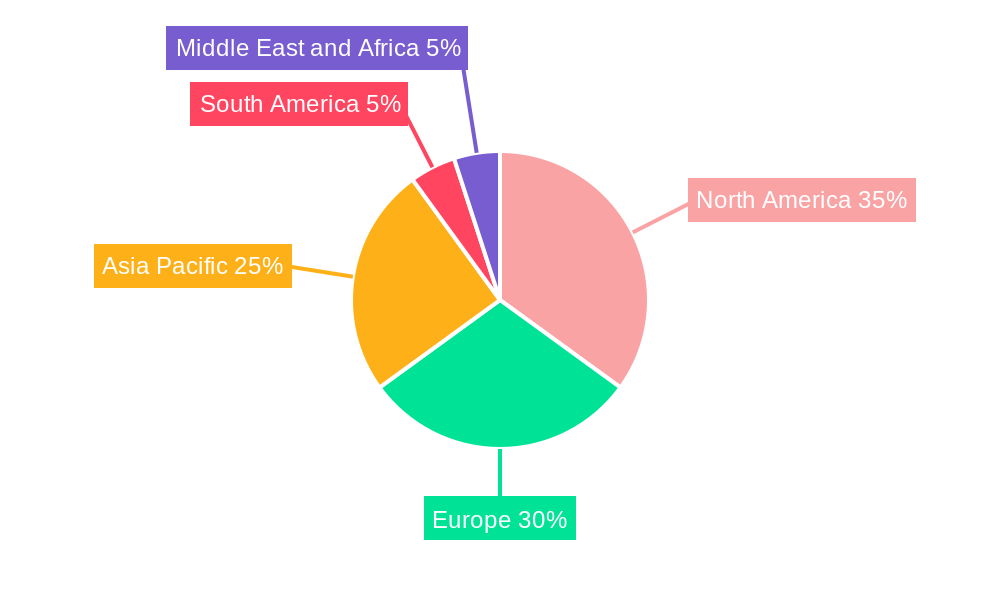
The global apiculture market, encompassing honey, beeswax, live bees, and related products, is experiencing steady growth, projected at a 4.30% CAGR from 2025 to 2033. This expansion is driven by several key factors. Increasing consumer awareness of the health benefits associated with honey and beeswax, particularly in applications such as food and beverages, cosmetics, and pharmaceuticals, is fueling demand. The rising popularity of natural and organic products further bolsters this trend. Furthermore, the growing recognition of the crucial role of bees in pollination for agriculture and the increasing adoption of sustainable beekeeping practices are contributing to market growth. However, challenges exist, including the impact of climate change on bee populations, the increasing use of pesticides impacting bee health, and fluctuations in honey production due to unpredictable weather patterns. These factors can restrain market growth to some degree. The market is segmented by product type (honey dominating, followed by beeswax, live bees, and others) and application (food and beverages holding a significant share, followed by cosmetics and medical applications). North America and Europe currently hold substantial market shares, benefiting from established beekeeping practices and consumer preference for natural products. However, the Asia-Pacific region is expected to show significant growth potential in the coming years, driven by increasing urbanization, rising disposable incomes, and a growing awareness of bee products' benefits. The competitive landscape includes both large-scale commercial operations and smaller, specialized beekeepers, catering to diverse market needs and product demands. Future market success will depend on innovative beekeeping techniques, sustainable practices, product diversification, and targeted marketing to reach specific consumer segments.
The market's trajectory indicates a significant opportunity for growth, particularly within the Asia-Pacific region. Companies are focusing on expanding their product portfolios to meet the demands of health-conscious consumers. Furthermore, investment in research and development to improve bee health and enhance honey and beeswax production is crucial for sustained market growth. Strategic partnerships between beekeepers, researchers, and manufacturers are becoming increasingly important to address challenges, such as disease management and climate change impacts. The market's future success relies on a collaborative effort to ensure the long-term health of bee populations and the sustainability of beekeeping practices, maintaining supply and meeting growing global demand.
Apiculture Market: A Comprehensive Report (2019-2033)
This in-depth report provides a comprehensive analysis of the global Apiculture market, encompassing historical data (2019-2024), current estimates (2025), and future projections (2025-2033). It delves into market dynamics, growth trends, regional performance, product landscapes, and key players, offering valuable insights for industry professionals, investors, and stakeholders. The report segments the market by Product Type (Honey, Beeswax, Live Bees, Others) and Application (Medical, Food & Beverages, Cosmetics, Others) providing a granular understanding of the parent and child markets. The total market size is projected to reach xx Million by 2033.
Apiculture Market Dynamics & Structure
The apiculture market exhibits a moderately fragmented structure, with numerous regional players alongside larger multinational companies. Technological innovation, particularly in beekeeping practices and product processing, is a key driver, alongside increasing consumer demand for natural and healthy products. Stringent regulatory frameworks concerning food safety and product authenticity influence market dynamics. Competitive substitutes exist in the form of synthetic alternatives for honey and beeswax, but these often lack the perceived quality and health benefits of natural apiculture products. The market is significantly influenced by end-user demographics, with health-conscious consumers and growing demand for natural cosmetics driving growth. M&A activity in the sector has been moderate, with deals focused primarily on supply chain consolidation and expansion into new markets.
- Market Concentration: Moderately fragmented, with a few dominant players.
- Technological Innovation: Significant advancements in beekeeping and processing techniques.
- Regulatory Landscape: Stringent food safety and labeling regulations impacting market operations.
- Competitive Substitutes: Presence of synthetic alternatives, but natural products maintain a significant advantage.
- M&A Activity: Moderate level of consolidation, mainly focusing on supply chain and market expansion. Estimated xx deals in the last 5 years.
Apiculture Market Growth Trends & Insights
The global apiculture market is experiencing robust growth, driven by rising health consciousness, increasing demand for natural products, and expanding applications across diverse industries. From 2019 to 2024, the market witnessed a CAGR of xx%, reaching an estimated value of xx Million in 2025. This upward trajectory is projected to continue throughout the forecast period (2025-2033), with a projected CAGR of xx%, driven by factors including innovative product development, expansion into new geographical regions, and growing consumer awareness of the benefits of bee products. Technological disruptions, such as the adoption of precision beekeeping technologies, are further accelerating market growth. Consumer behavior is shifting towards increased preference for sustainably sourced and ethically produced honey and beeswax products.
Dominant Regions, Countries, or Segments in Apiculture Market
The North American and European markets currently dominate the apiculture sector, accounting for a combined xx% of the global market share in 2025. Within product types, honey remains the largest segment, holding a market share of approximately xx%, followed by beeswax at xx%. The food and beverage industry is the primary application segment, consuming approximately xx% of total apiculture output.
- Key Drivers in North America: Strong consumer demand for natural foods, established supply chains, and favorable regulatory environments.
- Key Drivers in Europe: High per capita consumption of honey, increasing popularity of natural cosmetics, and government support for beekeeping initiatives.
- Honey Segment Dominance: Driven by widespread consumption, diverse culinary applications, and established distribution networks.
- Food & Beverage Application: Primary driver due to extensive honey use as a sweetener, flavor enhancer, and functional ingredient.
Apiculture Market Product Landscape
The apiculture market presents a diverse range of products, including raw honey, processed honey (e.g., creamed honey, honey sticks), beeswax (used in cosmetics and candles), propolis (with medicinal properties), royal jelly, and live bees for pollination services. Recent innovations focus on improving honey extraction methods, enhancing beeswax quality, and developing new applications for propolis and other bee products. Unique selling propositions include product traceability, sustainability certifications, and claims related to health benefits and natural origin.
Key Drivers, Barriers & Challenges in Apiculture Market
Key Drivers:
- Rising consumer awareness of health benefits associated with honey and bee products.
- Increasing demand for natural and organic products across multiple applications.
- Growth of the global food & beverage and cosmetics industries.
- Technological advancements improving beekeeping efficiency and product processing.
Key Challenges:
- Fluctuations in honey production due to climate change and bee colony health issues.
- Concerns about pesticide use and its impact on bee populations.
- Counterfeit products and lack of traceability in the supply chain causing a loss of xx Million annually.
- Stringent regulations and certification processes.
Emerging Opportunities in Apiculture Market
Emerging opportunities lie in expanding into untapped markets (e.g., Asia-Pacific), developing innovative applications for bee products (e.g., in pharmaceuticals and nutraceuticals), and catering to the growing demand for sustainably sourced and ethically produced bee products. Focus on functional foods incorporating honey and propolis represents a significant growth avenue.
Growth Accelerators in the Apiculture Market Industry
Technological advancements in beekeeping, such as smart hives and drone technology for monitoring bee colonies, are accelerating market growth. Strategic partnerships between apiculture companies and food & beverage manufacturers, along with expansion into new markets, particularly in developing economies, are key growth drivers.
Key Players Shaping the Apiculture Market Market
- Beeswax From Beekeepers
- Betterbee
- Bartnik LLC
- Miller's Honey
- EURL Atlantic Apiculture
- Arnold honey bee services
- Clearskys
- PhytoPharma International Ltd (Bee-Fuse Technology)
- Beehive Botanicals
- Pastili Limited
Notable Milestones in Apiculture Market Sector
- April 2021: Billy Bee and Doyon (McCormick & Company Inc.) commit to 100% Canadian honey sourcing, emphasizing consumer preference and ethical sourcing.
- March 2021: Comvita opens a state-of-the-art Wellness Lab, showcasing its commitment to apiculture-based products and innovation.
- January 2022: Nature Nate's merges with Sweet Harvest Foods, highlighting consolidation within the supply chain and agricultural investment.
In-Depth Apiculture Market Market Outlook
The apiculture market holds significant future potential, driven by continuing consumer demand for natural products, technological innovation, and expanding applications. Strategic opportunities exist for companies focusing on sustainability, ethical sourcing, and innovative product development. The market is poised for steady growth over the next decade, presenting attractive prospects for investment and expansion.
Apiculture Market Segmentation
-
1. Product Type
- 1.1. Honey
- 1.2. Beeswax
- 1.3. Live-bees
- 1.4. Others
-
2. Application
- 2.1. Medical
- 2.2. Food Beverages
- 2.3. Cosmetics
- 2.4. Others
Apiculture Market Segmentation By Geography
-
1. North America
- 1.1. United States
- 1.2. Canada
- 1.3. Mexico
- 1.4. Rest of North America
-
2. Europe
- 2.1. Germany
- 2.2. United Kingdom
- 2.3. France
- 2.4. Russia
- 2.5. Spain
- 2.6. Rest of Europe
-
3. Asia Pacific
- 3.1. China
- 3.2. Japan
- 3.3. India
- 3.4. South Korea
- 3.5. Rest of Asia Pacific
-
4. South America
- 4.1. Brazil
- 4.2. Argentina
- 4.3. Rest of South America
-
5. Middle East and Africa
- 5.1. United Arab Emirates
- 5.2. South Africa
- 5.3. Rest of Middle East and Africa
Apiculture Market REPORT HIGHLIGHTS
| Aspects | Details |
|---|---|
| Study Period | 2019-2033 |
| Base Year | 2024 |
| Estimated Year | 2025 |
| Forecast Period | 2025-2033 |
| Historical Period | 2019-2024 |
| Growth Rate | CAGR of 4.30% from 2019-2033 |
| Segmentation |
|
Table of Contents
- 1. Introduction
- 1.1. Research Scope
- 1.2. Market Segmentation
- 1.3. Research Methodology
- 1.4. Definitions and Assumptions
- 2. Executive Summary
- 2.1. Introduction
- 3. Market Dynamics
- 3.1. Introduction
- 3.2. Market Drivers
- 3.2.1. Rising Trend of Ingestible Beauty Products; Growing demand for Nutrient-Enriched Cosmetic Products
- 3.3. Market Restrains
- 3.3.1. Availability of Counterfeit Beauty Supplements Products
- 3.4. Market Trends
- 3.4.1. Honey Emerges As a Functional Sweetener
- 4. Market Factor Analysis
- 4.1. Porters Five Forces
- 4.2. Supply/Value Chain
- 4.3. PESTEL analysis
- 4.4. Market Entropy
- 4.5. Patent/Trademark Analysis
- 5. Global Apiculture Market Analysis, Insights and Forecast, 2019-2031
- 5.1. Market Analysis, Insights and Forecast - by Product Type
- 5.1.1. Honey
- 5.1.2. Beeswax
- 5.1.3. Live-bees
- 5.1.4. Others
- 5.2. Market Analysis, Insights and Forecast - by Application
- 5.2.1. Medical
- 5.2.2. Food Beverages
- 5.2.3. Cosmetics
- 5.2.4. Others
- 5.3. Market Analysis, Insights and Forecast - by Region
- 5.3.1. North America
- 5.3.2. Europe
- 5.3.3. Asia Pacific
- 5.3.4. South America
- 5.3.5. Middle East and Africa
- 5.1. Market Analysis, Insights and Forecast - by Product Type
- 6. North America Apiculture Market Analysis, Insights and Forecast, 2019-2031
- 6.1. Market Analysis, Insights and Forecast - by Product Type
- 6.1.1. Honey
- 6.1.2. Beeswax
- 6.1.3. Live-bees
- 6.1.4. Others
- 6.2. Market Analysis, Insights and Forecast - by Application
- 6.2.1. Medical
- 6.2.2. Food Beverages
- 6.2.3. Cosmetics
- 6.2.4. Others
- 6.1. Market Analysis, Insights and Forecast - by Product Type
- 7. Europe Apiculture Market Analysis, Insights and Forecast, 2019-2031
- 7.1. Market Analysis, Insights and Forecast - by Product Type
- 7.1.1. Honey
- 7.1.2. Beeswax
- 7.1.3. Live-bees
- 7.1.4. Others
- 7.2. Market Analysis, Insights and Forecast - by Application
- 7.2.1. Medical
- 7.2.2. Food Beverages
- 7.2.3. Cosmetics
- 7.2.4. Others
- 7.1. Market Analysis, Insights and Forecast - by Product Type
- 8. Asia Pacific Apiculture Market Analysis, Insights and Forecast, 2019-2031
- 8.1. Market Analysis, Insights and Forecast - by Product Type
- 8.1.1. Honey
- 8.1.2. Beeswax
- 8.1.3. Live-bees
- 8.1.4. Others
- 8.2. Market Analysis, Insights and Forecast - by Application
- 8.2.1. Medical
- 8.2.2. Food Beverages
- 8.2.3. Cosmetics
- 8.2.4. Others
- 8.1. Market Analysis, Insights and Forecast - by Product Type
- 9. South America Apiculture Market Analysis, Insights and Forecast, 2019-2031
- 9.1. Market Analysis, Insights and Forecast - by Product Type
- 9.1.1. Honey
- 9.1.2. Beeswax
- 9.1.3. Live-bees
- 9.1.4. Others
- 9.2. Market Analysis, Insights and Forecast - by Application
- 9.2.1. Medical
- 9.2.2. Food Beverages
- 9.2.3. Cosmetics
- 9.2.4. Others
- 9.1. Market Analysis, Insights and Forecast - by Product Type
- 10. Middle East and Africa Apiculture Market Analysis, Insights and Forecast, 2019-2031
- 10.1. Market Analysis, Insights and Forecast - by Product Type
- 10.1.1. Honey
- 10.1.2. Beeswax
- 10.1.3. Live-bees
- 10.1.4. Others
- 10.2. Market Analysis, Insights and Forecast - by Application
- 10.2.1. Medical
- 10.2.2. Food Beverages
- 10.2.3. Cosmetics
- 10.2.4. Others
- 10.1. Market Analysis, Insights and Forecast - by Product Type
- 11. North America Apiculture Market Analysis, Insights and Forecast, 2019-2031
- 11.1. Market Analysis, Insights and Forecast - By Country/Sub-region
- 11.1.1 United States
- 11.1.2 Canada
- 11.1.3 Mexico
- 11.1.4 Rest of North America
- 12. Europe Apiculture Market Analysis, Insights and Forecast, 2019-2031
- 12.1. Market Analysis, Insights and Forecast - By Country/Sub-region
- 12.1.1 Germany
- 12.1.2 United Kingdom
- 12.1.3 France
- 12.1.4 Russia
- 12.1.5 Spain
- 12.1.6 Rest of Europe
- 13. Asia Pacific Apiculture Market Analysis, Insights and Forecast, 2019-2031
- 13.1. Market Analysis, Insights and Forecast - By Country/Sub-region
- 13.1.1 China
- 13.1.2 Japan
- 13.1.3 India
- 13.1.4 South Korea
- 13.1.5 Rest of Asia Pacific
- 14. South America Apiculture Market Analysis, Insights and Forecast, 2019-2031
- 14.1. Market Analysis, Insights and Forecast - By Country/Sub-region
- 14.1.1 Brazil
- 14.1.2 Argentina
- 14.1.3 Rest of South America
- 15. Middle East and Africa Apiculture Market Analysis, Insights and Forecast, 2019-2031
- 15.1. Market Analysis, Insights and Forecast - By Country/Sub-region
- 15.1.1 United Arab Emirates
- 15.1.2 South Africa
- 15.1.3 Rest of Middle East and Africa
- 16. Competitive Analysis
- 16.1. Global Market Share Analysis 2024
- 16.2. Company Profiles
- 16.2.1 Beeswax From Beekeepers
- 16.2.1.1. Overview
- 16.2.1.2. Products
- 16.2.1.3. SWOT Analysis
- 16.2.1.4. Recent Developments
- 16.2.1.5. Financials (Based on Availability)
- 16.2.2 Betterbee
- 16.2.2.1. Overview
- 16.2.2.2. Products
- 16.2.2.3. SWOT Analysis
- 16.2.2.4. Recent Developments
- 16.2.2.5. Financials (Based on Availability)
- 16.2.3 Bartnik LLC
- 16.2.3.1. Overview
- 16.2.3.2. Products
- 16.2.3.3. SWOT Analysis
- 16.2.3.4. Recent Developments
- 16.2.3.5. Financials (Based on Availability)
- 16.2.4 Miller's Honey
- 16.2.4.1. Overview
- 16.2.4.2. Products
- 16.2.4.3. SWOT Analysis
- 16.2.4.4. Recent Developments
- 16.2.4.5. Financials (Based on Availability)
- 16.2.5 EURL Atlantic Apiculture
- 16.2.5.1. Overview
- 16.2.5.2. Products
- 16.2.5.3. SWOT Analysis
- 16.2.5.4. Recent Developments
- 16.2.5.5. Financials (Based on Availability)
- 16.2.6 Arnold honey bee services
- 16.2.6.1. Overview
- 16.2.6.2. Products
- 16.2.6.3. SWOT Analysis
- 16.2.6.4. Recent Developments
- 16.2.6.5. Financials (Based on Availability)
- 16.2.7 Clearskys
- 16.2.7.1. Overview
- 16.2.7.2. Products
- 16.2.7.3. SWOT Analysis
- 16.2.7.4. Recent Developments
- 16.2.7.5. Financials (Based on Availability)
- 16.2.8 PhytoPharma International Ltd (Bee-Fuse Technology)*List Not Exhaustive
- 16.2.8.1. Overview
- 16.2.8.2. Products
- 16.2.8.3. SWOT Analysis
- 16.2.8.4. Recent Developments
- 16.2.8.5. Financials (Based on Availability)
- 16.2.9 Beehive Botanicals
- 16.2.9.1. Overview
- 16.2.9.2. Products
- 16.2.9.3. SWOT Analysis
- 16.2.9.4. Recent Developments
- 16.2.9.5. Financials (Based on Availability)
- 16.2.10 Pastili Limited
- 16.2.10.1. Overview
- 16.2.10.2. Products
- 16.2.10.3. SWOT Analysis
- 16.2.10.4. Recent Developments
- 16.2.10.5. Financials (Based on Availability)
- 16.2.1 Beeswax From Beekeepers
List of Figures
- Figure 1: Global Apiculture Market Revenue Breakdown (Million, %) by Region 2024 & 2032
- Figure 2: North America Apiculture Market Revenue (Million), by Country 2024 & 2032
- Figure 3: North America Apiculture Market Revenue Share (%), by Country 2024 & 2032
- Figure 4: Europe Apiculture Market Revenue (Million), by Country 2024 & 2032
- Figure 5: Europe Apiculture Market Revenue Share (%), by Country 2024 & 2032
- Figure 6: Asia Pacific Apiculture Market Revenue (Million), by Country 2024 & 2032
- Figure 7: Asia Pacific Apiculture Market Revenue Share (%), by Country 2024 & 2032
- Figure 8: South America Apiculture Market Revenue (Million), by Country 2024 & 2032
- Figure 9: South America Apiculture Market Revenue Share (%), by Country 2024 & 2032
- Figure 10: Middle East and Africa Apiculture Market Revenue (Million), by Country 2024 & 2032
- Figure 11: Middle East and Africa Apiculture Market Revenue Share (%), by Country 2024 & 2032
- Figure 12: North America Apiculture Market Revenue (Million), by Product Type 2024 & 2032
- Figure 13: North America Apiculture Market Revenue Share (%), by Product Type 2024 & 2032
- Figure 14: North America Apiculture Market Revenue (Million), by Application 2024 & 2032
- Figure 15: North America Apiculture Market Revenue Share (%), by Application 2024 & 2032
- Figure 16: North America Apiculture Market Revenue (Million), by Country 2024 & 2032
- Figure 17: North America Apiculture Market Revenue Share (%), by Country 2024 & 2032
- Figure 18: Europe Apiculture Market Revenue (Million), by Product Type 2024 & 2032
- Figure 19: Europe Apiculture Market Revenue Share (%), by Product Type 2024 & 2032
- Figure 20: Europe Apiculture Market Revenue (Million), by Application 2024 & 2032
- Figure 21: Europe Apiculture Market Revenue Share (%), by Application 2024 & 2032
- Figure 22: Europe Apiculture Market Revenue (Million), by Country 2024 & 2032
- Figure 23: Europe Apiculture Market Revenue Share (%), by Country 2024 & 2032
- Figure 24: Asia Pacific Apiculture Market Revenue (Million), by Product Type 2024 & 2032
- Figure 25: Asia Pacific Apiculture Market Revenue Share (%), by Product Type 2024 & 2032
- Figure 26: Asia Pacific Apiculture Market Revenue (Million), by Application 2024 & 2032
- Figure 27: Asia Pacific Apiculture Market Revenue Share (%), by Application 2024 & 2032
- Figure 28: Asia Pacific Apiculture Market Revenue (Million), by Country 2024 & 2032
- Figure 29: Asia Pacific Apiculture Market Revenue Share (%), by Country 2024 & 2032
- Figure 30: South America Apiculture Market Revenue (Million), by Product Type 2024 & 2032
- Figure 31: South America Apiculture Market Revenue Share (%), by Product Type 2024 & 2032
- Figure 32: South America Apiculture Market Revenue (Million), by Application 2024 & 2032
- Figure 33: South America Apiculture Market Revenue Share (%), by Application 2024 & 2032
- Figure 34: South America Apiculture Market Revenue (Million), by Country 2024 & 2032
- Figure 35: South America Apiculture Market Revenue Share (%), by Country 2024 & 2032
- Figure 36: Middle East and Africa Apiculture Market Revenue (Million), by Product Type 2024 & 2032
- Figure 37: Middle East and Africa Apiculture Market Revenue Share (%), by Product Type 2024 & 2032
- Figure 38: Middle East and Africa Apiculture Market Revenue (Million), by Application 2024 & 2032
- Figure 39: Middle East and Africa Apiculture Market Revenue Share (%), by Application 2024 & 2032
- Figure 40: Middle East and Africa Apiculture Market Revenue (Million), by Country 2024 & 2032
- Figure 41: Middle East and Africa Apiculture Market Revenue Share (%), by Country 2024 & 2032
List of Tables
- Table 1: Global Apiculture Market Revenue Million Forecast, by Region 2019 & 2032
- Table 2: Global Apiculture Market Revenue Million Forecast, by Product Type 2019 & 2032
- Table 3: Global Apiculture Market Revenue Million Forecast, by Application 2019 & 2032
- Table 4: Global Apiculture Market Revenue Million Forecast, by Region 2019 & 2032
- Table 5: Global Apiculture Market Revenue Million Forecast, by Country 2019 & 2032
- Table 6: United States Apiculture Market Revenue (Million) Forecast, by Application 2019 & 2032
- Table 7: Canada Apiculture Market Revenue (Million) Forecast, by Application 2019 & 2032
- Table 8: Mexico Apiculture Market Revenue (Million) Forecast, by Application 2019 & 2032
- Table 9: Rest of North America Apiculture Market Revenue (Million) Forecast, by Application 2019 & 2032
- Table 10: Global Apiculture Market Revenue Million Forecast, by Country 2019 & 2032
- Table 11: Germany Apiculture Market Revenue (Million) Forecast, by Application 2019 & 2032
- Table 12: United Kingdom Apiculture Market Revenue (Million) Forecast, by Application 2019 & 2032
- Table 13: France Apiculture Market Revenue (Million) Forecast, by Application 2019 & 2032
- Table 14: Russia Apiculture Market Revenue (Million) Forecast, by Application 2019 & 2032
- Table 15: Spain Apiculture Market Revenue (Million) Forecast, by Application 2019 & 2032
- Table 16: Rest of Europe Apiculture Market Revenue (Million) Forecast, by Application 2019 & 2032
- Table 17: Global Apiculture Market Revenue Million Forecast, by Country 2019 & 2032
- Table 18: China Apiculture Market Revenue (Million) Forecast, by Application 2019 & 2032
- Table 19: Japan Apiculture Market Revenue (Million) Forecast, by Application 2019 & 2032
- Table 20: India Apiculture Market Revenue (Million) Forecast, by Application 2019 & 2032
- Table 21: South Korea Apiculture Market Revenue (Million) Forecast, by Application 2019 & 2032
- Table 22: Rest of Asia Pacific Apiculture Market Revenue (Million) Forecast, by Application 2019 & 2032
- Table 23: Global Apiculture Market Revenue Million Forecast, by Country 2019 & 2032
- Table 24: Brazil Apiculture Market Revenue (Million) Forecast, by Application 2019 & 2032
- Table 25: Argentina Apiculture Market Revenue (Million) Forecast, by Application 2019 & 2032
- Table 26: Rest of South America Apiculture Market Revenue (Million) Forecast, by Application 2019 & 2032
- Table 27: Global Apiculture Market Revenue Million Forecast, by Country 2019 & 2032
- Table 28: United Arab Emirates Apiculture Market Revenue (Million) Forecast, by Application 2019 & 2032
- Table 29: South Africa Apiculture Market Revenue (Million) Forecast, by Application 2019 & 2032
- Table 30: Rest of Middle East and Africa Apiculture Market Revenue (Million) Forecast, by Application 2019 & 2032
- Table 31: Global Apiculture Market Revenue Million Forecast, by Product Type 2019 & 2032
- Table 32: Global Apiculture Market Revenue Million Forecast, by Application 2019 & 2032
- Table 33: Global Apiculture Market Revenue Million Forecast, by Country 2019 & 2032
- Table 34: United States Apiculture Market Revenue (Million) Forecast, by Application 2019 & 2032
- Table 35: Canada Apiculture Market Revenue (Million) Forecast, by Application 2019 & 2032
- Table 36: Mexico Apiculture Market Revenue (Million) Forecast, by Application 2019 & 2032
- Table 37: Rest of North America Apiculture Market Revenue (Million) Forecast, by Application 2019 & 2032
- Table 38: Global Apiculture Market Revenue Million Forecast, by Product Type 2019 & 2032
- Table 39: Global Apiculture Market Revenue Million Forecast, by Application 2019 & 2032
- Table 40: Global Apiculture Market Revenue Million Forecast, by Country 2019 & 2032
- Table 41: Germany Apiculture Market Revenue (Million) Forecast, by Application 2019 & 2032
- Table 42: United Kingdom Apiculture Market Revenue (Million) Forecast, by Application 2019 & 2032
- Table 43: France Apiculture Market Revenue (Million) Forecast, by Application 2019 & 2032
- Table 44: Russia Apiculture Market Revenue (Million) Forecast, by Application 2019 & 2032
- Table 45: Spain Apiculture Market Revenue (Million) Forecast, by Application 2019 & 2032
- Table 46: Rest of Europe Apiculture Market Revenue (Million) Forecast, by Application 2019 & 2032
- Table 47: Global Apiculture Market Revenue Million Forecast, by Product Type 2019 & 2032
- Table 48: Global Apiculture Market Revenue Million Forecast, by Application 2019 & 2032
- Table 49: Global Apiculture Market Revenue Million Forecast, by Country 2019 & 2032
- Table 50: China Apiculture Market Revenue (Million) Forecast, by Application 2019 & 2032
- Table 51: Japan Apiculture Market Revenue (Million) Forecast, by Application 2019 & 2032
- Table 52: India Apiculture Market Revenue (Million) Forecast, by Application 2019 & 2032
- Table 53: South Korea Apiculture Market Revenue (Million) Forecast, by Application 2019 & 2032
- Table 54: Rest of Asia Pacific Apiculture Market Revenue (Million) Forecast, by Application 2019 & 2032
- Table 55: Global Apiculture Market Revenue Million Forecast, by Product Type 2019 & 2032
- Table 56: Global Apiculture Market Revenue Million Forecast, by Application 2019 & 2032
- Table 57: Global Apiculture Market Revenue Million Forecast, by Country 2019 & 2032
- Table 58: Brazil Apiculture Market Revenue (Million) Forecast, by Application 2019 & 2032
- Table 59: Argentina Apiculture Market Revenue (Million) Forecast, by Application 2019 & 2032
- Table 60: Rest of South America Apiculture Market Revenue (Million) Forecast, by Application 2019 & 2032
- Table 61: Global Apiculture Market Revenue Million Forecast, by Product Type 2019 & 2032
- Table 62: Global Apiculture Market Revenue Million Forecast, by Application 2019 & 2032
- Table 63: Global Apiculture Market Revenue Million Forecast, by Country 2019 & 2032
- Table 64: United Arab Emirates Apiculture Market Revenue (Million) Forecast, by Application 2019 & 2032
- Table 65: South Africa Apiculture Market Revenue (Million) Forecast, by Application 2019 & 2032
- Table 66: Rest of Middle East and Africa Apiculture Market Revenue (Million) Forecast, by Application 2019 & 2032
Frequently Asked Questions
1. What is the projected Compound Annual Growth Rate (CAGR) of the Apiculture Market?
The projected CAGR is approximately 4.30%.
2. Which companies are prominent players in the Apiculture Market?
Key companies in the market include Beeswax From Beekeepers, Betterbee, Bartnik LLC, Miller's Honey, EURL Atlantic Apiculture, Arnold honey bee services, Clearskys, PhytoPharma International Ltd (Bee-Fuse Technology)*List Not Exhaustive, Beehive Botanicals, Pastili Limited.
3. What are the main segments of the Apiculture Market?
The market segments include Product Type, Application.
4. Can you provide details about the market size?
The market size is estimated to be USD XX Million as of 2022.
5. What are some drivers contributing to market growth?
Rising Trend of Ingestible Beauty Products; Growing demand for Nutrient-Enriched Cosmetic Products.
6. What are the notable trends driving market growth?
Honey Emerges As a Functional Sweetener.
7. Are there any restraints impacting market growth?
Availability of Counterfeit Beauty Supplements Products.
8. Can you provide examples of recent developments in the market?
January 2022: Nature Nate's merged with Cannon Falls, Minnesota-based Sweet Harvest Foods, an independent private equity business that invests in supply chain and agricultural production enterprises on a controlling basis.
9. What pricing options are available for accessing the report?
Pricing options include single-user, multi-user, and enterprise licenses priced at USD 4750, USD 5250, and USD 8750 respectively.
10. Is the market size provided in terms of value or volume?
The market size is provided in terms of value, measured in Million.
11. Are there any specific market keywords associated with the report?
Yes, the market keyword associated with the report is "Apiculture Market," which aids in identifying and referencing the specific market segment covered.
12. How do I determine which pricing option suits my needs best?
The pricing options vary based on user requirements and access needs. Individual users may opt for single-user licenses, while businesses requiring broader access may choose multi-user or enterprise licenses for cost-effective access to the report.
13. Are there any additional resources or data provided in the Apiculture Market report?
While the report offers comprehensive insights, it's advisable to review the specific contents or supplementary materials provided to ascertain if additional resources or data are available.
14. How can I stay updated on further developments or reports in the Apiculture Market?
To stay informed about further developments, trends, and reports in the Apiculture Market, consider subscribing to industry newsletters, following relevant companies and organizations, or regularly checking reputable industry news sources and publications.
Methodology
Step 1 - Identification of Relevant Samples Size from Population Database


Step 2 - Approaches for Defining Global Market Size (Value, Volume* & Price*)

Note*: In applicable scenarios
Step 3 - Data Sources
Primary Research
- Web Analytics
- Survey Reports
- Research Institute
- Latest Research Reports
- Opinion Leaders
Secondary Research
- Annual Reports
- White Paper
- Latest Press Release
- Industry Association
- Paid Database
- Investor Presentations

Step 4 - Data Triangulation
Involves using different sources of information in order to increase the validity of a study
These sources are likely to be stakeholders in a program - participants, other researchers, program staff, other community members, and so on.
Then we put all data in single framework & apply various statistical tools to find out the dynamic on the market.
During the analysis stage, feedback from the stakeholder groups would be compared to determine areas of agreement as well as areas of divergence


