
Key Insights
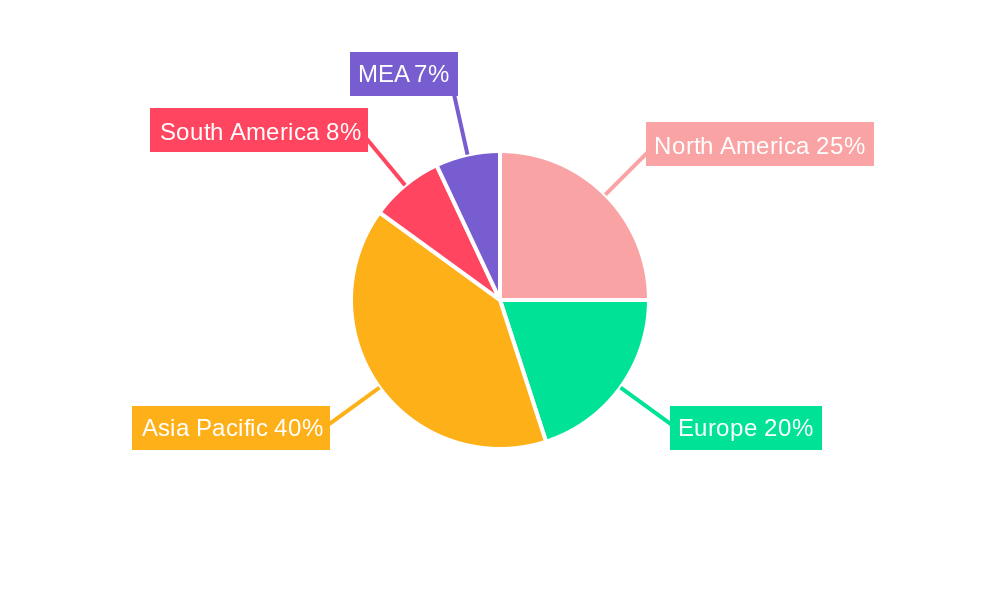
The Asia-Pacific (APAC) portable X-ray devices market is experiencing robust growth, driven by increasing demand for point-of-care diagnostics, rising prevalence of chronic diseases, and expanding healthcare infrastructure in emerging economies. The region's large and diverse population, coupled with a growing preference for minimally invasive procedures and rapid diagnostic tools, fuels market expansion. Technological advancements, such as the development of lightweight, battery-powered devices with improved image quality, are further stimulating adoption. While the initial investment in equipment can be a restraint for some healthcare providers, especially in smaller clinics, the long-term benefits in terms of efficiency and improved patient outcomes are outweighing these concerns. Significant growth is anticipated in countries like China, India, and Japan, driven by their substantial healthcare spending and government initiatives promoting accessible healthcare. The market segmentation within APAC is dynamic, with digital X-ray technology witnessing faster adoption compared to analog systems, reflecting the global trend towards improved image clarity, diagnostic accuracy, and reduced radiation exposure. Within applications, portable X-ray devices are finding widespread use in dental practices, emergency rooms, and mobile clinics, especially in remote areas with limited access to sophisticated medical facilities. The handheld and mobile device modalities contribute significantly to the portable nature and ease of use, facilitating their broad deployment across diverse healthcare settings. This segment is expected to demonstrate strong growth throughout the forecast period.
The competitive landscape is characterized by both established global players and regional manufacturers. Key players are focusing on product innovation, strategic partnerships, and expansion into untapped markets to maintain their competitive edge. This competitive intensity fosters advancements in technology and affordability, ultimately benefiting patients and healthcare providers across the APAC region. Future growth will be influenced by factors such as government regulations regarding medical device approvals, healthcare infrastructure development in less developed areas, and evolving reimbursement policies. Continued investment in research and development is crucial for improving image quality, reducing radiation exposure, and integrating advanced features like artificial intelligence (AI) for enhanced diagnostic capabilities. The anticipated rise in telehealth and remote diagnostics further presents considerable opportunities for the portable X-ray devices market in APAC.

APAC Portable X-Ray Devices Industry Market Report: 2019-2033
This comprehensive report provides a detailed analysis of the Asia-Pacific (APAC) portable X-ray devices market, encompassing historical data (2019-2024), current estimations (2025), and future projections (2025-2033). It delves into market dynamics, growth trends, leading segments (including Analog X-ray, Digital X-ray, Dental X-ray, Mammography, Chest X-ray, Abdomen X-ray, Handheld X-ray Devices, and Mobile X-ray Devices), key players (Samsung Group, Canon Inc, Hologic Inc, Hitachi Ltd, Koninklijke Philips N.V., Siemens AG, GE Healthcare, Carestream Health Inc, Shimadzu Corporation, and Fujifilm Holdings Corporation), and emerging opportunities within this rapidly evolving sector. The report utilizes a robust methodology, incorporating both qualitative and quantitative insights to deliver actionable intelligence for industry professionals.
APAC Portable X-Ray Devices Industry Market Dynamics & Structure
The APAC portable X-ray devices market exhibits a moderately consolidated structure, with key players holding significant market share. Technological innovation, particularly in digital X-ray technology and miniaturization, is a primary growth driver. Stringent regulatory frameworks regarding radiation safety and medical device approvals impact market entry and operations. Competitive pressures stem from both established players and emerging entrants, often driven by price competition and product differentiation. The market is segmented by technology (analog vs. digital), application (dental, mammography, chest X-ray, abdomen X-ray), and modality (handheld vs. mobile). M&A activity has been moderate, with strategic acquisitions aimed at expanding product portfolios and geographic reach. The end-user demographic is broad, encompassing hospitals, clinics, diagnostic centers, and mobile medical units, influenced by factors such as increasing healthcare expenditure and the growing prevalence of chronic diseases.
- Market Concentration: Moderately consolidated, with top 5 players holding approximately xx% market share in 2025.
- Technological Innovation: Focus on digital X-ray, AI-powered image analysis, and improved portability.
- Regulatory Framework: Stringent safety standards and approval processes impacting market entry.
- Competitive Landscape: Intense competition driven by price and technological differentiation.
- M&A Activity: Moderate activity, primarily driven by strategic acquisitions (xx deals in 2019-2024).
- Innovation Barriers: High R&D costs, stringent regulatory hurdles, and complex supply chains.
APAC Portable X-Ray Devices Industry Growth Trends & Insights
The APAC portable X-ray devices market is experiencing robust growth, driven by increasing healthcare expenditure, rising prevalence of chronic diseases, and expanding healthcare infrastructure, especially in emerging economies. The market size is projected to reach xx million units by 2025, expanding at a CAGR of xx% during the forecast period (2025-2033). Digital X-ray technology is witnessing rapid adoption, fueled by its superior image quality, enhanced diagnostic capabilities, and reduced radiation exposure. Consumer behavior is shifting towards preference for portable and mobile devices offering ease of use and improved patient experience. Technological advancements, such as AI-powered image analysis and wireless connectivity, are further accelerating market growth. However, factors like high initial investment costs, concerns about radiation safety, and limited skilled personnel in certain regions pose challenges to market expansion.

Dominant Regions, Countries, or Segments in APAC Portable X-Ray Devices Industry
China and India are the dominant markets in the APAC region, fueled by substantial population size, rising healthcare infrastructure investment, and growing demand for advanced medical imaging technologies. Within the segment breakdown, Digital X-ray technology commands the largest market share, driven by its superior image quality and features. Mammography and Chest X-ray applications are significant drivers, reflecting the high prevalence of related diseases. Mobile X-ray devices are gaining traction due to their flexibility and suitability for various healthcare settings.
Key Drivers:
- Increasing Healthcare Expenditure: Significant investments in healthcare infrastructure across APAC.
- Rising Prevalence of Chronic Diseases: Leading to increased demand for diagnostic imaging.
- Growing Adoption of Digital X-ray Technology: Superior image quality and efficiency advantages.
- Government Initiatives: Supportive policies promoting healthcare access and modernization.
Dominant Segments:
- Country: China & India (holding xx% and xx% market share respectively in 2025)
- Technology: Digital X-ray (xx% market share in 2025)
- Application: Mammography & Chest X-ray (combined xx% market share in 2025)
- Modality: Mobile X-ray Devices (xx% market share in 2025)
APAC Portable X-Ray Devices Industry Product Landscape
The APAC portable X-ray devices market showcases a diverse range of products, from basic analog systems to advanced digital units with integrated image processing and wireless capabilities. Key features include enhanced image quality, reduced radiation exposure, user-friendly interfaces, and improved portability. Manufacturers are increasingly incorporating AI-powered image analysis tools for automated detection and diagnosis. Unique selling propositions include features like weight reduction, battery life enhancement, and integration with existing hospital information systems. These technological advancements are driving market growth by improving efficiency and diagnostic accuracy.
Key Drivers, Barriers & Challenges in APAC Portable X-Ray Devices Industry
Key Drivers:
The market is driven by the rising prevalence of chronic diseases, increasing demand for point-of-care diagnostics, technological advancements leading to smaller, more portable devices, and supportive government initiatives promoting healthcare infrastructure development.
Key Challenges & Restraints:
High initial investment costs, particularly for advanced digital systems, pose a barrier to market entry and adoption, especially in resource-constrained settings. Stringent regulatory approvals and safety standards increase the time and cost associated with product launches. Supply chain disruptions and component shortages can impact production and availability. Competition from established and emerging players exerts pressure on pricing and profitability. Furthermore, a shortage of trained personnel to operate and maintain these sophisticated devices hinders market penetration in certain regions.
Emerging Opportunities in APAC Portable X-Ray Devices Industry
Significant opportunities exist in expanding market penetration in underserved rural areas, particularly in developing economies. The integration of AI and machine learning for automated image analysis and improved diagnostic accuracy presents a significant growth avenue. Development of specialized portable X-ray systems for specific applications (e.g., veterinary care, industrial inspection) will open new market segments. Furthermore, increased focus on telehealth and remote diagnostics creates a demand for wirelessly connected portable X-ray devices.
Growth Accelerators in the APAC Portable X-Ray Devices Industry
Technological innovation in areas such as digital detectors, AI-powered image analysis, and advanced materials is driving miniaturization and improved performance of portable X-ray devices. Strategic partnerships between manufacturers, healthcare providers, and technology companies will fuel the development and deployment of innovative solutions. Expanding into untapped markets in rural areas and developing countries offers significant growth potential. Government initiatives and funding programs focused on improving healthcare infrastructure and access are further catalyzing market expansion.
Key Players Shaping the APAC Portable X-Ray Devices Market
- Samsung Group
- Canon Inc
- Hologic Inc
- Hitachi Ltd
- Koninklijke Philips N.V.
- Siemens AG
- GE Healthcare
- Carestream Health Inc
- Shimadzu Corporation
- Fujifilm Holdings Corporation
Notable Milestones in APAC Portable X-Ray Devices Industry Sector
- February 2023: Carestream Health India launched its high-powered Carestream Motion Mobile X-ray system, expanding the range of available mobile X-ray solutions in the market.
- July 2022: FUJIFILM Corporation opened two new NURA health screening centers in India, equipped with mammography systems, signifying increased investment in preventative healthcare and enhancing mammography services.
In-Depth APAC Portable X-Ray Devices Industry Market Outlook
The APAC portable X-ray devices market presents significant long-term growth potential, driven by persistent technological advancements, expanding healthcare infrastructure, and rising demand for point-of-care diagnostics. Strategic partnerships and market expansion into untapped regions will be crucial for sustained growth. The continued integration of AI and other cutting-edge technologies promises to further enhance the efficiency, diagnostic capabilities, and user experience of portable X-ray systems, driving future market expansion and improving healthcare access across the APAC region.
APAC Portable X-Ray Devices Industry Segmentation
-
1. Technology
- 1.1. Analog X-ray
- 1.2. Digital X-ray
-
2. Application
- 2.1. Dental X-ray
- 2.2. Mammography
- 2.3. Chest X-ray
- 2.4. Abdomen X-ray
-
3. Modality
- 3.1. Handheld X-ray Devices
- 3.2. Mobile X-ray Devices
-
4. Geography
- 4.1. China
- 4.2. Japan
- 4.3. India
- 4.4. Australia
- 4.5. South Korea
- 4.6. Rest of Asia-Pacific
APAC Portable X-Ray Devices Industry Segmentation By Geography
- 1. China
- 2. Japan
- 3. India
- 4. Australia
- 5. South Korea
- 6. Rest of Asia Pacific
APAC Portable X-Ray Devices Industry REPORT HIGHLIGHTS
| Aspects | Details |
|---|---|
| Study Period | 2019-2033 |
| Base Year | 2024 |
| Estimated Year | 2025 |
| Forecast Period | 2025-2033 |
| Historical Period | 2019-2024 |
| Growth Rate | CAGR of 10.75% from 2019-2033 |
| Segmentation |
|
Table of Contents
- 1. Introduction
- 1.1. Research Scope
- 1.2. Market Segmentation
- 1.3. Research Methodology
- 1.4. Definitions and Assumptions
- 2. Executive Summary
- 2.1. Introduction
- 3. Market Dynamics
- 3.1. Introduction
- 3.2. Market Drivers
- 3.2.1. Rising Burden of Diseases Requiring Diagnosis; Rising Technological Advancement of X-Ray Devices
- 3.3. Market Restrains
- 3.3.1. High Costs of Devices
- 3.4. Market Trends
- 3.4.1. Mammography Segment is Expected to Grow With a Significant CAGR Over the Forecast Period of the Study
- 4. Market Factor Analysis
- 4.1. Porters Five Forces
- 4.2. Supply/Value Chain
- 4.3. PESTEL analysis
- 4.4. Market Entropy
- 4.5. Patent/Trademark Analysis
- 5. Global APAC Portable X-Ray Devices Industry Analysis, Insights and Forecast, 2019-2031
- 5.1. Market Analysis, Insights and Forecast - by Technology
- 5.1.1. Analog X-ray
- 5.1.2. Digital X-ray
- 5.2. Market Analysis, Insights and Forecast - by Application
- 5.2.1. Dental X-ray
- 5.2.2. Mammography
- 5.2.3. Chest X-ray
- 5.2.4. Abdomen X-ray
- 5.3. Market Analysis, Insights and Forecast - by Modality
- 5.3.1. Handheld X-ray Devices
- 5.3.2. Mobile X-ray Devices
- 5.4. Market Analysis, Insights and Forecast - by Geography
- 5.4.1. China
- 5.4.2. Japan
- 5.4.3. India
- 5.4.4. Australia
- 5.4.5. South Korea
- 5.4.6. Rest of Asia-Pacific
- 5.5. Market Analysis, Insights and Forecast - by Region
- 5.5.1. China
- 5.5.2. Japan
- 5.5.3. India
- 5.5.4. Australia
- 5.5.5. South Korea
- 5.5.6. Rest of Asia Pacific
- 5.1. Market Analysis, Insights and Forecast - by Technology
- 6. China APAC Portable X-Ray Devices Industry Analysis, Insights and Forecast, 2019-2031
- 6.1. Market Analysis, Insights and Forecast - by Technology
- 6.1.1. Analog X-ray
- 6.1.2. Digital X-ray
- 6.2. Market Analysis, Insights and Forecast - by Application
- 6.2.1. Dental X-ray
- 6.2.2. Mammography
- 6.2.3. Chest X-ray
- 6.2.4. Abdomen X-ray
- 6.3. Market Analysis, Insights and Forecast - by Modality
- 6.3.1. Handheld X-ray Devices
- 6.3.2. Mobile X-ray Devices
- 6.4. Market Analysis, Insights and Forecast - by Geography
- 6.4.1. China
- 6.4.2. Japan
- 6.4.3. India
- 6.4.4. Australia
- 6.4.5. South Korea
- 6.4.6. Rest of Asia-Pacific
- 6.1. Market Analysis, Insights and Forecast - by Technology
- 7. Japan APAC Portable X-Ray Devices Industry Analysis, Insights and Forecast, 2019-2031
- 7.1. Market Analysis, Insights and Forecast - by Technology
- 7.1.1. Analog X-ray
- 7.1.2. Digital X-ray
- 7.2. Market Analysis, Insights and Forecast - by Application
- 7.2.1. Dental X-ray
- 7.2.2. Mammography
- 7.2.3. Chest X-ray
- 7.2.4. Abdomen X-ray
- 7.3. Market Analysis, Insights and Forecast - by Modality
- 7.3.1. Handheld X-ray Devices
- 7.3.2. Mobile X-ray Devices
- 7.4. Market Analysis, Insights and Forecast - by Geography
- 7.4.1. China
- 7.4.2. Japan
- 7.4.3. India
- 7.4.4. Australia
- 7.4.5. South Korea
- 7.4.6. Rest of Asia-Pacific
- 7.1. Market Analysis, Insights and Forecast - by Technology
- 8. India APAC Portable X-Ray Devices Industry Analysis, Insights and Forecast, 2019-2031
- 8.1. Market Analysis, Insights and Forecast - by Technology
- 8.1.1. Analog X-ray
- 8.1.2. Digital X-ray
- 8.2. Market Analysis, Insights and Forecast - by Application
- 8.2.1. Dental X-ray
- 8.2.2. Mammography
- 8.2.3. Chest X-ray
- 8.2.4. Abdomen X-ray
- 8.3. Market Analysis, Insights and Forecast - by Modality
- 8.3.1. Handheld X-ray Devices
- 8.3.2. Mobile X-ray Devices
- 8.4. Market Analysis, Insights and Forecast - by Geography
- 8.4.1. China
- 8.4.2. Japan
- 8.4.3. India
- 8.4.4. Australia
- 8.4.5. South Korea
- 8.4.6. Rest of Asia-Pacific
- 8.1. Market Analysis, Insights and Forecast - by Technology
- 9. Australia APAC Portable X-Ray Devices Industry Analysis, Insights and Forecast, 2019-2031
- 9.1. Market Analysis, Insights and Forecast - by Technology
- 9.1.1. Analog X-ray
- 9.1.2. Digital X-ray
- 9.2. Market Analysis, Insights and Forecast - by Application
- 9.2.1. Dental X-ray
- 9.2.2. Mammography
- 9.2.3. Chest X-ray
- 9.2.4. Abdomen X-ray
- 9.3. Market Analysis, Insights and Forecast - by Modality
- 9.3.1. Handheld X-ray Devices
- 9.3.2. Mobile X-ray Devices
- 9.4. Market Analysis, Insights and Forecast - by Geography
- 9.4.1. China
- 9.4.2. Japan
- 9.4.3. India
- 9.4.4. Australia
- 9.4.5. South Korea
- 9.4.6. Rest of Asia-Pacific
- 9.1. Market Analysis, Insights and Forecast - by Technology
- 10. South Korea APAC Portable X-Ray Devices Industry Analysis, Insights and Forecast, 2019-2031
- 10.1. Market Analysis, Insights and Forecast - by Technology
- 10.1.1. Analog X-ray
- 10.1.2. Digital X-ray
- 10.2. Market Analysis, Insights and Forecast - by Application
- 10.2.1. Dental X-ray
- 10.2.2. Mammography
- 10.2.3. Chest X-ray
- 10.2.4. Abdomen X-ray
- 10.3. Market Analysis, Insights and Forecast - by Modality
- 10.3.1. Handheld X-ray Devices
- 10.3.2. Mobile X-ray Devices
- 10.4. Market Analysis, Insights and Forecast - by Geography
- 10.4.1. China
- 10.4.2. Japan
- 10.4.3. India
- 10.4.4. Australia
- 10.4.5. South Korea
- 10.4.6. Rest of Asia-Pacific
- 10.1. Market Analysis, Insights and Forecast - by Technology
- 11. Rest of Asia Pacific APAC Portable X-Ray Devices Industry Analysis, Insights and Forecast, 2019-2031
- 11.1. Market Analysis, Insights and Forecast - by Technology
- 11.1.1. Analog X-ray
- 11.1.2. Digital X-ray
- 11.2. Market Analysis, Insights and Forecast - by Application
- 11.2.1. Dental X-ray
- 11.2.2. Mammography
- 11.2.3. Chest X-ray
- 11.2.4. Abdomen X-ray
- 11.3. Market Analysis, Insights and Forecast - by Modality
- 11.3.1. Handheld X-ray Devices
- 11.3.2. Mobile X-ray Devices
- 11.4. Market Analysis, Insights and Forecast - by Geography
- 11.4.1. China
- 11.4.2. Japan
- 11.4.3. India
- 11.4.4. Australia
- 11.4.5. South Korea
- 11.4.6. Rest of Asia-Pacific
- 11.1. Market Analysis, Insights and Forecast - by Technology
- 12. North America APAC Portable X-Ray Devices Industry Analysis, Insights and Forecast, 2019-2031
- 12.1. Market Analysis, Insights and Forecast - By Country/Sub-region
- 12.1.1 United States
- 12.1.2 Canada
- 12.1.3 Mexico
- 13. Europe APAC Portable X-Ray Devices Industry Analysis, Insights and Forecast, 2019-2031
- 13.1. Market Analysis, Insights and Forecast - By Country/Sub-region
- 13.1.1 Germany
- 13.1.2 United Kingdom
- 13.1.3 France
- 13.1.4 Spain
- 13.1.5 Italy
- 13.1.6 Spain
- 13.1.7 Belgium
- 13.1.8 Netherland
- 13.1.9 Nordics
- 13.1.10 Rest of Europe
- 14. Asia Pacific APAC Portable X-Ray Devices Industry Analysis, Insights and Forecast, 2019-2031
- 14.1. Market Analysis, Insights and Forecast - By Country/Sub-region
- 14.1.1 China
- 14.1.2 Japan
- 14.1.3 India
- 14.1.4 South Korea
- 14.1.5 Southeast Asia
- 14.1.6 Australia
- 14.1.7 Indonesia
- 14.1.8 Phillipes
- 14.1.9 Singapore
- 14.1.10 Thailandc
- 14.1.11 Rest of Asia Pacific
- 15. South America APAC Portable X-Ray Devices Industry Analysis, Insights and Forecast, 2019-2031
- 15.1. Market Analysis, Insights and Forecast - By Country/Sub-region
- 15.1.1 Brazil
- 15.1.2 Argentina
- 15.1.3 Peru
- 15.1.4 Chile
- 15.1.5 Colombia
- 15.1.6 Ecuador
- 15.1.7 Venezuela
- 15.1.8 Rest of South America
- 16. MEA APAC Portable X-Ray Devices Industry Analysis, Insights and Forecast, 2019-2031
- 16.1. Market Analysis, Insights and Forecast - By Country/Sub-region
- 16.1.1 United Arab Emirates
- 16.1.2 Saudi Arabia
- 16.1.3 South Africa
- 16.1.4 Rest of Middle East and Africa
- 17. Competitive Analysis
- 17.1. Global Market Share Analysis 2024
- 17.2. Company Profiles
- 17.2.1 Samsung Group
- 17.2.1.1. Overview
- 17.2.1.2. Products
- 17.2.1.3. SWOT Analysis
- 17.2.1.4. Recent Developments
- 17.2.1.5. Financials (Based on Availability)
- 17.2.2 Canon Inc
- 17.2.2.1. Overview
- 17.2.2.2. Products
- 17.2.2.3. SWOT Analysis
- 17.2.2.4. Recent Developments
- 17.2.2.5. Financials (Based on Availability)
- 17.2.3 Hologic Inc
- 17.2.3.1. Overview
- 17.2.3.2. Products
- 17.2.3.3. SWOT Analysis
- 17.2.3.4. Recent Developments
- 17.2.3.5. Financials (Based on Availability)
- 17.2.4 Hitachi Ltd
- 17.2.4.1. Overview
- 17.2.4.2. Products
- 17.2.4.3. SWOT Analysis
- 17.2.4.4. Recent Developments
- 17.2.4.5. Financials (Based on Availability)
- 17.2.5 Koninklijke Philips N V
- 17.2.5.1. Overview
- 17.2.5.2. Products
- 17.2.5.3. SWOT Analysis
- 17.2.5.4. Recent Developments
- 17.2.5.5. Financials (Based on Availability)
- 17.2.6 Siemens AG
- 17.2.6.1. Overview
- 17.2.6.2. Products
- 17.2.6.3. SWOT Analysis
- 17.2.6.4. Recent Developments
- 17.2.6.5. Financials (Based on Availability)
- 17.2.7 GE Healthcare
- 17.2.7.1. Overview
- 17.2.7.2. Products
- 17.2.7.3. SWOT Analysis
- 17.2.7.4. Recent Developments
- 17.2.7.5. Financials (Based on Availability)
- 17.2.8 Carestream Health Inc
- 17.2.8.1. Overview
- 17.2.8.2. Products
- 17.2.8.3. SWOT Analysis
- 17.2.8.4. Recent Developments
- 17.2.8.5. Financials (Based on Availability)
- 17.2.9 Shimadzu Corporation
- 17.2.9.1. Overview
- 17.2.9.2. Products
- 17.2.9.3. SWOT Analysis
- 17.2.9.4. Recent Developments
- 17.2.9.5. Financials (Based on Availability)
- 17.2.10 Fujifilm Holdings Corporation
- 17.2.10.1. Overview
- 17.2.10.2. Products
- 17.2.10.3. SWOT Analysis
- 17.2.10.4. Recent Developments
- 17.2.10.5. Financials (Based on Availability)
- 17.2.1 Samsung Group
List of Figures
- Figure 1: Global APAC Portable X-Ray Devices Industry Revenue Breakdown (Million, %) by Region 2024 & 2032
- Figure 2: Global APAC Portable X-Ray Devices Industry Volume Breakdown (K Unit, %) by Region 2024 & 2032
- Figure 3: North America APAC Portable X-Ray Devices Industry Revenue (Million), by Country 2024 & 2032
- Figure 4: North America APAC Portable X-Ray Devices Industry Volume (K Unit), by Country 2024 & 2032
- Figure 5: North America APAC Portable X-Ray Devices Industry Revenue Share (%), by Country 2024 & 2032
- Figure 6: North America APAC Portable X-Ray Devices Industry Volume Share (%), by Country 2024 & 2032
- Figure 7: Europe APAC Portable X-Ray Devices Industry Revenue (Million), by Country 2024 & 2032
- Figure 8: Europe APAC Portable X-Ray Devices Industry Volume (K Unit), by Country 2024 & 2032
- Figure 9: Europe APAC Portable X-Ray Devices Industry Revenue Share (%), by Country 2024 & 2032
- Figure 10: Europe APAC Portable X-Ray Devices Industry Volume Share (%), by Country 2024 & 2032
- Figure 11: Asia Pacific APAC Portable X-Ray Devices Industry Revenue (Million), by Country 2024 & 2032
- Figure 12: Asia Pacific APAC Portable X-Ray Devices Industry Volume (K Unit), by Country 2024 & 2032
- Figure 13: Asia Pacific APAC Portable X-Ray Devices Industry Revenue Share (%), by Country 2024 & 2032
- Figure 14: Asia Pacific APAC Portable X-Ray Devices Industry Volume Share (%), by Country 2024 & 2032
- Figure 15: South America APAC Portable X-Ray Devices Industry Revenue (Million), by Country 2024 & 2032
- Figure 16: South America APAC Portable X-Ray Devices Industry Volume (K Unit), by Country 2024 & 2032
- Figure 17: South America APAC Portable X-Ray Devices Industry Revenue Share (%), by Country 2024 & 2032
- Figure 18: South America APAC Portable X-Ray Devices Industry Volume Share (%), by Country 2024 & 2032
- Figure 19: MEA APAC Portable X-Ray Devices Industry Revenue (Million), by Country 2024 & 2032
- Figure 20: MEA APAC Portable X-Ray Devices Industry Volume (K Unit), by Country 2024 & 2032
- Figure 21: MEA APAC Portable X-Ray Devices Industry Revenue Share (%), by Country 2024 & 2032
- Figure 22: MEA APAC Portable X-Ray Devices Industry Volume Share (%), by Country 2024 & 2032
- Figure 23: China APAC Portable X-Ray Devices Industry Revenue (Million), by Technology 2024 & 2032
- Figure 24: China APAC Portable X-Ray Devices Industry Volume (K Unit), by Technology 2024 & 2032
- Figure 25: China APAC Portable X-Ray Devices Industry Revenue Share (%), by Technology 2024 & 2032
- Figure 26: China APAC Portable X-Ray Devices Industry Volume Share (%), by Technology 2024 & 2032
- Figure 27: China APAC Portable X-Ray Devices Industry Revenue (Million), by Application 2024 & 2032
- Figure 28: China APAC Portable X-Ray Devices Industry Volume (K Unit), by Application 2024 & 2032
- Figure 29: China APAC Portable X-Ray Devices Industry Revenue Share (%), by Application 2024 & 2032
- Figure 30: China APAC Portable X-Ray Devices Industry Volume Share (%), by Application 2024 & 2032
- Figure 31: China APAC Portable X-Ray Devices Industry Revenue (Million), by Modality 2024 & 2032
- Figure 32: China APAC Portable X-Ray Devices Industry Volume (K Unit), by Modality 2024 & 2032
- Figure 33: China APAC Portable X-Ray Devices Industry Revenue Share (%), by Modality 2024 & 2032
- Figure 34: China APAC Portable X-Ray Devices Industry Volume Share (%), by Modality 2024 & 2032
- Figure 35: China APAC Portable X-Ray Devices Industry Revenue (Million), by Geography 2024 & 2032
- Figure 36: China APAC Portable X-Ray Devices Industry Volume (K Unit), by Geography 2024 & 2032
- Figure 37: China APAC Portable X-Ray Devices Industry Revenue Share (%), by Geography 2024 & 2032
- Figure 38: China APAC Portable X-Ray Devices Industry Volume Share (%), by Geography 2024 & 2032
- Figure 39: China APAC Portable X-Ray Devices Industry Revenue (Million), by Country 2024 & 2032
- Figure 40: China APAC Portable X-Ray Devices Industry Volume (K Unit), by Country 2024 & 2032
- Figure 41: China APAC Portable X-Ray Devices Industry Revenue Share (%), by Country 2024 & 2032
- Figure 42: China APAC Portable X-Ray Devices Industry Volume Share (%), by Country 2024 & 2032
- Figure 43: Japan APAC Portable X-Ray Devices Industry Revenue (Million), by Technology 2024 & 2032
- Figure 44: Japan APAC Portable X-Ray Devices Industry Volume (K Unit), by Technology 2024 & 2032
- Figure 45: Japan APAC Portable X-Ray Devices Industry Revenue Share (%), by Technology 2024 & 2032
- Figure 46: Japan APAC Portable X-Ray Devices Industry Volume Share (%), by Technology 2024 & 2032
- Figure 47: Japan APAC Portable X-Ray Devices Industry Revenue (Million), by Application 2024 & 2032
- Figure 48: Japan APAC Portable X-Ray Devices Industry Volume (K Unit), by Application 2024 & 2032
- Figure 49: Japan APAC Portable X-Ray Devices Industry Revenue Share (%), by Application 2024 & 2032
- Figure 50: Japan APAC Portable X-Ray Devices Industry Volume Share (%), by Application 2024 & 2032
- Figure 51: Japan APAC Portable X-Ray Devices Industry Revenue (Million), by Modality 2024 & 2032
- Figure 52: Japan APAC Portable X-Ray Devices Industry Volume (K Unit), by Modality 2024 & 2032
- Figure 53: Japan APAC Portable X-Ray Devices Industry Revenue Share (%), by Modality 2024 & 2032
- Figure 54: Japan APAC Portable X-Ray Devices Industry Volume Share (%), by Modality 2024 & 2032
- Figure 55: Japan APAC Portable X-Ray Devices Industry Revenue (Million), by Geography 2024 & 2032
- Figure 56: Japan APAC Portable X-Ray Devices Industry Volume (K Unit), by Geography 2024 & 2032
- Figure 57: Japan APAC Portable X-Ray Devices Industry Revenue Share (%), by Geography 2024 & 2032
- Figure 58: Japan APAC Portable X-Ray Devices Industry Volume Share (%), by Geography 2024 & 2032
- Figure 59: Japan APAC Portable X-Ray Devices Industry Revenue (Million), by Country 2024 & 2032
- Figure 60: Japan APAC Portable X-Ray Devices Industry Volume (K Unit), by Country 2024 & 2032
- Figure 61: Japan APAC Portable X-Ray Devices Industry Revenue Share (%), by Country 2024 & 2032
- Figure 62: Japan APAC Portable X-Ray Devices Industry Volume Share (%), by Country 2024 & 2032
- Figure 63: India APAC Portable X-Ray Devices Industry Revenue (Million), by Technology 2024 & 2032
- Figure 64: India APAC Portable X-Ray Devices Industry Volume (K Unit), by Technology 2024 & 2032
- Figure 65: India APAC Portable X-Ray Devices Industry Revenue Share (%), by Technology 2024 & 2032
- Figure 66: India APAC Portable X-Ray Devices Industry Volume Share (%), by Technology 2024 & 2032
- Figure 67: India APAC Portable X-Ray Devices Industry Revenue (Million), by Application 2024 & 2032
- Figure 68: India APAC Portable X-Ray Devices Industry Volume (K Unit), by Application 2024 & 2032
- Figure 69: India APAC Portable X-Ray Devices Industry Revenue Share (%), by Application 2024 & 2032
- Figure 70: India APAC Portable X-Ray Devices Industry Volume Share (%), by Application 2024 & 2032
- Figure 71: India APAC Portable X-Ray Devices Industry Revenue (Million), by Modality 2024 & 2032
- Figure 72: India APAC Portable X-Ray Devices Industry Volume (K Unit), by Modality 2024 & 2032
- Figure 73: India APAC Portable X-Ray Devices Industry Revenue Share (%), by Modality 2024 & 2032
- Figure 74: India APAC Portable X-Ray Devices Industry Volume Share (%), by Modality 2024 & 2032
- Figure 75: India APAC Portable X-Ray Devices Industry Revenue (Million), by Geography 2024 & 2032
- Figure 76: India APAC Portable X-Ray Devices Industry Volume (K Unit), by Geography 2024 & 2032
- Figure 77: India APAC Portable X-Ray Devices Industry Revenue Share (%), by Geography 2024 & 2032
- Figure 78: India APAC Portable X-Ray Devices Industry Volume Share (%), by Geography 2024 & 2032
- Figure 79: India APAC Portable X-Ray Devices Industry Revenue (Million), by Country 2024 & 2032
- Figure 80: India APAC Portable X-Ray Devices Industry Volume (K Unit), by Country 2024 & 2032
- Figure 81: India APAC Portable X-Ray Devices Industry Revenue Share (%), by Country 2024 & 2032
- Figure 82: India APAC Portable X-Ray Devices Industry Volume Share (%), by Country 2024 & 2032
- Figure 83: Australia APAC Portable X-Ray Devices Industry Revenue (Million), by Technology 2024 & 2032
- Figure 84: Australia APAC Portable X-Ray Devices Industry Volume (K Unit), by Technology 2024 & 2032
- Figure 85: Australia APAC Portable X-Ray Devices Industry Revenue Share (%), by Technology 2024 & 2032
- Figure 86: Australia APAC Portable X-Ray Devices Industry Volume Share (%), by Technology 2024 & 2032
- Figure 87: Australia APAC Portable X-Ray Devices Industry Revenue (Million), by Application 2024 & 2032
- Figure 88: Australia APAC Portable X-Ray Devices Industry Volume (K Unit), by Application 2024 & 2032
- Figure 89: Australia APAC Portable X-Ray Devices Industry Revenue Share (%), by Application 2024 & 2032
- Figure 90: Australia APAC Portable X-Ray Devices Industry Volume Share (%), by Application 2024 & 2032
- Figure 91: Australia APAC Portable X-Ray Devices Industry Revenue (Million), by Modality 2024 & 2032
- Figure 92: Australia APAC Portable X-Ray Devices Industry Volume (K Unit), by Modality 2024 & 2032
- Figure 93: Australia APAC Portable X-Ray Devices Industry Revenue Share (%), by Modality 2024 & 2032
- Figure 94: Australia APAC Portable X-Ray Devices Industry Volume Share (%), by Modality 2024 & 2032
- Figure 95: Australia APAC Portable X-Ray Devices Industry Revenue (Million), by Geography 2024 & 2032
- Figure 96: Australia APAC Portable X-Ray Devices Industry Volume (K Unit), by Geography 2024 & 2032
- Figure 97: Australia APAC Portable X-Ray Devices Industry Revenue Share (%), by Geography 2024 & 2032
- Figure 98: Australia APAC Portable X-Ray Devices Industry Volume Share (%), by Geography 2024 & 2032
- Figure 99: Australia APAC Portable X-Ray Devices Industry Revenue (Million), by Country 2024 & 2032
- Figure 100: Australia APAC Portable X-Ray Devices Industry Volume (K Unit), by Country 2024 & 2032
- Figure 101: Australia APAC Portable X-Ray Devices Industry Revenue Share (%), by Country 2024 & 2032
- Figure 102: Australia APAC Portable X-Ray Devices Industry Volume Share (%), by Country 2024 & 2032
- Figure 103: South Korea APAC Portable X-Ray Devices Industry Revenue (Million), by Technology 2024 & 2032
- Figure 104: South Korea APAC Portable X-Ray Devices Industry Volume (K Unit), by Technology 2024 & 2032
- Figure 105: South Korea APAC Portable X-Ray Devices Industry Revenue Share (%), by Technology 2024 & 2032
- Figure 106: South Korea APAC Portable X-Ray Devices Industry Volume Share (%), by Technology 2024 & 2032
- Figure 107: South Korea APAC Portable X-Ray Devices Industry Revenue (Million), by Application 2024 & 2032
- Figure 108: South Korea APAC Portable X-Ray Devices Industry Volume (K Unit), by Application 2024 & 2032
- Figure 109: South Korea APAC Portable X-Ray Devices Industry Revenue Share (%), by Application 2024 & 2032
- Figure 110: South Korea APAC Portable X-Ray Devices Industry Volume Share (%), by Application 2024 & 2032
- Figure 111: South Korea APAC Portable X-Ray Devices Industry Revenue (Million), by Modality 2024 & 2032
- Figure 112: South Korea APAC Portable X-Ray Devices Industry Volume (K Unit), by Modality 2024 & 2032
- Figure 113: South Korea APAC Portable X-Ray Devices Industry Revenue Share (%), by Modality 2024 & 2032
- Figure 114: South Korea APAC Portable X-Ray Devices Industry Volume Share (%), by Modality 2024 & 2032
- Figure 115: South Korea APAC Portable X-Ray Devices Industry Revenue (Million), by Geography 2024 & 2032
- Figure 116: South Korea APAC Portable X-Ray Devices Industry Volume (K Unit), by Geography 2024 & 2032
- Figure 117: South Korea APAC Portable X-Ray Devices Industry Revenue Share (%), by Geography 2024 & 2032
- Figure 118: South Korea APAC Portable X-Ray Devices Industry Volume Share (%), by Geography 2024 & 2032
- Figure 119: South Korea APAC Portable X-Ray Devices Industry Revenue (Million), by Country 2024 & 2032
- Figure 120: South Korea APAC Portable X-Ray Devices Industry Volume (K Unit), by Country 2024 & 2032
- Figure 121: South Korea APAC Portable X-Ray Devices Industry Revenue Share (%), by Country 2024 & 2032
- Figure 122: South Korea APAC Portable X-Ray Devices Industry Volume Share (%), by Country 2024 & 2032
- Figure 123: Rest of Asia Pacific APAC Portable X-Ray Devices Industry Revenue (Million), by Technology 2024 & 2032
- Figure 124: Rest of Asia Pacific APAC Portable X-Ray Devices Industry Volume (K Unit), by Technology 2024 & 2032
- Figure 125: Rest of Asia Pacific APAC Portable X-Ray Devices Industry Revenue Share (%), by Technology 2024 & 2032
- Figure 126: Rest of Asia Pacific APAC Portable X-Ray Devices Industry Volume Share (%), by Technology 2024 & 2032
- Figure 127: Rest of Asia Pacific APAC Portable X-Ray Devices Industry Revenue (Million), by Application 2024 & 2032
- Figure 128: Rest of Asia Pacific APAC Portable X-Ray Devices Industry Volume (K Unit), by Application 2024 & 2032
- Figure 129: Rest of Asia Pacific APAC Portable X-Ray Devices Industry Revenue Share (%), by Application 2024 & 2032
- Figure 130: Rest of Asia Pacific APAC Portable X-Ray Devices Industry Volume Share (%), by Application 2024 & 2032
- Figure 131: Rest of Asia Pacific APAC Portable X-Ray Devices Industry Revenue (Million), by Modality 2024 & 2032
- Figure 132: Rest of Asia Pacific APAC Portable X-Ray Devices Industry Volume (K Unit), by Modality 2024 & 2032
- Figure 133: Rest of Asia Pacific APAC Portable X-Ray Devices Industry Revenue Share (%), by Modality 2024 & 2032
- Figure 134: Rest of Asia Pacific APAC Portable X-Ray Devices Industry Volume Share (%), by Modality 2024 & 2032
- Figure 135: Rest of Asia Pacific APAC Portable X-Ray Devices Industry Revenue (Million), by Geography 2024 & 2032
- Figure 136: Rest of Asia Pacific APAC Portable X-Ray Devices Industry Volume (K Unit), by Geography 2024 & 2032
- Figure 137: Rest of Asia Pacific APAC Portable X-Ray Devices Industry Revenue Share (%), by Geography 2024 & 2032
- Figure 138: Rest of Asia Pacific APAC Portable X-Ray Devices Industry Volume Share (%), by Geography 2024 & 2032
- Figure 139: Rest of Asia Pacific APAC Portable X-Ray Devices Industry Revenue (Million), by Country 2024 & 2032
- Figure 140: Rest of Asia Pacific APAC Portable X-Ray Devices Industry Volume (K Unit), by Country 2024 & 2032
- Figure 141: Rest of Asia Pacific APAC Portable X-Ray Devices Industry Revenue Share (%), by Country 2024 & 2032
- Figure 142: Rest of Asia Pacific APAC Portable X-Ray Devices Industry Volume Share (%), by Country 2024 & 2032
List of Tables
- Table 1: Global APAC Portable X-Ray Devices Industry Revenue Million Forecast, by Region 2019 & 2032
- Table 2: Global APAC Portable X-Ray Devices Industry Volume K Unit Forecast, by Region 2019 & 2032
- Table 3: Global APAC Portable X-Ray Devices Industry Revenue Million Forecast, by Technology 2019 & 2032
- Table 4: Global APAC Portable X-Ray Devices Industry Volume K Unit Forecast, by Technology 2019 & 2032
- Table 5: Global APAC Portable X-Ray Devices Industry Revenue Million Forecast, by Application 2019 & 2032
- Table 6: Global APAC Portable X-Ray Devices Industry Volume K Unit Forecast, by Application 2019 & 2032
- Table 7: Global APAC Portable X-Ray Devices Industry Revenue Million Forecast, by Modality 2019 & 2032
- Table 8: Global APAC Portable X-Ray Devices Industry Volume K Unit Forecast, by Modality 2019 & 2032
- Table 9: Global APAC Portable X-Ray Devices Industry Revenue Million Forecast, by Geography 2019 & 2032
- Table 10: Global APAC Portable X-Ray Devices Industry Volume K Unit Forecast, by Geography 2019 & 2032
- Table 11: Global APAC Portable X-Ray Devices Industry Revenue Million Forecast, by Region 2019 & 2032
- Table 12: Global APAC Portable X-Ray Devices Industry Volume K Unit Forecast, by Region 2019 & 2032
- Table 13: Global APAC Portable X-Ray Devices Industry Revenue Million Forecast, by Country 2019 & 2032
- Table 14: Global APAC Portable X-Ray Devices Industry Volume K Unit Forecast, by Country 2019 & 2032
- Table 15: United States APAC Portable X-Ray Devices Industry Revenue (Million) Forecast, by Application 2019 & 2032
- Table 16: United States APAC Portable X-Ray Devices Industry Volume (K Unit) Forecast, by Application 2019 & 2032
- Table 17: Canada APAC Portable X-Ray Devices Industry Revenue (Million) Forecast, by Application 2019 & 2032
- Table 18: Canada APAC Portable X-Ray Devices Industry Volume (K Unit) Forecast, by Application 2019 & 2032
- Table 19: Mexico APAC Portable X-Ray Devices Industry Revenue (Million) Forecast, by Application 2019 & 2032
- Table 20: Mexico APAC Portable X-Ray Devices Industry Volume (K Unit) Forecast, by Application 2019 & 2032
- Table 21: Global APAC Portable X-Ray Devices Industry Revenue Million Forecast, by Country 2019 & 2032
- Table 22: Global APAC Portable X-Ray Devices Industry Volume K Unit Forecast, by Country 2019 & 2032
- Table 23: Germany APAC Portable X-Ray Devices Industry Revenue (Million) Forecast, by Application 2019 & 2032
- Table 24: Germany APAC Portable X-Ray Devices Industry Volume (K Unit) Forecast, by Application 2019 & 2032
- Table 25: United Kingdom APAC Portable X-Ray Devices Industry Revenue (Million) Forecast, by Application 2019 & 2032
- Table 26: United Kingdom APAC Portable X-Ray Devices Industry Volume (K Unit) Forecast, by Application 2019 & 2032
- Table 27: France APAC Portable X-Ray Devices Industry Revenue (Million) Forecast, by Application 2019 & 2032
- Table 28: France APAC Portable X-Ray Devices Industry Volume (K Unit) Forecast, by Application 2019 & 2032
- Table 29: Spain APAC Portable X-Ray Devices Industry Revenue (Million) Forecast, by Application 2019 & 2032
- Table 30: Spain APAC Portable X-Ray Devices Industry Volume (K Unit) Forecast, by Application 2019 & 2032
- Table 31: Italy APAC Portable X-Ray Devices Industry Revenue (Million) Forecast, by Application 2019 & 2032
- Table 32: Italy APAC Portable X-Ray Devices Industry Volume (K Unit) Forecast, by Application 2019 & 2032
- Table 33: Spain APAC Portable X-Ray Devices Industry Revenue (Million) Forecast, by Application 2019 & 2032
- Table 34: Spain APAC Portable X-Ray Devices Industry Volume (K Unit) Forecast, by Application 2019 & 2032
- Table 35: Belgium APAC Portable X-Ray Devices Industry Revenue (Million) Forecast, by Application 2019 & 2032
- Table 36: Belgium APAC Portable X-Ray Devices Industry Volume (K Unit) Forecast, by Application 2019 & 2032
- Table 37: Netherland APAC Portable X-Ray Devices Industry Revenue (Million) Forecast, by Application 2019 & 2032
- Table 38: Netherland APAC Portable X-Ray Devices Industry Volume (K Unit) Forecast, by Application 2019 & 2032
- Table 39: Nordics APAC Portable X-Ray Devices Industry Revenue (Million) Forecast, by Application 2019 & 2032
- Table 40: Nordics APAC Portable X-Ray Devices Industry Volume (K Unit) Forecast, by Application 2019 & 2032
- Table 41: Rest of Europe APAC Portable X-Ray Devices Industry Revenue (Million) Forecast, by Application 2019 & 2032
- Table 42: Rest of Europe APAC Portable X-Ray Devices Industry Volume (K Unit) Forecast, by Application 2019 & 2032
- Table 43: Global APAC Portable X-Ray Devices Industry Revenue Million Forecast, by Country 2019 & 2032
- Table 44: Global APAC Portable X-Ray Devices Industry Volume K Unit Forecast, by Country 2019 & 2032
- Table 45: China APAC Portable X-Ray Devices Industry Revenue (Million) Forecast, by Application 2019 & 2032
- Table 46: China APAC Portable X-Ray Devices Industry Volume (K Unit) Forecast, by Application 2019 & 2032
- Table 47: Japan APAC Portable X-Ray Devices Industry Revenue (Million) Forecast, by Application 2019 & 2032
- Table 48: Japan APAC Portable X-Ray Devices Industry Volume (K Unit) Forecast, by Application 2019 & 2032
- Table 49: India APAC Portable X-Ray Devices Industry Revenue (Million) Forecast, by Application 2019 & 2032
- Table 50: India APAC Portable X-Ray Devices Industry Volume (K Unit) Forecast, by Application 2019 & 2032
- Table 51: South Korea APAC Portable X-Ray Devices Industry Revenue (Million) Forecast, by Application 2019 & 2032
- Table 52: South Korea APAC Portable X-Ray Devices Industry Volume (K Unit) Forecast, by Application 2019 & 2032
- Table 53: Southeast Asia APAC Portable X-Ray Devices Industry Revenue (Million) Forecast, by Application 2019 & 2032
- Table 54: Southeast Asia APAC Portable X-Ray Devices Industry Volume (K Unit) Forecast, by Application 2019 & 2032
- Table 55: Australia APAC Portable X-Ray Devices Industry Revenue (Million) Forecast, by Application 2019 & 2032
- Table 56: Australia APAC Portable X-Ray Devices Industry Volume (K Unit) Forecast, by Application 2019 & 2032
- Table 57: Indonesia APAC Portable X-Ray Devices Industry Revenue (Million) Forecast, by Application 2019 & 2032
- Table 58: Indonesia APAC Portable X-Ray Devices Industry Volume (K Unit) Forecast, by Application 2019 & 2032
- Table 59: Phillipes APAC Portable X-Ray Devices Industry Revenue (Million) Forecast, by Application 2019 & 2032
- Table 60: Phillipes APAC Portable X-Ray Devices Industry Volume (K Unit) Forecast, by Application 2019 & 2032
- Table 61: Singapore APAC Portable X-Ray Devices Industry Revenue (Million) Forecast, by Application 2019 & 2032
- Table 62: Singapore APAC Portable X-Ray Devices Industry Volume (K Unit) Forecast, by Application 2019 & 2032
- Table 63: Thailandc APAC Portable X-Ray Devices Industry Revenue (Million) Forecast, by Application 2019 & 2032
- Table 64: Thailandc APAC Portable X-Ray Devices Industry Volume (K Unit) Forecast, by Application 2019 & 2032
- Table 65: Rest of Asia Pacific APAC Portable X-Ray Devices Industry Revenue (Million) Forecast, by Application 2019 & 2032
- Table 66: Rest of Asia Pacific APAC Portable X-Ray Devices Industry Volume (K Unit) Forecast, by Application 2019 & 2032
- Table 67: Global APAC Portable X-Ray Devices Industry Revenue Million Forecast, by Country 2019 & 2032
- Table 68: Global APAC Portable X-Ray Devices Industry Volume K Unit Forecast, by Country 2019 & 2032
- Table 69: Brazil APAC Portable X-Ray Devices Industry Revenue (Million) Forecast, by Application 2019 & 2032
- Table 70: Brazil APAC Portable X-Ray Devices Industry Volume (K Unit) Forecast, by Application 2019 & 2032
- Table 71: Argentina APAC Portable X-Ray Devices Industry Revenue (Million) Forecast, by Application 2019 & 2032
- Table 72: Argentina APAC Portable X-Ray Devices Industry Volume (K Unit) Forecast, by Application 2019 & 2032
- Table 73: Peru APAC Portable X-Ray Devices Industry Revenue (Million) Forecast, by Application 2019 & 2032
- Table 74: Peru APAC Portable X-Ray Devices Industry Volume (K Unit) Forecast, by Application 2019 & 2032
- Table 75: Chile APAC Portable X-Ray Devices Industry Revenue (Million) Forecast, by Application 2019 & 2032
- Table 76: Chile APAC Portable X-Ray Devices Industry Volume (K Unit) Forecast, by Application 2019 & 2032
- Table 77: Colombia APAC Portable X-Ray Devices Industry Revenue (Million) Forecast, by Application 2019 & 2032
- Table 78: Colombia APAC Portable X-Ray Devices Industry Volume (K Unit) Forecast, by Application 2019 & 2032
- Table 79: Ecuador APAC Portable X-Ray Devices Industry Revenue (Million) Forecast, by Application 2019 & 2032
- Table 80: Ecuador APAC Portable X-Ray Devices Industry Volume (K Unit) Forecast, by Application 2019 & 2032
- Table 81: Venezuela APAC Portable X-Ray Devices Industry Revenue (Million) Forecast, by Application 2019 & 2032
- Table 82: Venezuela APAC Portable X-Ray Devices Industry Volume (K Unit) Forecast, by Application 2019 & 2032
- Table 83: Rest of South America APAC Portable X-Ray Devices Industry Revenue (Million) Forecast, by Application 2019 & 2032
- Table 84: Rest of South America APAC Portable X-Ray Devices Industry Volume (K Unit) Forecast, by Application 2019 & 2032
- Table 85: Global APAC Portable X-Ray Devices Industry Revenue Million Forecast, by Country 2019 & 2032
- Table 86: Global APAC Portable X-Ray Devices Industry Volume K Unit Forecast, by Country 2019 & 2032
- Table 87: United Arab Emirates APAC Portable X-Ray Devices Industry Revenue (Million) Forecast, by Application 2019 & 2032
- Table 88: United Arab Emirates APAC Portable X-Ray Devices Industry Volume (K Unit) Forecast, by Application 2019 & 2032
- Table 89: Saudi Arabia APAC Portable X-Ray Devices Industry Revenue (Million) Forecast, by Application 2019 & 2032
- Table 90: Saudi Arabia APAC Portable X-Ray Devices Industry Volume (K Unit) Forecast, by Application 2019 & 2032
- Table 91: South Africa APAC Portable X-Ray Devices Industry Revenue (Million) Forecast, by Application 2019 & 2032
- Table 92: South Africa APAC Portable X-Ray Devices Industry Volume (K Unit) Forecast, by Application 2019 & 2032
- Table 93: Rest of Middle East and Africa APAC Portable X-Ray Devices Industry Revenue (Million) Forecast, by Application 2019 & 2032
- Table 94: Rest of Middle East and Africa APAC Portable X-Ray Devices Industry Volume (K Unit) Forecast, by Application 2019 & 2032
- Table 95: Global APAC Portable X-Ray Devices Industry Revenue Million Forecast, by Technology 2019 & 2032
- Table 96: Global APAC Portable X-Ray Devices Industry Volume K Unit Forecast, by Technology 2019 & 2032
- Table 97: Global APAC Portable X-Ray Devices Industry Revenue Million Forecast, by Application 2019 & 2032
- Table 98: Global APAC Portable X-Ray Devices Industry Volume K Unit Forecast, by Application 2019 & 2032
- Table 99: Global APAC Portable X-Ray Devices Industry Revenue Million Forecast, by Modality 2019 & 2032
- Table 100: Global APAC Portable X-Ray Devices Industry Volume K Unit Forecast, by Modality 2019 & 2032
- Table 101: Global APAC Portable X-Ray Devices Industry Revenue Million Forecast, by Geography 2019 & 2032
- Table 102: Global APAC Portable X-Ray Devices Industry Volume K Unit Forecast, by Geography 2019 & 2032
- Table 103: Global APAC Portable X-Ray Devices Industry Revenue Million Forecast, by Country 2019 & 2032
- Table 104: Global APAC Portable X-Ray Devices Industry Volume K Unit Forecast, by Country 2019 & 2032
- Table 105: Global APAC Portable X-Ray Devices Industry Revenue Million Forecast, by Technology 2019 & 2032
- Table 106: Global APAC Portable X-Ray Devices Industry Volume K Unit Forecast, by Technology 2019 & 2032
- Table 107: Global APAC Portable X-Ray Devices Industry Revenue Million Forecast, by Application 2019 & 2032
- Table 108: Global APAC Portable X-Ray Devices Industry Volume K Unit Forecast, by Application 2019 & 2032
- Table 109: Global APAC Portable X-Ray Devices Industry Revenue Million Forecast, by Modality 2019 & 2032
- Table 110: Global APAC Portable X-Ray Devices Industry Volume K Unit Forecast, by Modality 2019 & 2032
- Table 111: Global APAC Portable X-Ray Devices Industry Revenue Million Forecast, by Geography 2019 & 2032
- Table 112: Global APAC Portable X-Ray Devices Industry Volume K Unit Forecast, by Geography 2019 & 2032
- Table 113: Global APAC Portable X-Ray Devices Industry Revenue Million Forecast, by Country 2019 & 2032
- Table 114: Global APAC Portable X-Ray Devices Industry Volume K Unit Forecast, by Country 2019 & 2032
- Table 115: Global APAC Portable X-Ray Devices Industry Revenue Million Forecast, by Technology 2019 & 2032
- Table 116: Global APAC Portable X-Ray Devices Industry Volume K Unit Forecast, by Technology 2019 & 2032
- Table 117: Global APAC Portable X-Ray Devices Industry Revenue Million Forecast, by Application 2019 & 2032
- Table 118: Global APAC Portable X-Ray Devices Industry Volume K Unit Forecast, by Application 2019 & 2032
- Table 119: Global APAC Portable X-Ray Devices Industry Revenue Million Forecast, by Modality 2019 & 2032
- Table 120: Global APAC Portable X-Ray Devices Industry Volume K Unit Forecast, by Modality 2019 & 2032
- Table 121: Global APAC Portable X-Ray Devices Industry Revenue Million Forecast, by Geography 2019 & 2032
- Table 122: Global APAC Portable X-Ray Devices Industry Volume K Unit Forecast, by Geography 2019 & 2032
- Table 123: Global APAC Portable X-Ray Devices Industry Revenue Million Forecast, by Country 2019 & 2032
- Table 124: Global APAC Portable X-Ray Devices Industry Volume K Unit Forecast, by Country 2019 & 2032
- Table 125: Global APAC Portable X-Ray Devices Industry Revenue Million Forecast, by Technology 2019 & 2032
- Table 126: Global APAC Portable X-Ray Devices Industry Volume K Unit Forecast, by Technology 2019 & 2032
- Table 127: Global APAC Portable X-Ray Devices Industry Revenue Million Forecast, by Application 2019 & 2032
- Table 128: Global APAC Portable X-Ray Devices Industry Volume K Unit Forecast, by Application 2019 & 2032
- Table 129: Global APAC Portable X-Ray Devices Industry Revenue Million Forecast, by Modality 2019 & 2032
- Table 130: Global APAC Portable X-Ray Devices Industry Volume K Unit Forecast, by Modality 2019 & 2032
- Table 131: Global APAC Portable X-Ray Devices Industry Revenue Million Forecast, by Geography 2019 & 2032
- Table 132: Global APAC Portable X-Ray Devices Industry Volume K Unit Forecast, by Geography 2019 & 2032
- Table 133: Global APAC Portable X-Ray Devices Industry Revenue Million Forecast, by Country 2019 & 2032
- Table 134: Global APAC Portable X-Ray Devices Industry Volume K Unit Forecast, by Country 2019 & 2032
- Table 135: Global APAC Portable X-Ray Devices Industry Revenue Million Forecast, by Technology 2019 & 2032
- Table 136: Global APAC Portable X-Ray Devices Industry Volume K Unit Forecast, by Technology 2019 & 2032
- Table 137: Global APAC Portable X-Ray Devices Industry Revenue Million Forecast, by Application 2019 & 2032
- Table 138: Global APAC Portable X-Ray Devices Industry Volume K Unit Forecast, by Application 2019 & 2032
- Table 139: Global APAC Portable X-Ray Devices Industry Revenue Million Forecast, by Modality 2019 & 2032
- Table 140: Global APAC Portable X-Ray Devices Industry Volume K Unit Forecast, by Modality 2019 & 2032
- Table 141: Global APAC Portable X-Ray Devices Industry Revenue Million Forecast, by Geography 2019 & 2032
- Table 142: Global APAC Portable X-Ray Devices Industry Volume K Unit Forecast, by Geography 2019 & 2032
- Table 143: Global APAC Portable X-Ray Devices Industry Revenue Million Forecast, by Country 2019 & 2032
- Table 144: Global APAC Portable X-Ray Devices Industry Volume K Unit Forecast, by Country 2019 & 2032
- Table 145: Global APAC Portable X-Ray Devices Industry Revenue Million Forecast, by Technology 2019 & 2032
- Table 146: Global APAC Portable X-Ray Devices Industry Volume K Unit Forecast, by Technology 2019 & 2032
- Table 147: Global APAC Portable X-Ray Devices Industry Revenue Million Forecast, by Application 2019 & 2032
- Table 148: Global APAC Portable X-Ray Devices Industry Volume K Unit Forecast, by Application 2019 & 2032
- Table 149: Global APAC Portable X-Ray Devices Industry Revenue Million Forecast, by Modality 2019 & 2032
- Table 150: Global APAC Portable X-Ray Devices Industry Volume K Unit Forecast, by Modality 2019 & 2032
- Table 151: Global APAC Portable X-Ray Devices Industry Revenue Million Forecast, by Geography 2019 & 2032
- Table 152: Global APAC Portable X-Ray Devices Industry Volume K Unit Forecast, by Geography 2019 & 2032
- Table 153: Global APAC Portable X-Ray Devices Industry Revenue Million Forecast, by Country 2019 & 2032
- Table 154: Global APAC Portable X-Ray Devices Industry Volume K Unit Forecast, by Country 2019 & 2032
Frequently Asked Questions
1. What is the projected Compound Annual Growth Rate (CAGR) of the APAC Portable X-Ray Devices Industry?
The projected CAGR is approximately 10.75%.
2. Which companies are prominent players in the APAC Portable X-Ray Devices Industry?
Key companies in the market include Samsung Group, Canon Inc, Hologic Inc, Hitachi Ltd, Koninklijke Philips N V, Siemens AG, GE Healthcare, Carestream Health Inc, Shimadzu Corporation, Fujifilm Holdings Corporation.
3. What are the main segments of the APAC Portable X-Ray Devices Industry?
The market segments include Technology, Application, Modality, Geography.
4. Can you provide details about the market size?
The market size is estimated to be USD 1.54 Million as of 2022.
5. What are some drivers contributing to market growth?
Rising Burden of Diseases Requiring Diagnosis; Rising Technological Advancement of X-Ray Devices.
6. What are the notable trends driving market growth?
Mammography Segment is Expected to Grow With a Significant CAGR Over the Forecast Period of the Study.
7. Are there any restraints impacting market growth?
High Costs of Devices.
8. Can you provide examples of recent developments in the market?
February 2023: Carestream Health India launched its high-powered Carestream Motion Mobile X-ray system. The system is fully equipped to carry out a full range of general radiography examinations.
9. What pricing options are available for accessing the report?
Pricing options include single-user, multi-user, and enterprise licenses priced at USD 4750, USD 5250, and USD 8750 respectively.
10. Is the market size provided in terms of value or volume?
The market size is provided in terms of value, measured in Million and volume, measured in K Unit.
11. Are there any specific market keywords associated with the report?
Yes, the market keyword associated with the report is "APAC Portable X-Ray Devices Industry," which aids in identifying and referencing the specific market segment covered.
12. How do I determine which pricing option suits my needs best?
The pricing options vary based on user requirements and access needs. Individual users may opt for single-user licenses, while businesses requiring broader access may choose multi-user or enterprise licenses for cost-effective access to the report.
13. Are there any additional resources or data provided in the APAC Portable X-Ray Devices Industry report?
While the report offers comprehensive insights, it's advisable to review the specific contents or supplementary materials provided to ascertain if additional resources or data are available.
14. How can I stay updated on further developments or reports in the APAC Portable X-Ray Devices Industry?
To stay informed about further developments, trends, and reports in the APAC Portable X-Ray Devices Industry, consider subscribing to industry newsletters, following relevant companies and organizations, or regularly checking reputable industry news sources and publications.
Methodology
Step 1 - Identification of Relevant Samples Size from Population Database


Step 2 - Approaches for Defining Global Market Size (Value, Volume* & Price*)

Note*: In applicable scenarios
Step 3 - Data Sources
Primary Research
- Web Analytics
- Survey Reports
- Research Institute
- Latest Research Reports
- Opinion Leaders
Secondary Research
- Annual Reports
- White Paper
- Latest Press Release
- Industry Association
- Paid Database
- Investor Presentations

Step 4 - Data Triangulation
Involves using different sources of information in order to increase the validity of a study
These sources are likely to be stakeholders in a program - participants, other researchers, program staff, other community members, and so on.
Then we put all data in single framework & apply various statistical tools to find out the dynamic on the market.
During the analysis stage, feedback from the stakeholder groups would be compared to determine areas of agreement as well as areas of divergence


