
Key Insights
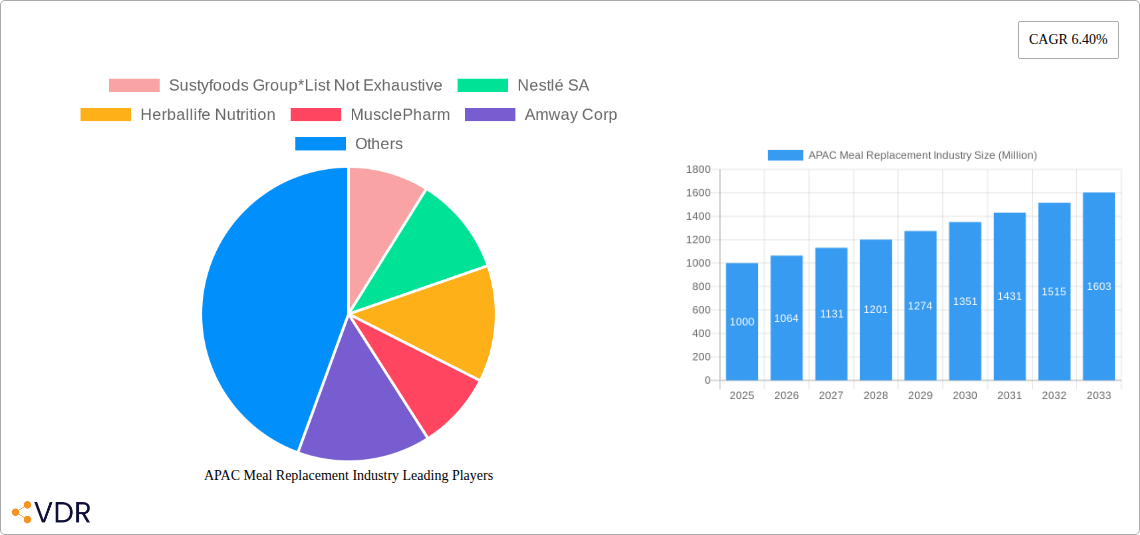
The Asia-Pacific (APAC) meal replacement market, valued at approximately $1,000 million in 2025, is projected to experience robust growth, driven by increasing health consciousness, busy lifestyles, and the rising prevalence of chronic diseases like obesity and diabetes. This burgeoning market is segmented by product type (ready-to-drink, bars, powders, others) and distribution channels (supermarkets, convenience stores, specialty stores, online). The convenience of ready-to-drink options and the expanding e-commerce sector significantly contribute to market expansion. Factors such as increasing disposable incomes, particularly in rapidly developing economies like India and China, further fuel market growth. However, concerns about the long-term health implications of relying heavily on meal replacements and the presence of potentially less healthy options within the market segment pose challenges. Competition is intense, with both established multinational corporations like Nestlé and local players vying for market share. The growing popularity of plant-based and functional meal replacements caters to evolving consumer preferences, leading to product innovation and diversification.
Specific growth within APAC is anticipated to outpace the global average due to a young and increasingly health-conscious population. The significant increase in the number of working professionals, coupled with changing dietary habits and an adoption of western lifestyles in several APAC regions, fuels the demand for convenient and nutritionally balanced meal alternatives. Market penetration in less developed areas within APAC remains relatively low, indicating substantial future growth potential. Targeted marketing campaigns focused on health benefits and convenience will be crucial for companies seeking to capitalize on this evolving market landscape. Strategic partnerships with local distributors and manufacturers are key to effective market penetration across diverse regional contexts. The long-term outlook remains positive, with continued expansion driven by innovation, changing lifestyles, and rising health awareness within the region.
APAC Meal Replacement Industry Report: 2019-2033
This comprehensive report provides a detailed analysis of the Asia-Pacific (APAC) meal replacement market, encompassing historical data (2019-2024), current estimates (2025), and future projections (2025-2033). It delves into market dynamics, growth trends, key players, and emerging opportunities, offering invaluable insights for industry professionals, investors, and stakeholders. The report segments the market by product type (Ready-to-Drink Products, Nutritional Bars, Powdered Supplements, Other Product Types) and distribution channel (Supermarkets/Hypermarkets, Convenience Stores, Specialty Stores, Online Retail Stores, Other Distribution Channels), providing granular market sizing and analysis.
APAC Meal Replacement Industry Market Dynamics & Structure
The APAC meal replacement market is characterized by a dynamic interplay of factors influencing its structure and growth trajectory. Market concentration is relatively high, with several multinational corporations holding significant shares. However, the emergence of local and regional players is steadily increasing competition. Technological innovation, particularly in areas like personalized nutrition and functional ingredients, is a key driver, while regulatory frameworks regarding labeling and health claims vary across the region. Competitive substitutes, including traditional food options and other convenient food alternatives, present ongoing challenges. End-user demographics, specifically the growing health-conscious and time-constrained population, are a significant market engine. The market witnesses a moderate level of M&A activity, with larger players strategically acquiring smaller companies to expand their product portfolio and market reach. In 2024, an estimated xx Million units worth of M&A deals were recorded.
- Market Concentration: Moderately concentrated, with top 5 players holding approximately xx% market share in 2024.
- Technological Innovation: Focus on personalized nutrition, functional ingredients, and sustainable packaging.
- Regulatory Landscape: Varies across countries, impacting labeling and health claims.
- Competitive Substitutes: Traditional food, convenient ready-to-eat meals, and other quick-food options.
- End-User Demographics: Increasing prevalence of health-conscious, time-constrained consumers.
- M&A Activity: Moderate activity, driven by strategic acquisitions and expansion strategies.
APAC Meal Replacement Industry Growth Trends & Insights
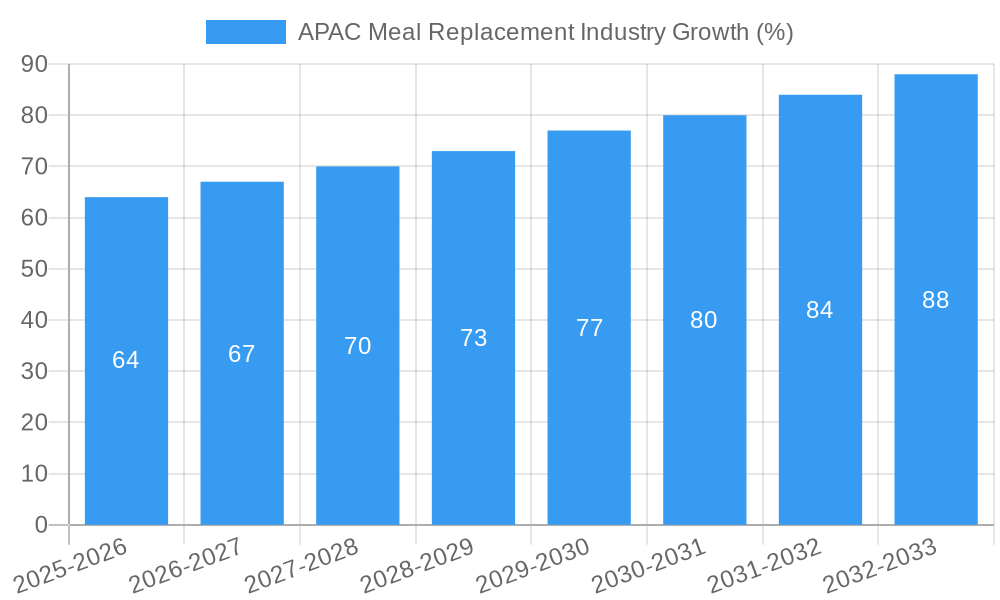
The APAC meal replacement market has demonstrated robust growth throughout the historical period (2019-2024), driven by increasing health awareness, changing lifestyles, and rising disposable incomes. The market size expanded from xx Million units in 2019 to xx Million units in 2024, registering a Compound Annual Growth Rate (CAGR) of xx%. Market penetration, while still relatively low compared to mature markets, has shown a significant upward trend. Technological disruptions, such as the introduction of personalized meal replacement plans and innovative product formulations, have further accelerated growth. Consumer behavior shifts towards convenience, health, and wellness have underpinned this growth. The estimated market size for 2025 is xx Million units, and we project a CAGR of xx% during the forecast period (2025-2033), reaching xx Million units by 2033. This growth will be influenced by continued consumer adoption, technological advancements, and increasing product diversification.
Dominant Regions, Countries, or Segments in APAC Meal Replacement Industry
China and India lead the APAC meal replacement market, driven by large populations, rising disposable incomes, and increasing health awareness. Within product types, powdered supplements hold the largest market share, followed by ready-to-drink products and nutritional bars. Supermarkets/hypermarkets are the dominant distribution channel, followed by online retail stores. The growth of online channels is expected to accelerate in the coming years.
- Key Drivers: Rising disposable incomes, increasing health awareness, and changing lifestyles.
- Dominant Regions: China and India, owing to large populations and expanding middle class.
- Dominant Segments: Powdered supplements (market share: xx% in 2024), followed by Ready-to-Drink and Nutritional Bars.
- Dominant Channels: Supermarkets/hypermarkets (xx% in 2024), with significant online growth projected.
APAC Meal Replacement Industry Product Landscape
The APAC meal replacement market showcases a diverse product landscape, encompassing ready-to-drink shakes, nutritional bars, powdered supplements, and other innovative formats. Products are increasingly incorporating functional ingredients tailored to specific dietary needs and health goals (e.g., high protein, low carb, vegan options). Technological advancements in flavor profiles, texture enhancement, and shelf-life extension have enhanced consumer appeal. Unique selling propositions frequently focus on convenience, nutritional value, and personalized meal plans. The market is witnessing increasing customization and personalization of meal replacement products to cater to diverse consumer preferences.
Key Drivers, Barriers & Challenges in APAP Meal Replacement Industry
Key Drivers:
- Growing health consciousness and wellness trends.
- Increasing prevalence of busy lifestyles and time constraints.
- Rising disposable incomes and increased spending on health and wellness products.
- Technological advancements leading to product innovation and improved formulations.
Challenges & Restraints:
- Regulatory hurdles and varying food safety standards across countries.
- Supply chain complexities and potential disruptions.
- Intense competition among established players and emerging brands.
- Consumer concerns about artificial ingredients and potential health risks.
Emerging Opportunities in APAC Meal Replacement Industry
Untapped market potential exists in smaller, developing economies across APAC. Opportunities include expansion into underserved segments like athletes, elderly populations, and individuals with specific dietary needs. Innovative applications, such as personalized nutrition plans integrated with wearable technology, present exciting growth avenues. Evolving consumer preferences toward organic, plant-based, and sustainable meal replacements also create significant opportunities.
Growth Accelerators in the APAC Meal Replacement Industry
Technological advancements like personalized nutrition platforms and improved product formulations will fuel long-term market growth. Strategic partnerships between meal replacement companies and healthcare providers or fitness centers will expand market access. Aggressive marketing campaigns targeting health-conscious consumers and expanding into new geographic territories will significantly accelerate market growth.
Key Players Shaping the APAC Meal Replacement Industry Market
- Sustyfoods Group *List Not Exhaustive
- Nestlé SA
- Herbalife Nutrition
- MusclePharm
- Amway Corp
- Abbott Laboratories
- Glanbia PLC
- Danone SA
- Formulite Pty Ltd
- Bulk Nutrients
- Sun Pharmaceutical Industries Limited
- WonderLab
Notable Milestones in APAC Meal Replacement Industry Sector
- May 2022: Holland & Barrett partnered with Huelto to launch a range of vegan meal replacement shakes under the brand Nu26.
- May 2022: WonderLab launched a new collagen healthy meal replacement milkshake in China.
- January 2023: Herbalife Nutrition India collaborated with cricketer Smriti Mandhana, signifying increased brand visibility and market penetration.
In-Depth APAC Meal Replacement Industry Market Outlook
The APAC meal replacement market presents substantial long-term growth potential, driven by the factors mentioned earlier. Strategic opportunities include expansion into untapped markets, product innovation focusing on personalization and sustainability, and building strategic alliances to enhance market reach and visibility. The forecast period (2025-2033) promises significant expansion, with continued market penetration in key countries and the emergence of new product categories. Companies that effectively leverage technological advancements, adapt to evolving consumer preferences, and navigate the regulatory landscape will be best positioned to capture this growth.
APAC Meal Replacement Industry Segmentation
-
1. Product Type
- 1.1. Ready-to-Drink Products
- 1.2. Nutritional Bars
- 1.3. Powdered Supplements
- 1.4. Other Product Types
-
2. Distribution Channel
- 2.1. Supermarkets/Hypermarkets
- 2.2. Convenience Stores
- 2.3. Specialty Stores
- 2.4. Online Retail Stores
- 2.5. Other Distribution Channels
-
3. Geography
- 3.1. China
- 3.2. Japan
- 3.3. India
- 3.4. Australia
- 3.5. Rest of Asia-Pacific
APAC Meal Replacement Industry Segmentation By Geography
- 1. China
- 2. Japan
- 3. India
- 4. Australia
- 5. Rest of Asia Pacific
APAC Meal Replacement Industry REPORT HIGHLIGHTS
| Aspects | Details |
|---|---|
| Study Period | 2019-2033 |
| Base Year | 2024 |
| Estimated Year | 2025 |
| Forecast Period | 2025-2033 |
| Historical Period | 2019-2024 |
| Growth Rate | CAGR of 6.40% from 2019-2033 |
| Segmentation |
|
Table of Contents
- 1. Introduction
- 1.1. Research Scope
- 1.2. Market Segmentation
- 1.3. Research Methodology
- 1.4. Definitions and Assumptions
- 2. Executive Summary
- 2.1. Introduction
- 3. Market Dynamics
- 3.1. Introduction
- 3.2. Market Drivers
- 3.2.1. Consumers Managing Special Diets Strive on Meal Replacements; Rising Demand for Convenient and Small-Portion Meal
- 3.3. Market Restrains
- 3.3.1. Highly Priced Meal Replacement Products to Hamper Market Growth
- 3.4. Market Trends
- 3.4.1. Consumers Managing Special Diets Strive on Meal Replacements
- 4. Market Factor Analysis
- 4.1. Porters Five Forces
- 4.2. Supply/Value Chain
- 4.3. PESTEL analysis
- 4.4. Market Entropy
- 4.5. Patent/Trademark Analysis
- 5. Global APAC Meal Replacement Industry Analysis, Insights and Forecast, 2019-2031
- 5.1. Market Analysis, Insights and Forecast - by Product Type
- 5.1.1. Ready-to-Drink Products
- 5.1.2. Nutritional Bars
- 5.1.3. Powdered Supplements
- 5.1.4. Other Product Types
- 5.2. Market Analysis, Insights and Forecast - by Distribution Channel
- 5.2.1. Supermarkets/Hypermarkets
- 5.2.2. Convenience Stores
- 5.2.3. Specialty Stores
- 5.2.4. Online Retail Stores
- 5.2.5. Other Distribution Channels
- 5.3. Market Analysis, Insights and Forecast - by Geography
- 5.3.1. China
- 5.3.2. Japan
- 5.3.3. India
- 5.3.4. Australia
- 5.3.5. Rest of Asia-Pacific
- 5.4. Market Analysis, Insights and Forecast - by Region
- 5.4.1. China
- 5.4.2. Japan
- 5.4.3. India
- 5.4.4. Australia
- 5.4.5. Rest of Asia Pacific
- 5.1. Market Analysis, Insights and Forecast - by Product Type
- 6. China APAC Meal Replacement Industry Analysis, Insights and Forecast, 2019-2031
- 6.1. Market Analysis, Insights and Forecast - by Product Type
- 6.1.1. Ready-to-Drink Products
- 6.1.2. Nutritional Bars
- 6.1.3. Powdered Supplements
- 6.1.4. Other Product Types
- 6.2. Market Analysis, Insights and Forecast - by Distribution Channel
- 6.2.1. Supermarkets/Hypermarkets
- 6.2.2. Convenience Stores
- 6.2.3. Specialty Stores
- 6.2.4. Online Retail Stores
- 6.2.5. Other Distribution Channels
- 6.3. Market Analysis, Insights and Forecast - by Geography
- 6.3.1. China
- 6.3.2. Japan
- 6.3.3. India
- 6.3.4. Australia
- 6.3.5. Rest of Asia-Pacific
- 6.1. Market Analysis, Insights and Forecast - by Product Type
- 7. Japan APAC Meal Replacement Industry Analysis, Insights and Forecast, 2019-2031
- 7.1. Market Analysis, Insights and Forecast - by Product Type
- 7.1.1. Ready-to-Drink Products
- 7.1.2. Nutritional Bars
- 7.1.3. Powdered Supplements
- 7.1.4. Other Product Types
- 7.2. Market Analysis, Insights and Forecast - by Distribution Channel
- 7.2.1. Supermarkets/Hypermarkets
- 7.2.2. Convenience Stores
- 7.2.3. Specialty Stores
- 7.2.4. Online Retail Stores
- 7.2.5. Other Distribution Channels
- 7.3. Market Analysis, Insights and Forecast - by Geography
- 7.3.1. China
- 7.3.2. Japan
- 7.3.3. India
- 7.3.4. Australia
- 7.3.5. Rest of Asia-Pacific
- 7.1. Market Analysis, Insights and Forecast - by Product Type
- 8. India APAC Meal Replacement Industry Analysis, Insights and Forecast, 2019-2031
- 8.1. Market Analysis, Insights and Forecast - by Product Type
- 8.1.1. Ready-to-Drink Products
- 8.1.2. Nutritional Bars
- 8.1.3. Powdered Supplements
- 8.1.4. Other Product Types
- 8.2. Market Analysis, Insights and Forecast - by Distribution Channel
- 8.2.1. Supermarkets/Hypermarkets
- 8.2.2. Convenience Stores
- 8.2.3. Specialty Stores
- 8.2.4. Online Retail Stores
- 8.2.5. Other Distribution Channels
- 8.3. Market Analysis, Insights and Forecast - by Geography
- 8.3.1. China
- 8.3.2. Japan
- 8.3.3. India
- 8.3.4. Australia
- 8.3.5. Rest of Asia-Pacific
- 8.1. Market Analysis, Insights and Forecast - by Product Type
- 9. Australia APAC Meal Replacement Industry Analysis, Insights and Forecast, 2019-2031
- 9.1. Market Analysis, Insights and Forecast - by Product Type
- 9.1.1. Ready-to-Drink Products
- 9.1.2. Nutritional Bars
- 9.1.3. Powdered Supplements
- 9.1.4. Other Product Types
- 9.2. Market Analysis, Insights and Forecast - by Distribution Channel
- 9.2.1. Supermarkets/Hypermarkets
- 9.2.2. Convenience Stores
- 9.2.3. Specialty Stores
- 9.2.4. Online Retail Stores
- 9.2.5. Other Distribution Channels
- 9.3. Market Analysis, Insights and Forecast - by Geography
- 9.3.1. China
- 9.3.2. Japan
- 9.3.3. India
- 9.3.4. Australia
- 9.3.5. Rest of Asia-Pacific
- 9.1. Market Analysis, Insights and Forecast - by Product Type
- 10. Rest of Asia Pacific APAC Meal Replacement Industry Analysis, Insights and Forecast, 2019-2031
- 10.1. Market Analysis, Insights and Forecast - by Product Type
- 10.1.1. Ready-to-Drink Products
- 10.1.2. Nutritional Bars
- 10.1.3. Powdered Supplements
- 10.1.4. Other Product Types
- 10.2. Market Analysis, Insights and Forecast - by Distribution Channel
- 10.2.1. Supermarkets/Hypermarkets
- 10.2.2. Convenience Stores
- 10.2.3. Specialty Stores
- 10.2.4. Online Retail Stores
- 10.2.5. Other Distribution Channels
- 10.3. Market Analysis, Insights and Forecast - by Geography
- 10.3.1. China
- 10.3.2. Japan
- 10.3.3. India
- 10.3.4. Australia
- 10.3.5. Rest of Asia-Pacific
- 10.1. Market Analysis, Insights and Forecast - by Product Type
- 11. North America APAC Meal Replacement Industry Analysis, Insights and Forecast, 2019-2031
- 11.1. Market Analysis, Insights and Forecast - By Country/Sub-region
- 11.1.1 United States
- 11.1.2 Canada
- 11.1.3 Mexico
- 12. Europe APAC Meal Replacement Industry Analysis, Insights and Forecast, 2019-2031
- 12.1. Market Analysis, Insights and Forecast - By Country/Sub-region
- 12.1.1 Germany
- 12.1.2 United Kingdom
- 12.1.3 France
- 12.1.4 Spain
- 12.1.5 Italy
- 12.1.6 Spain
- 12.1.7 Belgium
- 12.1.8 Netherland
- 12.1.9 Nordics
- 12.1.10 Rest of Europe
- 13. Asia Pacific APAC Meal Replacement Industry Analysis, Insights and Forecast, 2019-2031
- 13.1. Market Analysis, Insights and Forecast - By Country/Sub-region
- 13.1.1 China
- 13.1.2 Japan
- 13.1.3 India
- 13.1.4 South Korea
- 13.1.5 Southeast Asia
- 13.1.6 Australia
- 13.1.7 Indonesia
- 13.1.8 Phillipes
- 13.1.9 Singapore
- 13.1.10 Thailandc
- 13.1.11 Rest of Asia Pacific
- 14. South America APAC Meal Replacement Industry Analysis, Insights and Forecast, 2019-2031
- 14.1. Market Analysis, Insights and Forecast - By Country/Sub-region
- 14.1.1 Brazil
- 14.1.2 Argentina
- 14.1.3 Rest of South America
- 15. Middle East & Africa APAC Meal Replacement Industry Analysis, Insights and Forecast, 2019-2031
- 15.1. Market Analysis, Insights and Forecast - By Country/Sub-region
- 15.1.1 UAE
- 15.1.2 South Africa
- 15.1.3 Saudi Arabia
- 15.1.4 Rest of MEA
- 16. Competitive Analysis
- 16.1. Global Market Share Analysis 2024
- 16.2. Company Profiles
- 16.2.1 Sustyfoods Group*List Not Exhaustive
- 16.2.1.1. Overview
- 16.2.1.2. Products
- 16.2.1.3. SWOT Analysis
- 16.2.1.4. Recent Developments
- 16.2.1.5. Financials (Based on Availability)
- 16.2.2 Nestlé SA
- 16.2.2.1. Overview
- 16.2.2.2. Products
- 16.2.2.3. SWOT Analysis
- 16.2.2.4. Recent Developments
- 16.2.2.5. Financials (Based on Availability)
- 16.2.3 Herballife Nutrition
- 16.2.3.1. Overview
- 16.2.3.2. Products
- 16.2.3.3. SWOT Analysis
- 16.2.3.4. Recent Developments
- 16.2.3.5. Financials (Based on Availability)
- 16.2.4 MusclePharm
- 16.2.4.1. Overview
- 16.2.4.2. Products
- 16.2.4.3. SWOT Analysis
- 16.2.4.4. Recent Developments
- 16.2.4.5. Financials (Based on Availability)
- 16.2.5 Amway Corp
- 16.2.5.1. Overview
- 16.2.5.2. Products
- 16.2.5.3. SWOT Analysis
- 16.2.5.4. Recent Developments
- 16.2.5.5. Financials (Based on Availability)
- 16.2.6 Abbott Laboratories
- 16.2.6.1. Overview
- 16.2.6.2. Products
- 16.2.6.3. SWOT Analysis
- 16.2.6.4. Recent Developments
- 16.2.6.5. Financials (Based on Availability)
- 16.2.7 Glanbia PLC
- 16.2.7.1. Overview
- 16.2.7.2. Products
- 16.2.7.3. SWOT Analysis
- 16.2.7.4. Recent Developments
- 16.2.7.5. Financials (Based on Availability)
- 16.2.8 Danone SA
- 16.2.8.1. Overview
- 16.2.8.2. Products
- 16.2.8.3. SWOT Analysis
- 16.2.8.4. Recent Developments
- 16.2.8.5. Financials (Based on Availability)
- 16.2.9 Formulite Pty Ltd
- 16.2.9.1. Overview
- 16.2.9.2. Products
- 16.2.9.3. SWOT Analysis
- 16.2.9.4. Recent Developments
- 16.2.9.5. Financials (Based on Availability)
- 16.2.10 Bulk Nutrients
- 16.2.10.1. Overview
- 16.2.10.2. Products
- 16.2.10.3. SWOT Analysis
- 16.2.10.4. Recent Developments
- 16.2.10.5. Financials (Based on Availability)
- 16.2.11 Sun Pharmaceutical Industries Limited
- 16.2.11.1. Overview
- 16.2.11.2. Products
- 16.2.11.3. SWOT Analysis
- 16.2.11.4. Recent Developments
- 16.2.11.5. Financials (Based on Availability)
- 16.2.12 WonderLab
- 16.2.12.1. Overview
- 16.2.12.2. Products
- 16.2.12.3. SWOT Analysis
- 16.2.12.4. Recent Developments
- 16.2.12.5. Financials (Based on Availability)
- 16.2.1 Sustyfoods Group*List Not Exhaustive
List of Figures
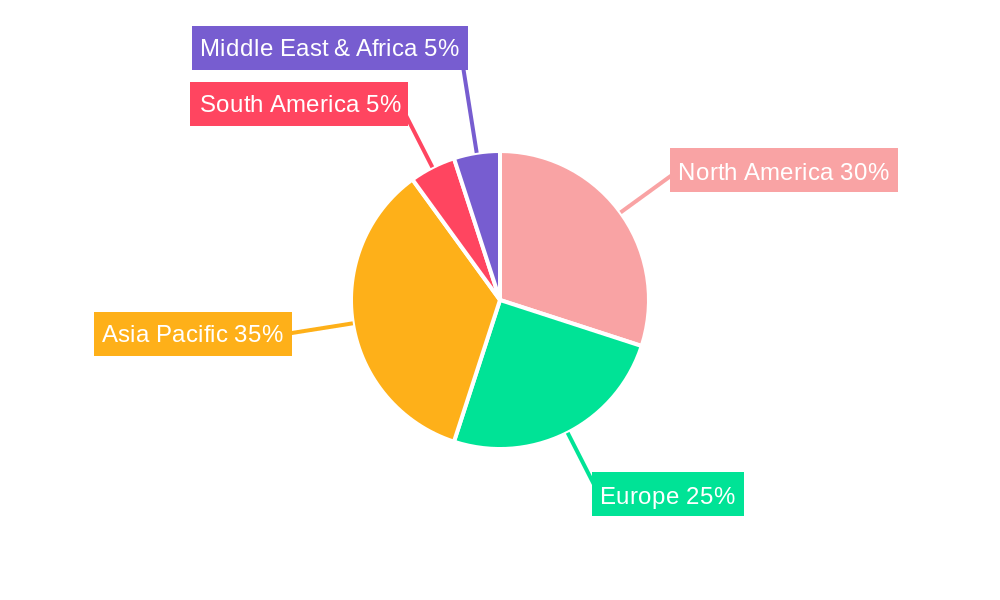
- Figure 1: Global APAC Meal Replacement Industry Revenue Breakdown (Million, %) by Region 2024 & 2032
- Figure 2: North America APAC Meal Replacement Industry Revenue (Million), by Country 2024 & 2032
- Figure 3: North America APAC Meal Replacement Industry Revenue Share (%), by Country 2024 & 2032
- Figure 4: Europe APAC Meal Replacement Industry Revenue (Million), by Country 2024 & 2032
- Figure 5: Europe APAC Meal Replacement Industry Revenue Share (%), by Country 2024 & 2032
- Figure 6: Asia Pacific APAC Meal Replacement Industry Revenue (Million), by Country 2024 & 2032
- Figure 7: Asia Pacific APAC Meal Replacement Industry Revenue Share (%), by Country 2024 & 2032
- Figure 8: South America APAC Meal Replacement Industry Revenue (Million), by Country 2024 & 2032
- Figure 9: South America APAC Meal Replacement Industry Revenue Share (%), by Country 2024 & 2032
- Figure 10: Middle East & Africa APAC Meal Replacement Industry Revenue (Million), by Country 2024 & 2032
- Figure 11: Middle East & Africa APAC Meal Replacement Industry Revenue Share (%), by Country 2024 & 2032
- Figure 12: China APAC Meal Replacement Industry Revenue (Million), by Product Type 2024 & 2032
- Figure 13: China APAC Meal Replacement Industry Revenue Share (%), by Product Type 2024 & 2032
- Figure 14: China APAC Meal Replacement Industry Revenue (Million), by Distribution Channel 2024 & 2032
- Figure 15: China APAC Meal Replacement Industry Revenue Share (%), by Distribution Channel 2024 & 2032
- Figure 16: China APAC Meal Replacement Industry Revenue (Million), by Geography 2024 & 2032
- Figure 17: China APAC Meal Replacement Industry Revenue Share (%), by Geography 2024 & 2032
- Figure 18: China APAC Meal Replacement Industry Revenue (Million), by Country 2024 & 2032
- Figure 19: China APAC Meal Replacement Industry Revenue Share (%), by Country 2024 & 2032
- Figure 20: Japan APAC Meal Replacement Industry Revenue (Million), by Product Type 2024 & 2032
- Figure 21: Japan APAC Meal Replacement Industry Revenue Share (%), by Product Type 2024 & 2032
- Figure 22: Japan APAC Meal Replacement Industry Revenue (Million), by Distribution Channel 2024 & 2032
- Figure 23: Japan APAC Meal Replacement Industry Revenue Share (%), by Distribution Channel 2024 & 2032
- Figure 24: Japan APAC Meal Replacement Industry Revenue (Million), by Geography 2024 & 2032
- Figure 25: Japan APAC Meal Replacement Industry Revenue Share (%), by Geography 2024 & 2032
- Figure 26: Japan APAC Meal Replacement Industry Revenue (Million), by Country 2024 & 2032
- Figure 27: Japan APAC Meal Replacement Industry Revenue Share (%), by Country 2024 & 2032
- Figure 28: India APAC Meal Replacement Industry Revenue (Million), by Product Type 2024 & 2032
- Figure 29: India APAC Meal Replacement Industry Revenue Share (%), by Product Type 2024 & 2032
- Figure 30: India APAC Meal Replacement Industry Revenue (Million), by Distribution Channel 2024 & 2032
- Figure 31: India APAC Meal Replacement Industry Revenue Share (%), by Distribution Channel 2024 & 2032
- Figure 32: India APAC Meal Replacement Industry Revenue (Million), by Geography 2024 & 2032
- Figure 33: India APAC Meal Replacement Industry Revenue Share (%), by Geography 2024 & 2032
- Figure 34: India APAC Meal Replacement Industry Revenue (Million), by Country 2024 & 2032
- Figure 35: India APAC Meal Replacement Industry Revenue Share (%), by Country 2024 & 2032
- Figure 36: Australia APAC Meal Replacement Industry Revenue (Million), by Product Type 2024 & 2032
- Figure 37: Australia APAC Meal Replacement Industry Revenue Share (%), by Product Type 2024 & 2032
- Figure 38: Australia APAC Meal Replacement Industry Revenue (Million), by Distribution Channel 2024 & 2032
- Figure 39: Australia APAC Meal Replacement Industry Revenue Share (%), by Distribution Channel 2024 & 2032
- Figure 40: Australia APAC Meal Replacement Industry Revenue (Million), by Geography 2024 & 2032
- Figure 41: Australia APAC Meal Replacement Industry Revenue Share (%), by Geography 2024 & 2032
- Figure 42: Australia APAC Meal Replacement Industry Revenue (Million), by Country 2024 & 2032
- Figure 43: Australia APAC Meal Replacement Industry Revenue Share (%), by Country 2024 & 2032
- Figure 44: Rest of Asia Pacific APAC Meal Replacement Industry Revenue (Million), by Product Type 2024 & 2032
- Figure 45: Rest of Asia Pacific APAC Meal Replacement Industry Revenue Share (%), by Product Type 2024 & 2032
- Figure 46: Rest of Asia Pacific APAC Meal Replacement Industry Revenue (Million), by Distribution Channel 2024 & 2032
- Figure 47: Rest of Asia Pacific APAC Meal Replacement Industry Revenue Share (%), by Distribution Channel 2024 & 2032
- Figure 48: Rest of Asia Pacific APAC Meal Replacement Industry Revenue (Million), by Geography 2024 & 2032
- Figure 49: Rest of Asia Pacific APAC Meal Replacement Industry Revenue Share (%), by Geography 2024 & 2032
- Figure 50: Rest of Asia Pacific APAC Meal Replacement Industry Revenue (Million), by Country 2024 & 2032
- Figure 51: Rest of Asia Pacific APAC Meal Replacement Industry Revenue Share (%), by Country 2024 & 2032
List of Tables
- Table 1: Global APAC Meal Replacement Industry Revenue Million Forecast, by Region 2019 & 2032
- Table 2: Global APAC Meal Replacement Industry Revenue Million Forecast, by Product Type 2019 & 2032
- Table 3: Global APAC Meal Replacement Industry Revenue Million Forecast, by Distribution Channel 2019 & 2032
- Table 4: Global APAC Meal Replacement Industry Revenue Million Forecast, by Geography 2019 & 2032
- Table 5: Global APAC Meal Replacement Industry Revenue Million Forecast, by Region 2019 & 2032
- Table 6: Global APAC Meal Replacement Industry Revenue Million Forecast, by Country 2019 & 2032
- Table 7: United States APAC Meal Replacement Industry Revenue (Million) Forecast, by Application 2019 & 2032
- Table 8: Canada APAC Meal Replacement Industry Revenue (Million) Forecast, by Application 2019 & 2032
- Table 9: Mexico APAC Meal Replacement Industry Revenue (Million) Forecast, by Application 2019 & 2032
- Table 10: Global APAC Meal Replacement Industry Revenue Million Forecast, by Country 2019 & 2032
- Table 11: Germany APAC Meal Replacement Industry Revenue (Million) Forecast, by Application 2019 & 2032
- Table 12: United Kingdom APAC Meal Replacement Industry Revenue (Million) Forecast, by Application 2019 & 2032
- Table 13: France APAC Meal Replacement Industry Revenue (Million) Forecast, by Application 2019 & 2032
- Table 14: Spain APAC Meal Replacement Industry Revenue (Million) Forecast, by Application 2019 & 2032
- Table 15: Italy APAC Meal Replacement Industry Revenue (Million) Forecast, by Application 2019 & 2032
- Table 16: Spain APAC Meal Replacement Industry Revenue (Million) Forecast, by Application 2019 & 2032
- Table 17: Belgium APAC Meal Replacement Industry Revenue (Million) Forecast, by Application 2019 & 2032
- Table 18: Netherland APAC Meal Replacement Industry Revenue (Million) Forecast, by Application 2019 & 2032
- Table 19: Nordics APAC Meal Replacement Industry Revenue (Million) Forecast, by Application 2019 & 2032
- Table 20: Rest of Europe APAC Meal Replacement Industry Revenue (Million) Forecast, by Application 2019 & 2032
- Table 21: Global APAC Meal Replacement Industry Revenue Million Forecast, by Country 2019 & 2032
- Table 22: China APAC Meal Replacement Industry Revenue (Million) Forecast, by Application 2019 & 2032
- Table 23: Japan APAC Meal Replacement Industry Revenue (Million) Forecast, by Application 2019 & 2032
- Table 24: India APAC Meal Replacement Industry Revenue (Million) Forecast, by Application 2019 & 2032
- Table 25: South Korea APAC Meal Replacement Industry Revenue (Million) Forecast, by Application 2019 & 2032
- Table 26: Southeast Asia APAC Meal Replacement Industry Revenue (Million) Forecast, by Application 2019 & 2032
- Table 27: Australia APAC Meal Replacement Industry Revenue (Million) Forecast, by Application 2019 & 2032
- Table 28: Indonesia APAC Meal Replacement Industry Revenue (Million) Forecast, by Application 2019 & 2032
- Table 29: Phillipes APAC Meal Replacement Industry Revenue (Million) Forecast, by Application 2019 & 2032
- Table 30: Singapore APAC Meal Replacement Industry Revenue (Million) Forecast, by Application 2019 & 2032
- Table 31: Thailandc APAC Meal Replacement Industry Revenue (Million) Forecast, by Application 2019 & 2032
- Table 32: Rest of Asia Pacific APAC Meal Replacement Industry Revenue (Million) Forecast, by Application 2019 & 2032
- Table 33: Global APAC Meal Replacement Industry Revenue Million Forecast, by Country 2019 & 2032
- Table 34: Brazil APAC Meal Replacement Industry Revenue (Million) Forecast, by Application 2019 & 2032
- Table 35: Argentina APAC Meal Replacement Industry Revenue (Million) Forecast, by Application 2019 & 2032
- Table 36: Rest of South America APAC Meal Replacement Industry Revenue (Million) Forecast, by Application 2019 & 2032
- Table 37: Global APAC Meal Replacement Industry Revenue Million Forecast, by Country 2019 & 2032
- Table 38: UAE APAC Meal Replacement Industry Revenue (Million) Forecast, by Application 2019 & 2032
- Table 39: South Africa APAC Meal Replacement Industry Revenue (Million) Forecast, by Application 2019 & 2032
- Table 40: Saudi Arabia APAC Meal Replacement Industry Revenue (Million) Forecast, by Application 2019 & 2032
- Table 41: Rest of MEA APAC Meal Replacement Industry Revenue (Million) Forecast, by Application 2019 & 2032
- Table 42: Global APAC Meal Replacement Industry Revenue Million Forecast, by Product Type 2019 & 2032
- Table 43: Global APAC Meal Replacement Industry Revenue Million Forecast, by Distribution Channel 2019 & 2032
- Table 44: Global APAC Meal Replacement Industry Revenue Million Forecast, by Geography 2019 & 2032
- Table 45: Global APAC Meal Replacement Industry Revenue Million Forecast, by Country 2019 & 2032
- Table 46: Global APAC Meal Replacement Industry Revenue Million Forecast, by Product Type 2019 & 2032
- Table 47: Global APAC Meal Replacement Industry Revenue Million Forecast, by Distribution Channel 2019 & 2032
- Table 48: Global APAC Meal Replacement Industry Revenue Million Forecast, by Geography 2019 & 2032
- Table 49: Global APAC Meal Replacement Industry Revenue Million Forecast, by Country 2019 & 2032
- Table 50: Global APAC Meal Replacement Industry Revenue Million Forecast, by Product Type 2019 & 2032
- Table 51: Global APAC Meal Replacement Industry Revenue Million Forecast, by Distribution Channel 2019 & 2032
- Table 52: Global APAC Meal Replacement Industry Revenue Million Forecast, by Geography 2019 & 2032
- Table 53: Global APAC Meal Replacement Industry Revenue Million Forecast, by Country 2019 & 2032
- Table 54: Global APAC Meal Replacement Industry Revenue Million Forecast, by Product Type 2019 & 2032
- Table 55: Global APAC Meal Replacement Industry Revenue Million Forecast, by Distribution Channel 2019 & 2032
- Table 56: Global APAC Meal Replacement Industry Revenue Million Forecast, by Geography 2019 & 2032
- Table 57: Global APAC Meal Replacement Industry Revenue Million Forecast, by Country 2019 & 2032
- Table 58: Global APAC Meal Replacement Industry Revenue Million Forecast, by Product Type 2019 & 2032
- Table 59: Global APAC Meal Replacement Industry Revenue Million Forecast, by Distribution Channel 2019 & 2032
- Table 60: Global APAC Meal Replacement Industry Revenue Million Forecast, by Geography 2019 & 2032
- Table 61: Global APAC Meal Replacement Industry Revenue Million Forecast, by Country 2019 & 2032
Frequently Asked Questions
1. What is the projected Compound Annual Growth Rate (CAGR) of the APAC Meal Replacement Industry?
The projected CAGR is approximately 6.40%.
2. Which companies are prominent players in the APAC Meal Replacement Industry?
Key companies in the market include Sustyfoods Group*List Not Exhaustive, Nestlé SA, Herballife Nutrition, MusclePharm, Amway Corp, Abbott Laboratories, Glanbia PLC, Danone SA, Formulite Pty Ltd, Bulk Nutrients, Sun Pharmaceutical Industries Limited, WonderLab.
3. What are the main segments of the APAC Meal Replacement Industry?
The market segments include Product Type, Distribution Channel, Geography.
4. Can you provide details about the market size?
The market size is estimated to be USD 3,731.26 Million as of 2022.
5. What are some drivers contributing to market growth?
Consumers Managing Special Diets Strive on Meal Replacements; Rising Demand for Convenient and Small-Portion Meal.
6. What are the notable trends driving market growth?
Consumers Managing Special Diets Strive on Meal Replacements.
7. Are there any restraints impacting market growth?
Highly Priced Meal Replacement Products to Hamper Market Growth.
8. Can you provide examples of recent developments in the market?
January 2023: As a "nutrition sponsor," Herbalife Nutrition India Private Limited collaborated with international women's cricketer Smriti Mandhana. Around 100 sponsorship agreements have been made by Herbalife Nutrition with different elite athletes, teams, and events.
9. What pricing options are available for accessing the report?
Pricing options include single-user, multi-user, and enterprise licenses priced at USD 4750, USD 5250, and USD 8750 respectively.
10. Is the market size provided in terms of value or volume?
The market size is provided in terms of value, measured in Million.
11. Are there any specific market keywords associated with the report?
Yes, the market keyword associated with the report is "APAC Meal Replacement Industry," which aids in identifying and referencing the specific market segment covered.
12. How do I determine which pricing option suits my needs best?
The pricing options vary based on user requirements and access needs. Individual users may opt for single-user licenses, while businesses requiring broader access may choose multi-user or enterprise licenses for cost-effective access to the report.
13. Are there any additional resources or data provided in the APAC Meal Replacement Industry report?
While the report offers comprehensive insights, it's advisable to review the specific contents or supplementary materials provided to ascertain if additional resources or data are available.
14. How can I stay updated on further developments or reports in the APAC Meal Replacement Industry?
To stay informed about further developments, trends, and reports in the APAC Meal Replacement Industry, consider subscribing to industry newsletters, following relevant companies and organizations, or regularly checking reputable industry news sources and publications.
Methodology
Step 1 - Identification of Relevant Samples Size from Population Database


Step 2 - Approaches for Defining Global Market Size (Value, Volume* & Price*)

Note*: In applicable scenarios
Step 3 - Data Sources
Primary Research
- Web Analytics
- Survey Reports
- Research Institute
- Latest Research Reports
- Opinion Leaders
Secondary Research
- Annual Reports
- White Paper
- Latest Press Release
- Industry Association
- Paid Database
- Investor Presentations

Step 4 - Data Triangulation
Involves using different sources of information in order to increase the validity of a study
These sources are likely to be stakeholders in a program - participants, other researchers, program staff, other community members, and so on.
Then we put all data in single framework & apply various statistical tools to find out the dynamic on the market.
During the analysis stage, feedback from the stakeholder groups would be compared to determine areas of agreement as well as areas of divergence


