
Key Insights
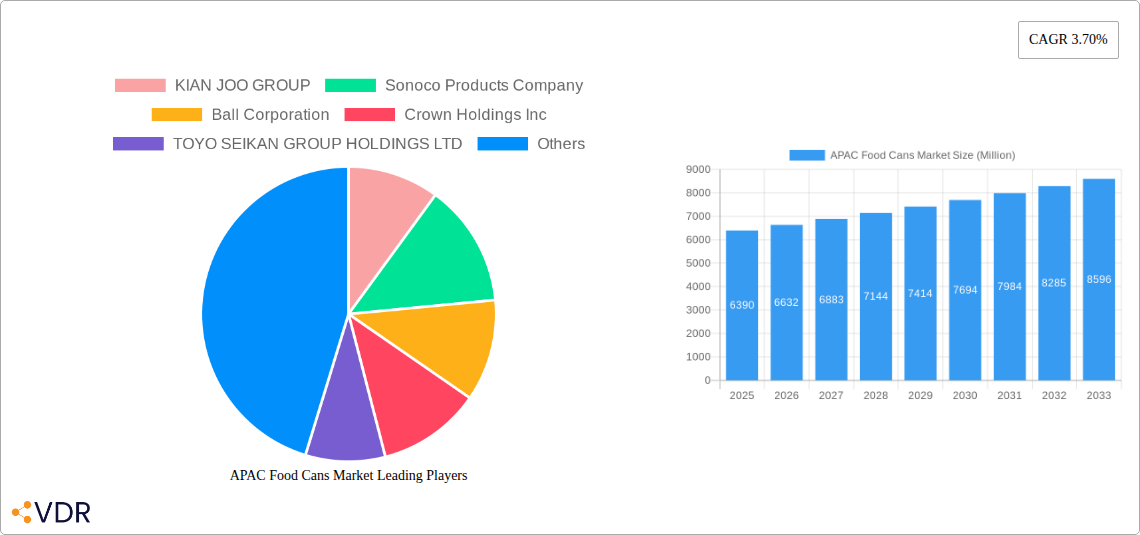
The Asia-Pacific (APAC) food cans market, valued at $6.39 billion in 2025, is projected to experience robust growth, driven by several key factors. The rising demand for convenient and shelf-stable food products, particularly in rapidly urbanizing regions like China and India, is a primary driver. Increasing disposable incomes and changing lifestyles are fueling the consumption of processed and ready-to-eat meals, boosting the demand for food cans. Furthermore, the growing popularity of pet food, coupled with advancements in can manufacturing technologies leading to lighter, more sustainable packaging, contributes significantly to market expansion. Steel cans maintain a significant market share due to their cost-effectiveness, while aluminum cans are gaining traction owing to their recyclability and superior barrier properties, particularly for products requiring extended shelf life. However, challenges such as fluctuating raw material prices and stringent environmental regulations pose potential restraints on market growth. Despite these challenges, the overall outlook remains positive, with a projected Compound Annual Growth Rate (CAGR) of 3.70% from 2025 to 2033. The market segmentation reveals a strong presence of key players like Kian Joo Group, Sonoco Products Company, and Ball Corporation, actively competing to cater to the diverse needs of food and beverage manufacturers across the region. The significant market share held by China and India reflects the burgeoning food processing and packaging sectors within these countries. The forecast period anticipates continued growth, spurred by the expanding middle class, increased food processing capacity, and the introduction of innovative packaging solutions.
Within the APAC region, specific trends indicate significant growth opportunities. The increasing adoption of e-commerce platforms and online grocery delivery services is further driving demand for convenient, shelf-stable canned food. Manufacturers are focusing on enhancing product quality and diversifying applications, with a growing focus on sustainable and eco-friendly packaging solutions. Government initiatives promoting food safety and hygiene standards also contribute to the overall positive outlook. Market competition is intense, with established players and emerging companies vying for market share through product innovation, strategic partnerships, and aggressive marketing campaigns. Regional disparities in growth rates are expected, with faster growth in developing economies as compared to developed economies within the APAC region. Careful consideration of regional regulations and consumer preferences is crucial for companies seeking to succeed in this dynamic market.
APAC Food Cans Market: A Comprehensive Report (2019-2033)
This comprehensive report provides a detailed analysis of the Asia-Pacific (APAC) food cans market, encompassing market dynamics, growth trends, regional dominance, product landscape, key players, and future outlook. With a focus on key segments – including aluminum and steel cans, various food applications (ready meals, pet food, etc.), and major countries (China, India, Japan, South Korea, Australia, and New Zealand) – this report offers invaluable insights for industry professionals, investors, and strategic decision-makers. The study period covers 2019-2033, with a base year of 2025. Market values are presented in Million units.
APAC Food Cans Market Dynamics & Structure
The APAC food cans market is characterized by a moderately concentrated landscape, with key players such as KIAN JOO GROUP, Sonoco Products Company, Ball Corporation, Crown Holdings Inc, TOYO SEIKAN GROUP HOLDINGS LTD, Trivium Packaging, CPMC Holdings Limited, Visy Industries, and Mauser Packaging Solution holding significant market shares (xx%). Technological innovation, driven by advancements in material science and manufacturing processes, plays a crucial role in shaping market dynamics. Stringent regulatory frameworks concerning food safety and sustainability influence packaging choices, creating both opportunities and challenges for manufacturers. The market also faces competition from alternative packaging solutions, such as flexible pouches and retort packaging. Consumer demographics, particularly the rising middle class in several APAC countries, fuel demand for convenient and readily available packaged food. Furthermore, mergers and acquisitions (M&A) activity, with an estimated xx number of deals in the past five years, are reshaping the competitive landscape.
- Market Concentration: Moderately concentrated, with top players holding xx% market share.
- Technological Innovation: Advancements in lightweighting, recyclability, and printing technologies are key drivers.
- Regulatory Framework: Stringent food safety regulations and increasing focus on sustainability are major influences.
- Competitive Substitutes: Flexible pouches, retort packaging, and other alternatives present competition.
- End-User Demographics: Growing middle class and changing consumer preferences drive market growth.
- M&A Trends: xx M&A deals in the past 5 years indicate significant consolidation.
APAC Food Cans Market Growth Trends & Insights
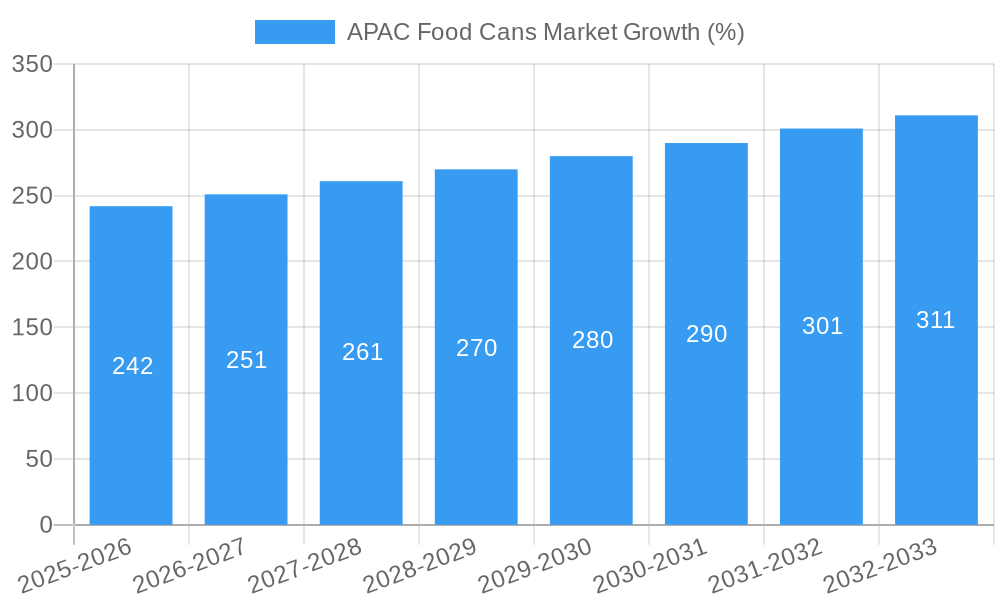
The APAC food cans market is experiencing robust growth, driven by several factors. The market size expanded from xx million units in 2019 to xx million units in 2024, with a Compound Annual Growth Rate (CAGR) of xx%. This growth is fueled by factors including increasing demand for convenient and shelf-stable food products, rising disposable incomes, urbanization, and evolving consumer lifestyles. Technological disruptions, such as the introduction of innovative can designs and improved manufacturing processes, further enhance market growth. Changing consumer preferences toward healthier and more sustainable food options are also shaping the market, influencing the choice of materials and packaging designs. Market penetration is expected to increase from xx% in 2024 to xx% by 2033.
Dominant Regions, Countries, or Segments in APAC Food Cans Market
China remains the dominant market, accounting for approximately xx% of the total APAC food cans market in 2024, followed by India (xx%) and Japan (xx%). Within segments, aluminum cans hold the largest market share (xx%), due to their lightweight nature, recyclability, and superior barrier properties. The ready meals and processed food segments dominate application-based market share, contributing xx% and xx%, respectively, owing to their convenience and extended shelf life.
- Key Drivers for China: Large population, rising disposable incomes, and robust food processing industry.
- Key Drivers for India: Rapid economic growth, increasing urbanization, and expanding food retail sector.
- Aluminum Cans Dominance: Superior properties, recyclability, and lightweighting contribute to its market leadership.
- Ready Meals and Processed Foods: Convenience and long shelf life drive demand in these application segments.
APAC Food Cans Market Product Landscape
The APAC food cans market showcases ongoing innovation, with manufacturers focusing on developing lightweight, recyclable, and aesthetically appealing cans. Improvements in printing technologies allow for customized designs and enhanced branding opportunities. Recent advancements in coating technologies enhance product shelf life and prevent degradation. Unique selling propositions include enhanced barrier properties to maintain food quality, sustainable materials and manufacturing processes, and innovative can designs for improved functionality and appeal.
Key Drivers, Barriers & Challenges in APAP Food Cans Market
Key Drivers: Rising demand for convenient and shelf-stable food, increasing disposable incomes, urbanization, and technological advancements in can manufacturing.
Challenges: Fluctuations in raw material prices (aluminum and steel), stringent environmental regulations, competition from alternative packaging materials, and supply chain disruptions, which have impacted production volumes by approximately xx% in 2023.
Emerging Opportunities in APAC Food Cans Market
Untapped markets in smaller Southeast Asian countries present significant growth potential. Increasing consumer demand for sustainable and eco-friendly packaging drives opportunities for recycled aluminum and innovative can designs. The growth of e-commerce and online grocery shopping creates opportunities for optimized can sizes and designs suitable for online delivery.
Growth Accelerators in the APAC Food Cans Market Industry
Strategic partnerships between can manufacturers and food brands facilitate product innovation and expansion into new markets. Technological breakthroughs in can manufacturing, such as improved coating technologies and lightweighting processes, drive efficiency and cost-effectiveness. Expansion into new product segments (e.g., pet food, ready-to-drink beverages) fuels market growth.
Key Players Shaping the APAC Food Cans Market Market
- KIAN JOO GROUP
- Sonoco Products Company (Sonoco Products Company)
- Ball Corporation (Ball Corporation)
- Crown Holdings Inc (Crown Holdings Inc)
- TOYO SEIKAN GROUP HOLDINGS LTD
- Trivium Packaging (Trivium Packaging)
- CPMC Holdings Limited
- Visy Industries
- Mauser Packaging Solution
Notable Milestones in APAC Food Cans Market Sector
- June 2023: Ball Corporation showcased its latest aluminum can and bottle portfolio at BevNET Live Summer 2023.
- September 2022: Crown Holdings Inc. hosted the first Global Aluminium Can Sustainability Summit.
In-Depth APAC Food Cans Market Market Outlook
The APAC food cans market is poised for continued growth, driven by favorable demographic trends, economic expansion, and ongoing innovation. Strategic investments in sustainable packaging solutions and technological advancements will further accelerate market expansion. Opportunities exist for companies to capitalize on the increasing demand for convenient, healthy, and environmentally responsible food packaging.
APAC Food Cans Market Segmentation
-
1. Material Type
- 1.1. Aluminium Cans
- 1.2. Steel Cans
-
2. Application
- 2.1. Ready Meals
- 2.2. Powder Products
- 2.3. Fish and Seafood
- 2.4. Fruits and Vegetables
- 2.5. Processed Food
- 2.6. Pet Food
- 2.7. Other Applications
APAC Food Cans Market Segmentation By Geography
-
1. North America
- 1.1. United States
- 1.2. Canada
- 1.3. Mexico
-
2. South America
- 2.1. Brazil
- 2.2. Argentina
- 2.3. Rest of South America
-
3. Europe
- 3.1. United Kingdom
- 3.2. Germany
- 3.3. France
- 3.4. Italy
- 3.5. Spain
- 3.6. Russia
- 3.7. Benelux
- 3.8. Nordics
- 3.9. Rest of Europe
-
4. Middle East & Africa
- 4.1. Turkey
- 4.2. Israel
- 4.3. GCC
- 4.4. North Africa
- 4.5. South Africa
- 4.6. Rest of Middle East & Africa
-
5. Asia Pacific
- 5.1. China
- 5.2. India
- 5.3. Japan
- 5.4. South Korea
- 5.5. ASEAN
- 5.6. Oceania
- 5.7. Rest of Asia Pacific

APAC Food Cans Market REPORT HIGHLIGHTS
| Aspects | Details |
|---|---|
| Study Period | 2019-2033 |
| Base Year | 2024 |
| Estimated Year | 2025 |
| Forecast Period | 2025-2033 |
| Historical Period | 2019-2024 |
| Growth Rate | CAGR of 3.70% from 2019-2033 |
| Segmentation |
|
Table of Contents
- 1. Introduction
- 1.1. Research Scope
- 1.2. Market Segmentation
- 1.3. Research Methodology
- 1.4. Definitions and Assumptions
- 2. Executive Summary
- 2.1. Introduction
- 3. Market Dynamics
- 3.1. Introduction
- 3.2. Market Drivers
- 3.2.1. New Packaging Styles and High Potential in Emerging Economies; Increased Demand for Ready-to-Eat Foods
- 3.3. Market Restrains
- 3.3.1. High Use of Plastic Material Due to Lower Costs
- 3.4. Market Trends
- 3.4.1. Aluminum Cans to Witness Growth in the Market
- 4. Market Factor Analysis
- 4.1. Porters Five Forces
- 4.2. Supply/Value Chain
- 4.3. PESTEL analysis
- 4.4. Market Entropy
- 4.5. Patent/Trademark Analysis
- 5. Global APAC Food Cans Market Analysis, Insights and Forecast, 2019-2031
- 5.1. Market Analysis, Insights and Forecast - by Material Type
- 5.1.1. Aluminium Cans
- 5.1.2. Steel Cans
- 5.2. Market Analysis, Insights and Forecast - by Application
- 5.2.1. Ready Meals
- 5.2.2. Powder Products
- 5.2.3. Fish and Seafood
- 5.2.4. Fruits and Vegetables
- 5.2.5. Processed Food
- 5.2.6. Pet Food
- 5.2.7. Other Applications
- 5.3. Market Analysis, Insights and Forecast - by Region
- 5.3.1. North America
- 5.3.2. South America
- 5.3.3. Europe
- 5.3.4. Middle East & Africa
- 5.3.5. Asia Pacific
- 5.1. Market Analysis, Insights and Forecast - by Material Type
- 6. North America APAC Food Cans Market Analysis, Insights and Forecast, 2019-2031
- 6.1. Market Analysis, Insights and Forecast - by Material Type
- 6.1.1. Aluminium Cans
- 6.1.2. Steel Cans
- 6.2. Market Analysis, Insights and Forecast - by Application
- 6.2.1. Ready Meals
- 6.2.2. Powder Products
- 6.2.3. Fish and Seafood
- 6.2.4. Fruits and Vegetables
- 6.2.5. Processed Food
- 6.2.6. Pet Food
- 6.2.7. Other Applications
- 6.1. Market Analysis, Insights and Forecast - by Material Type
- 7. South America APAC Food Cans Market Analysis, Insights and Forecast, 2019-2031
- 7.1. Market Analysis, Insights and Forecast - by Material Type
- 7.1.1. Aluminium Cans
- 7.1.2. Steel Cans
- 7.2. Market Analysis, Insights and Forecast - by Application
- 7.2.1. Ready Meals
- 7.2.2. Powder Products
- 7.2.3. Fish and Seafood
- 7.2.4. Fruits and Vegetables
- 7.2.5. Processed Food
- 7.2.6. Pet Food
- 7.2.7. Other Applications
- 7.1. Market Analysis, Insights and Forecast - by Material Type
- 8. Europe APAC Food Cans Market Analysis, Insights and Forecast, 2019-2031
- 8.1. Market Analysis, Insights and Forecast - by Material Type
- 8.1.1. Aluminium Cans
- 8.1.2. Steel Cans
- 8.2. Market Analysis, Insights and Forecast - by Application
- 8.2.1. Ready Meals
- 8.2.2. Powder Products
- 8.2.3. Fish and Seafood
- 8.2.4. Fruits and Vegetables
- 8.2.5. Processed Food
- 8.2.6. Pet Food
- 8.2.7. Other Applications
- 8.1. Market Analysis, Insights and Forecast - by Material Type
- 9. Middle East & Africa APAC Food Cans Market Analysis, Insights and Forecast, 2019-2031
- 9.1. Market Analysis, Insights and Forecast - by Material Type
- 9.1.1. Aluminium Cans
- 9.1.2. Steel Cans
- 9.2. Market Analysis, Insights and Forecast - by Application
- 9.2.1. Ready Meals
- 9.2.2. Powder Products
- 9.2.3. Fish and Seafood
- 9.2.4. Fruits and Vegetables
- 9.2.5. Processed Food
- 9.2.6. Pet Food
- 9.2.7. Other Applications
- 9.1. Market Analysis, Insights and Forecast - by Material Type
- 10. Asia Pacific APAC Food Cans Market Analysis, Insights and Forecast, 2019-2031
- 10.1. Market Analysis, Insights and Forecast - by Material Type
- 10.1.1. Aluminium Cans
- 10.1.2. Steel Cans
- 10.2. Market Analysis, Insights and Forecast - by Application
- 10.2.1. Ready Meals
- 10.2.2. Powder Products
- 10.2.3. Fish and Seafood
- 10.2.4. Fruits and Vegetables
- 10.2.5. Processed Food
- 10.2.6. Pet Food
- 10.2.7. Other Applications
- 10.1. Market Analysis, Insights and Forecast - by Material Type
- 11. North America APAC Food Cans Market Analysis, Insights and Forecast, 2019-2031
- 11.1. Market Analysis, Insights and Forecast - By Country/Sub-region
- 11.1.1.
- 12. Europe APAC Food Cans Market Analysis, Insights and Forecast, 2019-2031
- 12.1. Market Analysis, Insights and Forecast - By Country/Sub-region
- 12.1.1.
- 13. Asia APAC Food Cans Market Analysis, Insights and Forecast, 2019-2031
- 13.1. Market Analysis, Insights and Forecast - By Country/Sub-region
- 13.1.1.
- 14. Australia and New Zealand APAC Food Cans Market Analysis, Insights and Forecast, 2019-2031
- 14.1. Market Analysis, Insights and Forecast - By Country/Sub-region
- 14.1.1.
- 15. Latin America APAC Food Cans Market Analysis, Insights and Forecast, 2019-2031
- 15.1. Market Analysis, Insights and Forecast - By Country/Sub-region
- 15.1.1.
- 16. Middle East and Africa APAC Food Cans Market Analysis, Insights and Forecast, 2019-2031
- 16.1. Market Analysis, Insights and Forecast - By Country/Sub-region
- 16.1.1.
- 17. Competitive Analysis
- 17.1. Global Market Share Analysis 2024
- 17.2. Company Profiles
- 17.2.1 KIAN JOO GROUP
- 17.2.1.1. Overview
- 17.2.1.2. Products
- 17.2.1.3. SWOT Analysis
- 17.2.1.4. Recent Developments
- 17.2.1.5. Financials (Based on Availability)
- 17.2.2 Sonoco Products Company
- 17.2.2.1. Overview
- 17.2.2.2. Products
- 17.2.2.3. SWOT Analysis
- 17.2.2.4. Recent Developments
- 17.2.2.5. Financials (Based on Availability)
- 17.2.3 Ball Corporation
- 17.2.3.1. Overview
- 17.2.3.2. Products
- 17.2.3.3. SWOT Analysis
- 17.2.3.4. Recent Developments
- 17.2.3.5. Financials (Based on Availability)
- 17.2.4 Crown Holdings Inc
- 17.2.4.1. Overview
- 17.2.4.2. Products
- 17.2.4.3. SWOT Analysis
- 17.2.4.4. Recent Developments
- 17.2.4.5. Financials (Based on Availability)
- 17.2.5 TOYO SEIKAN GROUP HOLDINGS LTD
- 17.2.5.1. Overview
- 17.2.5.2. Products
- 17.2.5.3. SWOT Analysis
- 17.2.5.4. Recent Developments
- 17.2.5.5. Financials (Based on Availability)
- 17.2.6 Trivium Packaging
- 17.2.6.1. Overview
- 17.2.6.2. Products
- 17.2.6.3. SWOT Analysis
- 17.2.6.4. Recent Developments
- 17.2.6.5. Financials (Based on Availability)
- 17.2.7 CPMC Holdings Limited
- 17.2.7.1. Overview
- 17.2.7.2. Products
- 17.2.7.3. SWOT Analysis
- 17.2.7.4. Recent Developments
- 17.2.7.5. Financials (Based on Availability)
- 17.2.8 Visy Industries
- 17.2.8.1. Overview
- 17.2.8.2. Products
- 17.2.8.3. SWOT Analysis
- 17.2.8.4. Recent Developments
- 17.2.8.5. Financials (Based on Availability)
- 17.2.9 Mauser Packaging Solution
- 17.2.9.1. Overview
- 17.2.9.2. Products
- 17.2.9.3. SWOT Analysis
- 17.2.9.4. Recent Developments
- 17.2.9.5. Financials (Based on Availability)
- 17.2.1 KIAN JOO GROUP
List of Figures
- Figure 1: Global APAC Food Cans Market Revenue Breakdown (Million, %) by Region 2024 & 2032
- Figure 2: North America APAC Food Cans Market Revenue (Million), by Country 2024 & 2032
- Figure 3: North America APAC Food Cans Market Revenue Share (%), by Country 2024 & 2032
- Figure 4: Europe APAC Food Cans Market Revenue (Million), by Country 2024 & 2032
- Figure 5: Europe APAC Food Cans Market Revenue Share (%), by Country 2024 & 2032
- Figure 6: Asia APAC Food Cans Market Revenue (Million), by Country 2024 & 2032
- Figure 7: Asia APAC Food Cans Market Revenue Share (%), by Country 2024 & 2032
- Figure 8: Australia and New Zealand APAC Food Cans Market Revenue (Million), by Country 2024 & 2032
- Figure 9: Australia and New Zealand APAC Food Cans Market Revenue Share (%), by Country 2024 & 2032
- Figure 10: Latin America APAC Food Cans Market Revenue (Million), by Country 2024 & 2032
- Figure 11: Latin America APAC Food Cans Market Revenue Share (%), by Country 2024 & 2032
- Figure 12: Middle East and Africa APAC Food Cans Market Revenue (Million), by Country 2024 & 2032
- Figure 13: Middle East and Africa APAC Food Cans Market Revenue Share (%), by Country 2024 & 2032
- Figure 14: North America APAC Food Cans Market Revenue (Million), by Material Type 2024 & 2032
- Figure 15: North America APAC Food Cans Market Revenue Share (%), by Material Type 2024 & 2032
- Figure 16: North America APAC Food Cans Market Revenue (Million), by Application 2024 & 2032
- Figure 17: North America APAC Food Cans Market Revenue Share (%), by Application 2024 & 2032
- Figure 18: North America APAC Food Cans Market Revenue (Million), by Country 2024 & 2032
- Figure 19: North America APAC Food Cans Market Revenue Share (%), by Country 2024 & 2032
- Figure 20: South America APAC Food Cans Market Revenue (Million), by Material Type 2024 & 2032
- Figure 21: South America APAC Food Cans Market Revenue Share (%), by Material Type 2024 & 2032
- Figure 22: South America APAC Food Cans Market Revenue (Million), by Application 2024 & 2032
- Figure 23: South America APAC Food Cans Market Revenue Share (%), by Application 2024 & 2032
- Figure 24: South America APAC Food Cans Market Revenue (Million), by Country 2024 & 2032
- Figure 25: South America APAC Food Cans Market Revenue Share (%), by Country 2024 & 2032
- Figure 26: Europe APAC Food Cans Market Revenue (Million), by Material Type 2024 & 2032
- Figure 27: Europe APAC Food Cans Market Revenue Share (%), by Material Type 2024 & 2032
- Figure 28: Europe APAC Food Cans Market Revenue (Million), by Application 2024 & 2032
- Figure 29: Europe APAC Food Cans Market Revenue Share (%), by Application 2024 & 2032
- Figure 30: Europe APAC Food Cans Market Revenue (Million), by Country 2024 & 2032
- Figure 31: Europe APAC Food Cans Market Revenue Share (%), by Country 2024 & 2032
- Figure 32: Middle East & Africa APAC Food Cans Market Revenue (Million), by Material Type 2024 & 2032
- Figure 33: Middle East & Africa APAC Food Cans Market Revenue Share (%), by Material Type 2024 & 2032
- Figure 34: Middle East & Africa APAC Food Cans Market Revenue (Million), by Application 2024 & 2032
- Figure 35: Middle East & Africa APAC Food Cans Market Revenue Share (%), by Application 2024 & 2032
- Figure 36: Middle East & Africa APAC Food Cans Market Revenue (Million), by Country 2024 & 2032
- Figure 37: Middle East & Africa APAC Food Cans Market Revenue Share (%), by Country 2024 & 2032
- Figure 38: Asia Pacific APAC Food Cans Market Revenue (Million), by Material Type 2024 & 2032
- Figure 39: Asia Pacific APAC Food Cans Market Revenue Share (%), by Material Type 2024 & 2032
- Figure 40: Asia Pacific APAC Food Cans Market Revenue (Million), by Application 2024 & 2032
- Figure 41: Asia Pacific APAC Food Cans Market Revenue Share (%), by Application 2024 & 2032
- Figure 42: Asia Pacific APAC Food Cans Market Revenue (Million), by Country 2024 & 2032
- Figure 43: Asia Pacific APAC Food Cans Market Revenue Share (%), by Country 2024 & 2032
List of Tables
- Table 1: Global APAC Food Cans Market Revenue Million Forecast, by Region 2019 & 2032
- Table 2: Global APAC Food Cans Market Revenue Million Forecast, by Material Type 2019 & 2032
- Table 3: Global APAC Food Cans Market Revenue Million Forecast, by Application 2019 & 2032
- Table 4: Global APAC Food Cans Market Revenue Million Forecast, by Region 2019 & 2032
- Table 5: Global APAC Food Cans Market Revenue Million Forecast, by Country 2019 & 2032
- Table 6: APAC Food Cans Market Revenue (Million) Forecast, by Application 2019 & 2032
- Table 7: Global APAC Food Cans Market Revenue Million Forecast, by Country 2019 & 2032
- Table 8: APAC Food Cans Market Revenue (Million) Forecast, by Application 2019 & 2032
- Table 9: Global APAC Food Cans Market Revenue Million Forecast, by Country 2019 & 2032
- Table 10: APAC Food Cans Market Revenue (Million) Forecast, by Application 2019 & 2032
- Table 11: Global APAC Food Cans Market Revenue Million Forecast, by Country 2019 & 2032
- Table 12: APAC Food Cans Market Revenue (Million) Forecast, by Application 2019 & 2032
- Table 13: Global APAC Food Cans Market Revenue Million Forecast, by Country 2019 & 2032
- Table 14: APAC Food Cans Market Revenue (Million) Forecast, by Application 2019 & 2032
- Table 15: Global APAC Food Cans Market Revenue Million Forecast, by Country 2019 & 2032
- Table 16: APAC Food Cans Market Revenue (Million) Forecast, by Application 2019 & 2032
- Table 17: Global APAC Food Cans Market Revenue Million Forecast, by Material Type 2019 & 2032
- Table 18: Global APAC Food Cans Market Revenue Million Forecast, by Application 2019 & 2032
- Table 19: Global APAC Food Cans Market Revenue Million Forecast, by Country 2019 & 2032
- Table 20: United States APAC Food Cans Market Revenue (Million) Forecast, by Application 2019 & 2032
- Table 21: Canada APAC Food Cans Market Revenue (Million) Forecast, by Application 2019 & 2032
- Table 22: Mexico APAC Food Cans Market Revenue (Million) Forecast, by Application 2019 & 2032
- Table 23: Global APAC Food Cans Market Revenue Million Forecast, by Material Type 2019 & 2032
- Table 24: Global APAC Food Cans Market Revenue Million Forecast, by Application 2019 & 2032
- Table 25: Global APAC Food Cans Market Revenue Million Forecast, by Country 2019 & 2032
- Table 26: Brazil APAC Food Cans Market Revenue (Million) Forecast, by Application 2019 & 2032
- Table 27: Argentina APAC Food Cans Market Revenue (Million) Forecast, by Application 2019 & 2032
- Table 28: Rest of South America APAC Food Cans Market Revenue (Million) Forecast, by Application 2019 & 2032
- Table 29: Global APAC Food Cans Market Revenue Million Forecast, by Material Type 2019 & 2032
- Table 30: Global APAC Food Cans Market Revenue Million Forecast, by Application 2019 & 2032
- Table 31: Global APAC Food Cans Market Revenue Million Forecast, by Country 2019 & 2032
- Table 32: United Kingdom APAC Food Cans Market Revenue (Million) Forecast, by Application 2019 & 2032
- Table 33: Germany APAC Food Cans Market Revenue (Million) Forecast, by Application 2019 & 2032
- Table 34: France APAC Food Cans Market Revenue (Million) Forecast, by Application 2019 & 2032
- Table 35: Italy APAC Food Cans Market Revenue (Million) Forecast, by Application 2019 & 2032
- Table 36: Spain APAC Food Cans Market Revenue (Million) Forecast, by Application 2019 & 2032
- Table 37: Russia APAC Food Cans Market Revenue (Million) Forecast, by Application 2019 & 2032
- Table 38: Benelux APAC Food Cans Market Revenue (Million) Forecast, by Application 2019 & 2032
- Table 39: Nordics APAC Food Cans Market Revenue (Million) Forecast, by Application 2019 & 2032
- Table 40: Rest of Europe APAC Food Cans Market Revenue (Million) Forecast, by Application 2019 & 2032
- Table 41: Global APAC Food Cans Market Revenue Million Forecast, by Material Type 2019 & 2032
- Table 42: Global APAC Food Cans Market Revenue Million Forecast, by Application 2019 & 2032
- Table 43: Global APAC Food Cans Market Revenue Million Forecast, by Country 2019 & 2032
- Table 44: Turkey APAC Food Cans Market Revenue (Million) Forecast, by Application 2019 & 2032
- Table 45: Israel APAC Food Cans Market Revenue (Million) Forecast, by Application 2019 & 2032
- Table 46: GCC APAC Food Cans Market Revenue (Million) Forecast, by Application 2019 & 2032
- Table 47: North Africa APAC Food Cans Market Revenue (Million) Forecast, by Application 2019 & 2032
- Table 48: South Africa APAC Food Cans Market Revenue (Million) Forecast, by Application 2019 & 2032
- Table 49: Rest of Middle East & Africa APAC Food Cans Market Revenue (Million) Forecast, by Application 2019 & 2032
- Table 50: Global APAC Food Cans Market Revenue Million Forecast, by Material Type 2019 & 2032
- Table 51: Global APAC Food Cans Market Revenue Million Forecast, by Application 2019 & 2032
- Table 52: Global APAC Food Cans Market Revenue Million Forecast, by Country 2019 & 2032
- Table 53: China APAC Food Cans Market Revenue (Million) Forecast, by Application 2019 & 2032
- Table 54: India APAC Food Cans Market Revenue (Million) Forecast, by Application 2019 & 2032
- Table 55: Japan APAC Food Cans Market Revenue (Million) Forecast, by Application 2019 & 2032
- Table 56: South Korea APAC Food Cans Market Revenue (Million) Forecast, by Application 2019 & 2032
- Table 57: ASEAN APAC Food Cans Market Revenue (Million) Forecast, by Application 2019 & 2032
- Table 58: Oceania APAC Food Cans Market Revenue (Million) Forecast, by Application 2019 & 2032
- Table 59: Rest of Asia Pacific APAC Food Cans Market Revenue (Million) Forecast, by Application 2019 & 2032
Frequently Asked Questions
1. What is the projected Compound Annual Growth Rate (CAGR) of the APAC Food Cans Market?
The projected CAGR is approximately 3.70%.
2. Which companies are prominent players in the APAC Food Cans Market?
Key companies in the market include KIAN JOO GROUP, Sonoco Products Company, Ball Corporation, Crown Holdings Inc, TOYO SEIKAN GROUP HOLDINGS LTD, Trivium Packaging, CPMC Holdings Limited, Visy Industries, Mauser Packaging Solution.
3. What are the main segments of the APAC Food Cans Market?
The market segments include Material Type, Application.
4. Can you provide details about the market size?
The market size is estimated to be USD 6.39 Million as of 2022.
5. What are some drivers contributing to market growth?
New Packaging Styles and High Potential in Emerging Economies; Increased Demand for Ready-to-Eat Foods.
6. What are the notable trends driving market growth?
Aluminum Cans to Witness Growth in the Market.
7. Are there any restraints impacting market growth?
High Use of Plastic Material Due to Lower Costs.
8. Can you provide examples of recent developments in the market?
June 2023 - Ball Corporation showcased its latest aluminum can and bottle portfolio at the BevNET Live Summer 2023 from June 14-15 in New York City. Attendees for BevNET Live will learn about Ball's range of "slim" can capabilities, including new supply locations for the 5.5oz, 6.8oz, 8.4oz, and 250mL can sizes.
9. What pricing options are available for accessing the report?
Pricing options include single-user, multi-user, and enterprise licenses priced at USD 4750, USD 4950, and USD 6800 respectively.
10. Is the market size provided in terms of value or volume?
The market size is provided in terms of value, measured in Million.
11. Are there any specific market keywords associated with the report?
Yes, the market keyword associated with the report is "APAC Food Cans Market," which aids in identifying and referencing the specific market segment covered.
12. How do I determine which pricing option suits my needs best?
The pricing options vary based on user requirements and access needs. Individual users may opt for single-user licenses, while businesses requiring broader access may choose multi-user or enterprise licenses for cost-effective access to the report.
13. Are there any additional resources or data provided in the APAC Food Cans Market report?
While the report offers comprehensive insights, it's advisable to review the specific contents or supplementary materials provided to ascertain if additional resources or data are available.
14. How can I stay updated on further developments or reports in the APAC Food Cans Market?
To stay informed about further developments, trends, and reports in the APAC Food Cans Market, consider subscribing to industry newsletters, following relevant companies and organizations, or regularly checking reputable industry news sources and publications.
Methodology
Step 1 - Identification of Relevant Samples Size from Population Database


Step 2 - Approaches for Defining Global Market Size (Value, Volume* & Price*)

Note*: In applicable scenarios
Step 3 - Data Sources
Primary Research
- Web Analytics
- Survey Reports
- Research Institute
- Latest Research Reports
- Opinion Leaders
Secondary Research
- Annual Reports
- White Paper
- Latest Press Release
- Industry Association
- Paid Database
- Investor Presentations

Step 4 - Data Triangulation
Involves using different sources of information in order to increase the validity of a study
These sources are likely to be stakeholders in a program - participants, other researchers, program staff, other community members, and so on.
Then we put all data in single framework & apply various statistical tools to find out the dynamic on the market.
During the analysis stage, feedback from the stakeholder groups would be compared to determine areas of agreement as well as areas of divergence


