
Key Insights
The Asia-Pacific (APAC) compressor oil market is experiencing robust growth, driven by the expanding industrial sector and increasing demand for energy-efficient equipment across diverse industries. The region's significant manufacturing base, particularly in China, India, and Southeast Asia, fuels the demand for compressor oils used in various applications, including refrigeration, air conditioning, and industrial processes. The market is segmented by base oil type (synthetic, mineral, and others) and end-user industry (manufacturing, chemical and petrochemical, oil and gas, and others). Synthetic compressor oils are gaining traction due to their superior performance characteristics, such as extended service life and enhanced efficiency. However, the higher cost of synthetic oils compared to mineral oils presents a challenge. Further growth is fueled by rising government initiatives promoting energy efficiency and environmental sustainability, leading to increased adoption of environmentally friendly compressor oils. Stringent emission regulations are also influencing the shift towards higher-quality, eco-friendly alternatives. Challenges include price fluctuations of raw materials and potential supply chain disruptions. Despite these challenges, the market's positive growth trajectory is projected to continue, driven by sustained industrial growth and increasing awareness of the benefits of high-performance compressor oils.
The projected Compound Annual Growth Rate (CAGR) of 3.97% for the global compressor oil market suggests a similar growth pattern within the APAC region, although this may vary slightly based on individual country performance and specific industry dynamics. Considering the significant industrial expansion in APAC, a CAGR potentially slightly above the global average is plausible. This growth is likely uneven across different segments. The manufacturing sector, with its significant presence in APAC, will likely contribute most substantially to market growth. Moreover, the burgeoning chemical and petrochemical industries in the region will further bolster the demand for compressor oils. The market is characterized by a diverse range of players, including both global giants and regional manufacturers. Competitive intensity is moderate, with companies focusing on innovation and differentiation through product quality, performance, and environmental attributes to gain a market share advantage.
APAC Compressor Oil Market: A Comprehensive Report (2019-2033)
This in-depth report provides a comprehensive analysis of the Asia-Pacific (APAC) compressor oil market, covering market dynamics, growth trends, regional segmentation, product landscape, key players, and future outlook. The study period spans from 2019 to 2033, with 2025 serving as the base and estimated year. The report is essential for industry professionals, investors, and strategic decision-makers seeking to understand and capitalize on opportunities within this dynamic market. The market size is projected to reach xx Million units by 2033.
APAC Compressor Oil Market Dynamics & Structure
The APAC compressor oil market is characterized by a moderately concentrated landscape with several major international and regional players. Technological innovation, driven by the need for enhanced performance and sustainability, is a significant driver. Stringent environmental regulations are shaping product development, favoring eco-friendly options like biodegradable oils. The market witnesses competitive pressure from substitute products like alternative lubricants, and end-user demographics are shifting towards industries with higher automation and compressor usage. Mergers and acquisitions (M&A) activity is relatively moderate, with strategic partnerships playing a larger role in market expansion.
- Market Concentration: Moderately concentrated, with top 5 players holding approximately xx% market share in 2024.
- Technological Innovation: Focus on improving energy efficiency, extending oil life, and reducing environmental impact.
- Regulatory Framework: Increasingly stringent environmental regulations promoting the adoption of eco-friendly compressor oils.
- Competitive Substitutes: Alternative lubricants and greases pose competitive challenges.
- End-User Demographics: Growth driven by manufacturing, chemical & petrochemical, and oil & gas sectors.
- M&A Trends: Moderate M&A activity, with strategic partnerships becoming increasingly important.
APAC Compressor Oil Market Growth Trends & Insights
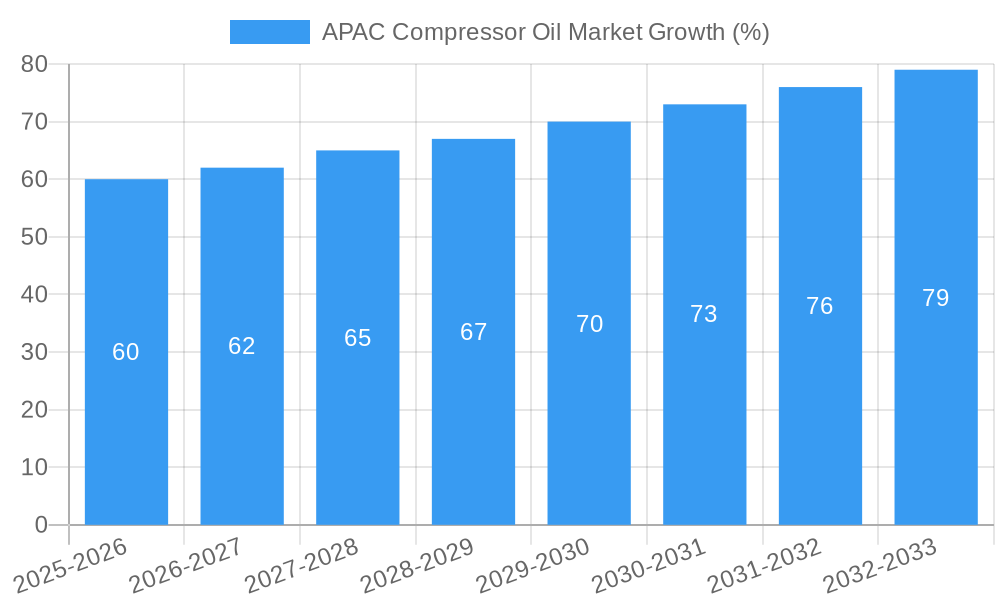
The APAC compressor oil market experienced robust growth during the historical period (2019-2024), fueled by industrial expansion, rising urbanization, and increasing demand from diverse end-user industries. The market size witnessed a CAGR of xx% from 2019 to 2024, reaching xx Million units in 2024. Technological advancements, particularly in synthetic base oils, are driving adoption rates, while changing consumer preferences towards higher-performance and sustainable products are influencing market dynamics. The market is expected to continue its growth trajectory during the forecast period (2025-2033), driven by factors such as expanding industrial sectors, infrastructure development, and increasing investments in renewable energy projects. Market penetration is expected to increase significantly in emerging economies. The CAGR for the forecast period (2025-2033) is projected to be xx%.
Dominant Regions, Countries, or Segments in APAC Compressor Oil Market
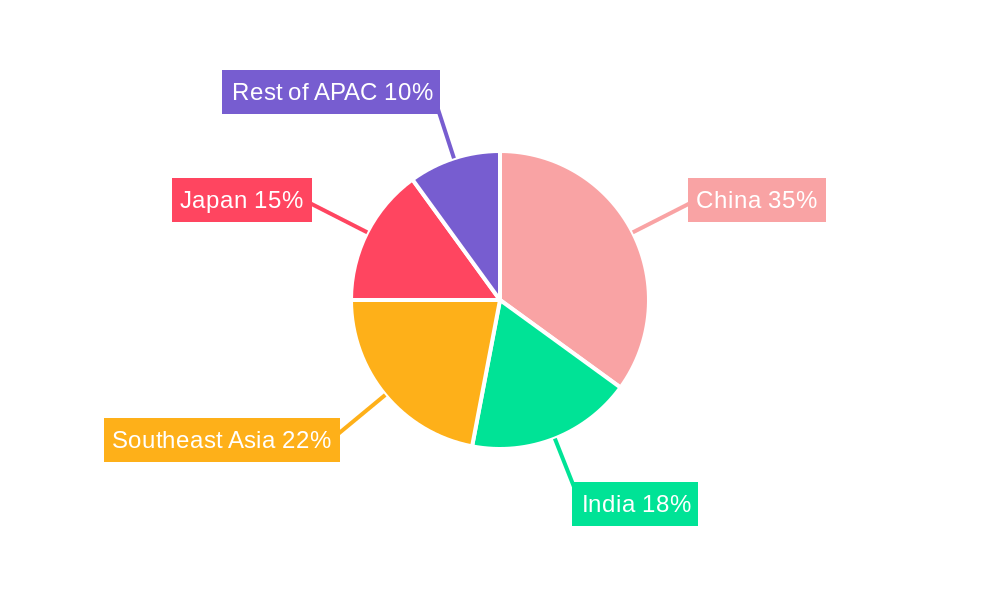
China and India are the dominant markets in the APAC region, contributing significantly to overall market growth. The manufacturing, chemical and petrochemical, and oil and gas sectors are the leading end-user industries driving demand. Within base oils, synthetic oils dominate due to their superior performance characteristics.
- Leading Region: China and India, due to rapid industrialization and substantial manufacturing activities.
- Leading End-User Industries: Manufacturing (xx%), Chemical & Petrochemical (xx%), Oil & Gas (xx%).
- Leading Base Oil Type: Synthetic (xx%), Mineral (xx%), Other (xx%).
- Key Drivers: Rapid industrialization, infrastructure development, government initiatives promoting industrial growth.
APAC Compressor Oil Market Product Landscape
The APAC compressor oil market offers a diverse range of products, including mineral, synthetic, and semi-synthetic base oils. Recent innovations focus on enhancing performance under extreme operating conditions, extending oil life, and improving energy efficiency. Product differentiation is achieved through specialized additives tailored to specific compressor types and operating environments. Key features include improved oxidation resistance, reduced wear and tear, and enhanced thermal stability.
Key Drivers, Barriers & Challenges in APAP Compressor Oil Market
Key Drivers:
- Rising industrialization and infrastructure development across APAC.
- Growing demand from key end-user industries (manufacturing, oil & gas, etc.).
- Technological advancements leading to improved compressor oil performance.
- Government initiatives promoting energy efficiency and environmental sustainability.
Key Challenges & Restraints:
- Fluctuations in crude oil prices impacting production costs.
- Stringent environmental regulations requiring compliance and potentially increasing costs.
- Intense competition from established and emerging players impacting pricing.
- Supply chain disruptions affecting raw material availability and logistics.
Emerging Opportunities in APAC Compressor Oil Market
- Expanding into untapped markets within the APAC region, particularly in Southeast Asia.
- Development of specialized compressor oils for niche applications (e.g., renewable energy).
- Increased focus on sustainable and biodegradable compressor oils to meet environmental regulations.
- Adoption of advanced technologies, such as nanotechnology, to enhance oil performance.
Growth Accelerators in the APAC Compressor Oil Market Industry
Long-term growth is fueled by sustained industrial growth across the region, coupled with ongoing technological advancements in compressor oil formulations. Strategic partnerships between oil producers and compressor manufacturers can drive product innovation and market penetration. Expansion into emerging markets and a focus on sustainability will further accelerate market expansion.
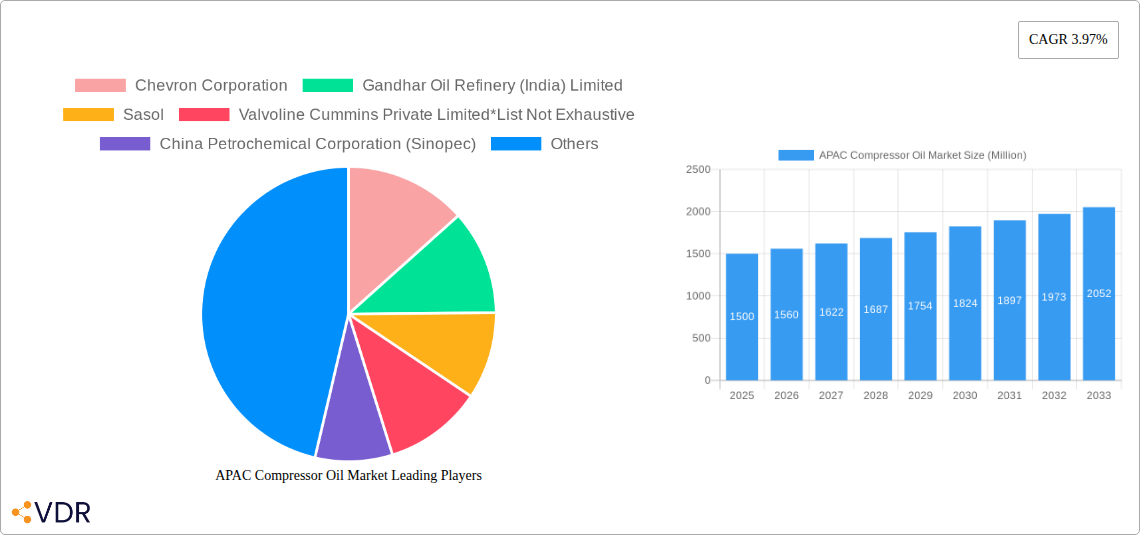
Key Players Shaping the APAC Compressor Oil Market Market
- Chevron Corporation
- Gandhar Oil Refinery (India) Limited
- Sasol
- Valvoline Cummins Private Limited
- China Petrochemical Corporation (Sinopec)
- TotalEnergies SE
- HP Lubricants
- Exxon Mobil Corporation
- Shell Plc
- Indian Oil Corporation Ltd
- FUCHS
Notable Milestones in APAC Compressor Oil Market Sector
- April 2023: Exxon Mobil Corporation announced a USD 109.36 million investment in a lubricant plant in Maharashtra, India, with an annual capacity of 159 million liters. This signifies a significant commitment to meeting growing domestic demand.
- November 2022: Valvoline Cummins Private Limited launched Valcomp Compressor Oil Synth 68, a synthetic oil designed for extended operation in harsh environments. This demonstrates ongoing product innovation within the market.
In-Depth APAC Compressor Oil Market Outlook
The APAC compressor oil market is poised for continued growth, driven by robust industrial expansion, technological innovation, and a shift towards sustainable products. Strategic partnerships, investments in new capacity, and a focus on meeting the demands of emerging markets present significant opportunities for market participants. The long-term outlook remains positive, with substantial potential for market expansion and value creation.
APAC Compressor Oil Market Segmentation
-
1. Base Oil
- 1.1. Synthetic
- 1.2. Mineral
- 1.3. Other Ba
-
2. End-User Industry
- 2.1. Manufacturing
- 2.2. Chemical and Petrochemical
- 2.3. Oil and Gas
- 2.4. Mining
- 2.5. Marine
- 2.6. Other En
-
3. Geography
- 3.1. China
- 3.2. India
- 3.3. Japan
- 3.4. South Korea
- 3.5. ASEAN Countries
- 3.6. Rest of Asia-Pacific
APAC Compressor Oil Market Segmentation By Geography
- 1. China
- 2. India
- 3. Japan
- 4. South Korea
- 5. ASEAN Countries
- 6. Rest of Asia Pacific
APAC Compressor Oil Market REPORT HIGHLIGHTS
| Aspects | Details |
|---|---|
| Study Period | 2019-2033 |
| Base Year | 2024 |
| Estimated Year | 2025 |
| Forecast Period | 2025-2033 |
| Historical Period | 2019-2024 |
| Growth Rate | CAGR of 3.97% from 2019-2033 |
| Segmentation |
|
Table of Contents
- 1. Introduction
- 1.1. Research Scope
- 1.2. Market Segmentation
- 1.3. Research Methodology
- 1.4. Definitions and Assumptions
- 2. Executive Summary
- 2.1. Introduction
- 3. Market Dynamics
- 3.1. Introduction
- 3.2. Market Drivers
- 3.2.1. Increasing Investments in the Oil and Gas Industry; Growing Demand from the Manufacturing Industry; Other Drivers
- 3.3. Market Restrains
- 3.3.1. Growing Popularity of Oil Free Compressors; Other Restraints
- 3.4. Market Trends
- 3.4.1. Increasing Investments in the Oil and Gas Industry
- 4. Market Factor Analysis
- 4.1. Porters Five Forces
- 4.2. Supply/Value Chain
- 4.3. PESTEL analysis
- 4.4. Market Entropy
- 4.5. Patent/Trademark Analysis
- 5. Global APAC Compressor Oil Market Analysis, Insights and Forecast, 2019-2031
- 5.1. Market Analysis, Insights and Forecast - by Base Oil
- 5.1.1. Synthetic
- 5.1.2. Mineral
- 5.1.3. Other Ba
- 5.2. Market Analysis, Insights and Forecast - by End-User Industry
- 5.2.1. Manufacturing
- 5.2.2. Chemical and Petrochemical
- 5.2.3. Oil and Gas
- 5.2.4. Mining
- 5.2.5. Marine
- 5.2.6. Other En
- 5.3. Market Analysis, Insights and Forecast - by Geography
- 5.3.1. China
- 5.3.2. India
- 5.3.3. Japan
- 5.3.4. South Korea
- 5.3.5. ASEAN Countries
- 5.3.6. Rest of Asia-Pacific
- 5.4. Market Analysis, Insights and Forecast - by Region
- 5.4.1. China
- 5.4.2. India
- 5.4.3. Japan
- 5.4.4. South Korea
- 5.4.5. ASEAN Countries
- 5.4.6. Rest of Asia Pacific
- 5.1. Market Analysis, Insights and Forecast - by Base Oil
- 6. China APAC Compressor Oil Market Analysis, Insights and Forecast, 2019-2031
- 6.1. Market Analysis, Insights and Forecast - by Base Oil
- 6.1.1. Synthetic
- 6.1.2. Mineral
- 6.1.3. Other Ba
- 6.2. Market Analysis, Insights and Forecast - by End-User Industry
- 6.2.1. Manufacturing
- 6.2.2. Chemical and Petrochemical
- 6.2.3. Oil and Gas
- 6.2.4. Mining
- 6.2.5. Marine
- 6.2.6. Other En
- 6.3. Market Analysis, Insights and Forecast - by Geography
- 6.3.1. China
- 6.3.2. India
- 6.3.3. Japan
- 6.3.4. South Korea
- 6.3.5. ASEAN Countries
- 6.3.6. Rest of Asia-Pacific
- 6.1. Market Analysis, Insights and Forecast - by Base Oil
- 7. India APAC Compressor Oil Market Analysis, Insights and Forecast, 2019-2031
- 7.1. Market Analysis, Insights and Forecast - by Base Oil
- 7.1.1. Synthetic
- 7.1.2. Mineral
- 7.1.3. Other Ba
- 7.2. Market Analysis, Insights and Forecast - by End-User Industry
- 7.2.1. Manufacturing
- 7.2.2. Chemical and Petrochemical
- 7.2.3. Oil and Gas
- 7.2.4. Mining
- 7.2.5. Marine
- 7.2.6. Other En
- 7.3. Market Analysis, Insights and Forecast - by Geography
- 7.3.1. China
- 7.3.2. India
- 7.3.3. Japan
- 7.3.4. South Korea
- 7.3.5. ASEAN Countries
- 7.3.6. Rest of Asia-Pacific
- 7.1. Market Analysis, Insights and Forecast - by Base Oil
- 8. Japan APAC Compressor Oil Market Analysis, Insights and Forecast, 2019-2031
- 8.1. Market Analysis, Insights and Forecast - by Base Oil
- 8.1.1. Synthetic
- 8.1.2. Mineral
- 8.1.3. Other Ba
- 8.2. Market Analysis, Insights and Forecast - by End-User Industry
- 8.2.1. Manufacturing
- 8.2.2. Chemical and Petrochemical
- 8.2.3. Oil and Gas
- 8.2.4. Mining
- 8.2.5. Marine
- 8.2.6. Other En
- 8.3. Market Analysis, Insights and Forecast - by Geography
- 8.3.1. China
- 8.3.2. India
- 8.3.3. Japan
- 8.3.4. South Korea
- 8.3.5. ASEAN Countries
- 8.3.6. Rest of Asia-Pacific
- 8.1. Market Analysis, Insights and Forecast - by Base Oil
- 9. South Korea APAC Compressor Oil Market Analysis, Insights and Forecast, 2019-2031
- 9.1. Market Analysis, Insights and Forecast - by Base Oil
- 9.1.1. Synthetic
- 9.1.2. Mineral
- 9.1.3. Other Ba
- 9.2. Market Analysis, Insights and Forecast - by End-User Industry
- 9.2.1. Manufacturing
- 9.2.2. Chemical and Petrochemical
- 9.2.3. Oil and Gas
- 9.2.4. Mining
- 9.2.5. Marine
- 9.2.6. Other En
- 9.3. Market Analysis, Insights and Forecast - by Geography
- 9.3.1. China
- 9.3.2. India
- 9.3.3. Japan
- 9.3.4. South Korea
- 9.3.5. ASEAN Countries
- 9.3.6. Rest of Asia-Pacific
- 9.1. Market Analysis, Insights and Forecast - by Base Oil
- 10. ASEAN Countries APAC Compressor Oil Market Analysis, Insights and Forecast, 2019-2031
- 10.1. Market Analysis, Insights and Forecast - by Base Oil
- 10.1.1. Synthetic
- 10.1.2. Mineral
- 10.1.3. Other Ba
- 10.2. Market Analysis, Insights and Forecast - by End-User Industry
- 10.2.1. Manufacturing
- 10.2.2. Chemical and Petrochemical
- 10.2.3. Oil and Gas
- 10.2.4. Mining
- 10.2.5. Marine
- 10.2.6. Other En
- 10.3. Market Analysis, Insights and Forecast - by Geography
- 10.3.1. China
- 10.3.2. India
- 10.3.3. Japan
- 10.3.4. South Korea
- 10.3.5. ASEAN Countries
- 10.3.6. Rest of Asia-Pacific
- 10.1. Market Analysis, Insights and Forecast - by Base Oil
- 11. Rest of Asia Pacific APAC Compressor Oil Market Analysis, Insights and Forecast, 2019-2031
- 11.1. Market Analysis, Insights and Forecast - by Base Oil
- 11.1.1. Synthetic
- 11.1.2. Mineral
- 11.1.3. Other Ba
- 11.2. Market Analysis, Insights and Forecast - by End-User Industry
- 11.2.1. Manufacturing
- 11.2.2. Chemical and Petrochemical
- 11.2.3. Oil and Gas
- 11.2.4. Mining
- 11.2.5. Marine
- 11.2.6. Other En
- 11.3. Market Analysis, Insights and Forecast - by Geography
- 11.3.1. China
- 11.3.2. India
- 11.3.3. Japan
- 11.3.4. South Korea
- 11.3.5. ASEAN Countries
- 11.3.6. Rest of Asia-Pacific
- 11.1. Market Analysis, Insights and Forecast - by Base Oil
- 12. North America APAC Compressor Oil Market Analysis, Insights and Forecast, 2019-2031
- 12.1. Market Analysis, Insights and Forecast - By Country/Sub-region
- 12.1.1 United States
- 12.1.2 Canada
- 12.1.3 Mexico
- 13. Europe APAC Compressor Oil Market Analysis, Insights and Forecast, 2019-2031
- 13.1. Market Analysis, Insights and Forecast - By Country/Sub-region
- 13.1.1 Germany
- 13.1.2 United Kingdom
- 13.1.3 France
- 13.1.4 Spain
- 13.1.5 Italy
- 13.1.6 Spain
- 13.1.7 Belgium
- 13.1.8 Netherland
- 13.1.9 Nordics
- 13.1.10 Rest of Europe
- 14. Asia Pacific APAC Compressor Oil Market Analysis, Insights and Forecast, 2019-2031
- 14.1. Market Analysis, Insights and Forecast - By Country/Sub-region
- 14.1.1 China
- 14.1.2 Japan
- 14.1.3 India
- 14.1.4 South Korea
- 14.1.5 Southeast Asia
- 14.1.6 Australia
- 14.1.7 Indonesia
- 14.1.8 Phillipes
- 14.1.9 Singapore
- 14.1.10 Thailandc
- 14.1.11 Rest of Asia Pacific
- 15. South America APAC Compressor Oil Market Analysis, Insights and Forecast, 2019-2031
- 15.1. Market Analysis, Insights and Forecast - By Country/Sub-region
- 15.1.1 Brazil
- 15.1.2 Argentina
- 15.1.3 Peru
- 15.1.4 Chile
- 15.1.5 Colombia
- 15.1.6 Ecuador
- 15.1.7 Venezuela
- 15.1.8 Rest of South America
- 16. North America APAC Compressor Oil Market Analysis, Insights and Forecast, 2019-2031
- 16.1. Market Analysis, Insights and Forecast - By Country/Sub-region
- 16.1.1 United States
- 16.1.2 Canada
- 16.1.3 Mexico
- 17. MEA APAC Compressor Oil Market Analysis, Insights and Forecast, 2019-2031
- 17.1. Market Analysis, Insights and Forecast - By Country/Sub-region
- 17.1.1 United Arab Emirates
- 17.1.2 Saudi Arabia
- 17.1.3 South Africa
- 17.1.4 Rest of Middle East and Africa
- 18. Competitive Analysis
- 18.1. Global Market Share Analysis 2024
- 18.2. Company Profiles
- 18.2.1 Chevron Corporation
- 18.2.1.1. Overview
- 18.2.1.2. Products
- 18.2.1.3. SWOT Analysis
- 18.2.1.4. Recent Developments
- 18.2.1.5. Financials (Based on Availability)
- 18.2.2 Gandhar Oil Refinery (India) Limited
- 18.2.2.1. Overview
- 18.2.2.2. Products
- 18.2.2.3. SWOT Analysis
- 18.2.2.4. Recent Developments
- 18.2.2.5. Financials (Based on Availability)
- 18.2.3 Sasol
- 18.2.3.1. Overview
- 18.2.3.2. Products
- 18.2.3.3. SWOT Analysis
- 18.2.3.4. Recent Developments
- 18.2.3.5. Financials (Based on Availability)
- 18.2.4 Valvoline Cummins Private Limited*List Not Exhaustive
- 18.2.4.1. Overview
- 18.2.4.2. Products
- 18.2.4.3. SWOT Analysis
- 18.2.4.4. Recent Developments
- 18.2.4.5. Financials (Based on Availability)
- 18.2.5 China Petrochemical Corporation (Sinopec)
- 18.2.5.1. Overview
- 18.2.5.2. Products
- 18.2.5.3. SWOT Analysis
- 18.2.5.4. Recent Developments
- 18.2.5.5. Financials (Based on Availability)
- 18.2.6 TotalEnergies SE
- 18.2.6.1. Overview
- 18.2.6.2. Products
- 18.2.6.3. SWOT Analysis
- 18.2.6.4. Recent Developments
- 18.2.6.5. Financials (Based on Availability)
- 18.2.7 HP Lubricants
- 18.2.7.1. Overview
- 18.2.7.2. Products
- 18.2.7.3. SWOT Analysis
- 18.2.7.4. Recent Developments
- 18.2.7.5. Financials (Based on Availability)
- 18.2.8 Exxon Mobil Corporation
- 18.2.8.1. Overview
- 18.2.8.2. Products
- 18.2.8.3. SWOT Analysis
- 18.2.8.4. Recent Developments
- 18.2.8.5. Financials (Based on Availability)
- 18.2.9 Shell Plc
- 18.2.9.1. Overview
- 18.2.9.2. Products
- 18.2.9.3. SWOT Analysis
- 18.2.9.4. Recent Developments
- 18.2.9.5. Financials (Based on Availability)
- 18.2.10 Indian Oil Corporation Ltd
- 18.2.10.1. Overview
- 18.2.10.2. Products
- 18.2.10.3. SWOT Analysis
- 18.2.10.4. Recent Developments
- 18.2.10.5. Financials (Based on Availability)
- 18.2.11 FUCHS
- 18.2.11.1. Overview
- 18.2.11.2. Products
- 18.2.11.3. SWOT Analysis
- 18.2.11.4. Recent Developments
- 18.2.11.5. Financials (Based on Availability)
- 18.2.1 Chevron Corporation
List of Figures
- Figure 1: Global APAC Compressor Oil Market Revenue Breakdown (Million, %) by Region 2024 & 2032
- Figure 2: Global APAC Compressor Oil Market Volume Breakdown (Million, %) by Region 2024 & 2032
- Figure 3: North America APAC Compressor Oil Market Revenue (Million), by Country 2024 & 2032
- Figure 4: North America APAC Compressor Oil Market Volume (Million), by Country 2024 & 2032
- Figure 5: North America APAC Compressor Oil Market Revenue Share (%), by Country 2024 & 2032
- Figure 6: North America APAC Compressor Oil Market Volume Share (%), by Country 2024 & 2032
- Figure 7: Europe APAC Compressor Oil Market Revenue (Million), by Country 2024 & 2032
- Figure 8: Europe APAC Compressor Oil Market Volume (Million), by Country 2024 & 2032
- Figure 9: Europe APAC Compressor Oil Market Revenue Share (%), by Country 2024 & 2032
- Figure 10: Europe APAC Compressor Oil Market Volume Share (%), by Country 2024 & 2032
- Figure 11: Asia Pacific APAC Compressor Oil Market Revenue (Million), by Country 2024 & 2032
- Figure 12: Asia Pacific APAC Compressor Oil Market Volume (Million), by Country 2024 & 2032
- Figure 13: Asia Pacific APAC Compressor Oil Market Revenue Share (%), by Country 2024 & 2032
- Figure 14: Asia Pacific APAC Compressor Oil Market Volume Share (%), by Country 2024 & 2032
- Figure 15: South America APAC Compressor Oil Market Revenue (Million), by Country 2024 & 2032
- Figure 16: South America APAC Compressor Oil Market Volume (Million), by Country 2024 & 2032
- Figure 17: South America APAC Compressor Oil Market Revenue Share (%), by Country 2024 & 2032
- Figure 18: South America APAC Compressor Oil Market Volume Share (%), by Country 2024 & 2032
- Figure 19: North America APAC Compressor Oil Market Revenue (Million), by Country 2024 & 2032
- Figure 20: North America APAC Compressor Oil Market Volume (Million), by Country 2024 & 2032
- Figure 21: North America APAC Compressor Oil Market Revenue Share (%), by Country 2024 & 2032
- Figure 22: North America APAC Compressor Oil Market Volume Share (%), by Country 2024 & 2032
- Figure 23: MEA APAC Compressor Oil Market Revenue (Million), by Country 2024 & 2032
- Figure 24: MEA APAC Compressor Oil Market Volume (Million), by Country 2024 & 2032
- Figure 25: MEA APAC Compressor Oil Market Revenue Share (%), by Country 2024 & 2032
- Figure 26: MEA APAC Compressor Oil Market Volume Share (%), by Country 2024 & 2032
- Figure 27: China APAC Compressor Oil Market Revenue (Million), by Base Oil 2024 & 2032
- Figure 28: China APAC Compressor Oil Market Volume (Million), by Base Oil 2024 & 2032
- Figure 29: China APAC Compressor Oil Market Revenue Share (%), by Base Oil 2024 & 2032
- Figure 30: China APAC Compressor Oil Market Volume Share (%), by Base Oil 2024 & 2032
- Figure 31: China APAC Compressor Oil Market Revenue (Million), by End-User Industry 2024 & 2032
- Figure 32: China APAC Compressor Oil Market Volume (Million), by End-User Industry 2024 & 2032
- Figure 33: China APAC Compressor Oil Market Revenue Share (%), by End-User Industry 2024 & 2032
- Figure 34: China APAC Compressor Oil Market Volume Share (%), by End-User Industry 2024 & 2032
- Figure 35: China APAC Compressor Oil Market Revenue (Million), by Geography 2024 & 2032
- Figure 36: China APAC Compressor Oil Market Volume (Million), by Geography 2024 & 2032
- Figure 37: China APAC Compressor Oil Market Revenue Share (%), by Geography 2024 & 2032
- Figure 38: China APAC Compressor Oil Market Volume Share (%), by Geography 2024 & 2032
- Figure 39: China APAC Compressor Oil Market Revenue (Million), by Country 2024 & 2032
- Figure 40: China APAC Compressor Oil Market Volume (Million), by Country 2024 & 2032
- Figure 41: China APAC Compressor Oil Market Revenue Share (%), by Country 2024 & 2032
- Figure 42: China APAC Compressor Oil Market Volume Share (%), by Country 2024 & 2032
- Figure 43: India APAC Compressor Oil Market Revenue (Million), by Base Oil 2024 & 2032
- Figure 44: India APAC Compressor Oil Market Volume (Million), by Base Oil 2024 & 2032
- Figure 45: India APAC Compressor Oil Market Revenue Share (%), by Base Oil 2024 & 2032
- Figure 46: India APAC Compressor Oil Market Volume Share (%), by Base Oil 2024 & 2032
- Figure 47: India APAC Compressor Oil Market Revenue (Million), by End-User Industry 2024 & 2032
- Figure 48: India APAC Compressor Oil Market Volume (Million), by End-User Industry 2024 & 2032
- Figure 49: India APAC Compressor Oil Market Revenue Share (%), by End-User Industry 2024 & 2032
- Figure 50: India APAC Compressor Oil Market Volume Share (%), by End-User Industry 2024 & 2032
- Figure 51: India APAC Compressor Oil Market Revenue (Million), by Geography 2024 & 2032
- Figure 52: India APAC Compressor Oil Market Volume (Million), by Geography 2024 & 2032
- Figure 53: India APAC Compressor Oil Market Revenue Share (%), by Geography 2024 & 2032
- Figure 54: India APAC Compressor Oil Market Volume Share (%), by Geography 2024 & 2032
- Figure 55: India APAC Compressor Oil Market Revenue (Million), by Country 2024 & 2032
- Figure 56: India APAC Compressor Oil Market Volume (Million), by Country 2024 & 2032
- Figure 57: India APAC Compressor Oil Market Revenue Share (%), by Country 2024 & 2032
- Figure 58: India APAC Compressor Oil Market Volume Share (%), by Country 2024 & 2032
- Figure 59: Japan APAC Compressor Oil Market Revenue (Million), by Base Oil 2024 & 2032
- Figure 60: Japan APAC Compressor Oil Market Volume (Million), by Base Oil 2024 & 2032
- Figure 61: Japan APAC Compressor Oil Market Revenue Share (%), by Base Oil 2024 & 2032
- Figure 62: Japan APAC Compressor Oil Market Volume Share (%), by Base Oil 2024 & 2032
- Figure 63: Japan APAC Compressor Oil Market Revenue (Million), by End-User Industry 2024 & 2032
- Figure 64: Japan APAC Compressor Oil Market Volume (Million), by End-User Industry 2024 & 2032
- Figure 65: Japan APAC Compressor Oil Market Revenue Share (%), by End-User Industry 2024 & 2032
- Figure 66: Japan APAC Compressor Oil Market Volume Share (%), by End-User Industry 2024 & 2032
- Figure 67: Japan APAC Compressor Oil Market Revenue (Million), by Geography 2024 & 2032
- Figure 68: Japan APAC Compressor Oil Market Volume (Million), by Geography 2024 & 2032
- Figure 69: Japan APAC Compressor Oil Market Revenue Share (%), by Geography 2024 & 2032
- Figure 70: Japan APAC Compressor Oil Market Volume Share (%), by Geography 2024 & 2032
- Figure 71: Japan APAC Compressor Oil Market Revenue (Million), by Country 2024 & 2032
- Figure 72: Japan APAC Compressor Oil Market Volume (Million), by Country 2024 & 2032
- Figure 73: Japan APAC Compressor Oil Market Revenue Share (%), by Country 2024 & 2032
- Figure 74: Japan APAC Compressor Oil Market Volume Share (%), by Country 2024 & 2032
- Figure 75: South Korea APAC Compressor Oil Market Revenue (Million), by Base Oil 2024 & 2032
- Figure 76: South Korea APAC Compressor Oil Market Volume (Million), by Base Oil 2024 & 2032
- Figure 77: South Korea APAC Compressor Oil Market Revenue Share (%), by Base Oil 2024 & 2032
- Figure 78: South Korea APAC Compressor Oil Market Volume Share (%), by Base Oil 2024 & 2032
- Figure 79: South Korea APAC Compressor Oil Market Revenue (Million), by End-User Industry 2024 & 2032
- Figure 80: South Korea APAC Compressor Oil Market Volume (Million), by End-User Industry 2024 & 2032
- Figure 81: South Korea APAC Compressor Oil Market Revenue Share (%), by End-User Industry 2024 & 2032
- Figure 82: South Korea APAC Compressor Oil Market Volume Share (%), by End-User Industry 2024 & 2032
- Figure 83: South Korea APAC Compressor Oil Market Revenue (Million), by Geography 2024 & 2032
- Figure 84: South Korea APAC Compressor Oil Market Volume (Million), by Geography 2024 & 2032
- Figure 85: South Korea APAC Compressor Oil Market Revenue Share (%), by Geography 2024 & 2032
- Figure 86: South Korea APAC Compressor Oil Market Volume Share (%), by Geography 2024 & 2032
- Figure 87: South Korea APAC Compressor Oil Market Revenue (Million), by Country 2024 & 2032
- Figure 88: South Korea APAC Compressor Oil Market Volume (Million), by Country 2024 & 2032
- Figure 89: South Korea APAC Compressor Oil Market Revenue Share (%), by Country 2024 & 2032
- Figure 90: South Korea APAC Compressor Oil Market Volume Share (%), by Country 2024 & 2032
- Figure 91: ASEAN Countries APAC Compressor Oil Market Revenue (Million), by Base Oil 2024 & 2032
- Figure 92: ASEAN Countries APAC Compressor Oil Market Volume (Million), by Base Oil 2024 & 2032
- Figure 93: ASEAN Countries APAC Compressor Oil Market Revenue Share (%), by Base Oil 2024 & 2032
- Figure 94: ASEAN Countries APAC Compressor Oil Market Volume Share (%), by Base Oil 2024 & 2032
- Figure 95: ASEAN Countries APAC Compressor Oil Market Revenue (Million), by End-User Industry 2024 & 2032
- Figure 96: ASEAN Countries APAC Compressor Oil Market Volume (Million), by End-User Industry 2024 & 2032
- Figure 97: ASEAN Countries APAC Compressor Oil Market Revenue Share (%), by End-User Industry 2024 & 2032
- Figure 98: ASEAN Countries APAC Compressor Oil Market Volume Share (%), by End-User Industry 2024 & 2032
- Figure 99: ASEAN Countries APAC Compressor Oil Market Revenue (Million), by Geography 2024 & 2032
- Figure 100: ASEAN Countries APAC Compressor Oil Market Volume (Million), by Geography 2024 & 2032
- Figure 101: ASEAN Countries APAC Compressor Oil Market Revenue Share (%), by Geography 2024 & 2032
- Figure 102: ASEAN Countries APAC Compressor Oil Market Volume Share (%), by Geography 2024 & 2032
- Figure 103: ASEAN Countries APAC Compressor Oil Market Revenue (Million), by Country 2024 & 2032
- Figure 104: ASEAN Countries APAC Compressor Oil Market Volume (Million), by Country 2024 & 2032
- Figure 105: ASEAN Countries APAC Compressor Oil Market Revenue Share (%), by Country 2024 & 2032
- Figure 106: ASEAN Countries APAC Compressor Oil Market Volume Share (%), by Country 2024 & 2032
- Figure 107: Rest of Asia Pacific APAC Compressor Oil Market Revenue (Million), by Base Oil 2024 & 2032
- Figure 108: Rest of Asia Pacific APAC Compressor Oil Market Volume (Million), by Base Oil 2024 & 2032
- Figure 109: Rest of Asia Pacific APAC Compressor Oil Market Revenue Share (%), by Base Oil 2024 & 2032
- Figure 110: Rest of Asia Pacific APAC Compressor Oil Market Volume Share (%), by Base Oil 2024 & 2032
- Figure 111: Rest of Asia Pacific APAC Compressor Oil Market Revenue (Million), by End-User Industry 2024 & 2032
- Figure 112: Rest of Asia Pacific APAC Compressor Oil Market Volume (Million), by End-User Industry 2024 & 2032
- Figure 113: Rest of Asia Pacific APAC Compressor Oil Market Revenue Share (%), by End-User Industry 2024 & 2032
- Figure 114: Rest of Asia Pacific APAC Compressor Oil Market Volume Share (%), by End-User Industry 2024 & 2032
- Figure 115: Rest of Asia Pacific APAC Compressor Oil Market Revenue (Million), by Geography 2024 & 2032
- Figure 116: Rest of Asia Pacific APAC Compressor Oil Market Volume (Million), by Geography 2024 & 2032
- Figure 117: Rest of Asia Pacific APAC Compressor Oil Market Revenue Share (%), by Geography 2024 & 2032
- Figure 118: Rest of Asia Pacific APAC Compressor Oil Market Volume Share (%), by Geography 2024 & 2032
- Figure 119: Rest of Asia Pacific APAC Compressor Oil Market Revenue (Million), by Country 2024 & 2032
- Figure 120: Rest of Asia Pacific APAC Compressor Oil Market Volume (Million), by Country 2024 & 2032
- Figure 121: Rest of Asia Pacific APAC Compressor Oil Market Revenue Share (%), by Country 2024 & 2032
- Figure 122: Rest of Asia Pacific APAC Compressor Oil Market Volume Share (%), by Country 2024 & 2032
List of Tables
- Table 1: Global APAC Compressor Oil Market Revenue Million Forecast, by Region 2019 & 2032
- Table 2: Global APAC Compressor Oil Market Volume Million Forecast, by Region 2019 & 2032
- Table 3: Global APAC Compressor Oil Market Revenue Million Forecast, by Base Oil 2019 & 2032
- Table 4: Global APAC Compressor Oil Market Volume Million Forecast, by Base Oil 2019 & 2032
- Table 5: Global APAC Compressor Oil Market Revenue Million Forecast, by End-User Industry 2019 & 2032
- Table 6: Global APAC Compressor Oil Market Volume Million Forecast, by End-User Industry 2019 & 2032
- Table 7: Global APAC Compressor Oil Market Revenue Million Forecast, by Geography 2019 & 2032
- Table 8: Global APAC Compressor Oil Market Volume Million Forecast, by Geography 2019 & 2032
- Table 9: Global APAC Compressor Oil Market Revenue Million Forecast, by Region 2019 & 2032
- Table 10: Global APAC Compressor Oil Market Volume Million Forecast, by Region 2019 & 2032
- Table 11: Global APAC Compressor Oil Market Revenue Million Forecast, by Country 2019 & 2032
- Table 12: Global APAC Compressor Oil Market Volume Million Forecast, by Country 2019 & 2032
- Table 13: United States APAC Compressor Oil Market Revenue (Million) Forecast, by Application 2019 & 2032
- Table 14: United States APAC Compressor Oil Market Volume (Million) Forecast, by Application 2019 & 2032
- Table 15: Canada APAC Compressor Oil Market Revenue (Million) Forecast, by Application 2019 & 2032
- Table 16: Canada APAC Compressor Oil Market Volume (Million) Forecast, by Application 2019 & 2032
- Table 17: Mexico APAC Compressor Oil Market Revenue (Million) Forecast, by Application 2019 & 2032
- Table 18: Mexico APAC Compressor Oil Market Volume (Million) Forecast, by Application 2019 & 2032
- Table 19: Global APAC Compressor Oil Market Revenue Million Forecast, by Country 2019 & 2032
- Table 20: Global APAC Compressor Oil Market Volume Million Forecast, by Country 2019 & 2032
- Table 21: Germany APAC Compressor Oil Market Revenue (Million) Forecast, by Application 2019 & 2032
- Table 22: Germany APAC Compressor Oil Market Volume (Million) Forecast, by Application 2019 & 2032
- Table 23: United Kingdom APAC Compressor Oil Market Revenue (Million) Forecast, by Application 2019 & 2032
- Table 24: United Kingdom APAC Compressor Oil Market Volume (Million) Forecast, by Application 2019 & 2032
- Table 25: France APAC Compressor Oil Market Revenue (Million) Forecast, by Application 2019 & 2032
- Table 26: France APAC Compressor Oil Market Volume (Million) Forecast, by Application 2019 & 2032
- Table 27: Spain APAC Compressor Oil Market Revenue (Million) Forecast, by Application 2019 & 2032
- Table 28: Spain APAC Compressor Oil Market Volume (Million) Forecast, by Application 2019 & 2032
- Table 29: Italy APAC Compressor Oil Market Revenue (Million) Forecast, by Application 2019 & 2032
- Table 30: Italy APAC Compressor Oil Market Volume (Million) Forecast, by Application 2019 & 2032
- Table 31: Spain APAC Compressor Oil Market Revenue (Million) Forecast, by Application 2019 & 2032
- Table 32: Spain APAC Compressor Oil Market Volume (Million) Forecast, by Application 2019 & 2032
- Table 33: Belgium APAC Compressor Oil Market Revenue (Million) Forecast, by Application 2019 & 2032
- Table 34: Belgium APAC Compressor Oil Market Volume (Million) Forecast, by Application 2019 & 2032
- Table 35: Netherland APAC Compressor Oil Market Revenue (Million) Forecast, by Application 2019 & 2032
- Table 36: Netherland APAC Compressor Oil Market Volume (Million) Forecast, by Application 2019 & 2032
- Table 37: Nordics APAC Compressor Oil Market Revenue (Million) Forecast, by Application 2019 & 2032
- Table 38: Nordics APAC Compressor Oil Market Volume (Million) Forecast, by Application 2019 & 2032
- Table 39: Rest of Europe APAC Compressor Oil Market Revenue (Million) Forecast, by Application 2019 & 2032
- Table 40: Rest of Europe APAC Compressor Oil Market Volume (Million) Forecast, by Application 2019 & 2032
- Table 41: Global APAC Compressor Oil Market Revenue Million Forecast, by Country 2019 & 2032
- Table 42: Global APAC Compressor Oil Market Volume Million Forecast, by Country 2019 & 2032
- Table 43: China APAC Compressor Oil Market Revenue (Million) Forecast, by Application 2019 & 2032
- Table 44: China APAC Compressor Oil Market Volume (Million) Forecast, by Application 2019 & 2032
- Table 45: Japan APAC Compressor Oil Market Revenue (Million) Forecast, by Application 2019 & 2032
- Table 46: Japan APAC Compressor Oil Market Volume (Million) Forecast, by Application 2019 & 2032
- Table 47: India APAC Compressor Oil Market Revenue (Million) Forecast, by Application 2019 & 2032
- Table 48: India APAC Compressor Oil Market Volume (Million) Forecast, by Application 2019 & 2032
- Table 49: South Korea APAC Compressor Oil Market Revenue (Million) Forecast, by Application 2019 & 2032
- Table 50: South Korea APAC Compressor Oil Market Volume (Million) Forecast, by Application 2019 & 2032
- Table 51: Southeast Asia APAC Compressor Oil Market Revenue (Million) Forecast, by Application 2019 & 2032
- Table 52: Southeast Asia APAC Compressor Oil Market Volume (Million) Forecast, by Application 2019 & 2032
- Table 53: Australia APAC Compressor Oil Market Revenue (Million) Forecast, by Application 2019 & 2032
- Table 54: Australia APAC Compressor Oil Market Volume (Million) Forecast, by Application 2019 & 2032
- Table 55: Indonesia APAC Compressor Oil Market Revenue (Million) Forecast, by Application 2019 & 2032
- Table 56: Indonesia APAC Compressor Oil Market Volume (Million) Forecast, by Application 2019 & 2032
- Table 57: Phillipes APAC Compressor Oil Market Revenue (Million) Forecast, by Application 2019 & 2032
- Table 58: Phillipes APAC Compressor Oil Market Volume (Million) Forecast, by Application 2019 & 2032
- Table 59: Singapore APAC Compressor Oil Market Revenue (Million) Forecast, by Application 2019 & 2032
- Table 60: Singapore APAC Compressor Oil Market Volume (Million) Forecast, by Application 2019 & 2032
- Table 61: Thailandc APAC Compressor Oil Market Revenue (Million) Forecast, by Application 2019 & 2032
- Table 62: Thailandc APAC Compressor Oil Market Volume (Million) Forecast, by Application 2019 & 2032
- Table 63: Rest of Asia Pacific APAC Compressor Oil Market Revenue (Million) Forecast, by Application 2019 & 2032
- Table 64: Rest of Asia Pacific APAC Compressor Oil Market Volume (Million) Forecast, by Application 2019 & 2032
- Table 65: Global APAC Compressor Oil Market Revenue Million Forecast, by Country 2019 & 2032
- Table 66: Global APAC Compressor Oil Market Volume Million Forecast, by Country 2019 & 2032
- Table 67: Brazil APAC Compressor Oil Market Revenue (Million) Forecast, by Application 2019 & 2032
- Table 68: Brazil APAC Compressor Oil Market Volume (Million) Forecast, by Application 2019 & 2032
- Table 69: Argentina APAC Compressor Oil Market Revenue (Million) Forecast, by Application 2019 & 2032
- Table 70: Argentina APAC Compressor Oil Market Volume (Million) Forecast, by Application 2019 & 2032
- Table 71: Peru APAC Compressor Oil Market Revenue (Million) Forecast, by Application 2019 & 2032
- Table 72: Peru APAC Compressor Oil Market Volume (Million) Forecast, by Application 2019 & 2032
- Table 73: Chile APAC Compressor Oil Market Revenue (Million) Forecast, by Application 2019 & 2032
- Table 74: Chile APAC Compressor Oil Market Volume (Million) Forecast, by Application 2019 & 2032
- Table 75: Colombia APAC Compressor Oil Market Revenue (Million) Forecast, by Application 2019 & 2032
- Table 76: Colombia APAC Compressor Oil Market Volume (Million) Forecast, by Application 2019 & 2032
- Table 77: Ecuador APAC Compressor Oil Market Revenue (Million) Forecast, by Application 2019 & 2032
- Table 78: Ecuador APAC Compressor Oil Market Volume (Million) Forecast, by Application 2019 & 2032
- Table 79: Venezuela APAC Compressor Oil Market Revenue (Million) Forecast, by Application 2019 & 2032
- Table 80: Venezuela APAC Compressor Oil Market Volume (Million) Forecast, by Application 2019 & 2032
- Table 81: Rest of South America APAC Compressor Oil Market Revenue (Million) Forecast, by Application 2019 & 2032
- Table 82: Rest of South America APAC Compressor Oil Market Volume (Million) Forecast, by Application 2019 & 2032
- Table 83: Global APAC Compressor Oil Market Revenue Million Forecast, by Country 2019 & 2032
- Table 84: Global APAC Compressor Oil Market Volume Million Forecast, by Country 2019 & 2032
- Table 85: United States APAC Compressor Oil Market Revenue (Million) Forecast, by Application 2019 & 2032
- Table 86: United States APAC Compressor Oil Market Volume (Million) Forecast, by Application 2019 & 2032
- Table 87: Canada APAC Compressor Oil Market Revenue (Million) Forecast, by Application 2019 & 2032
- Table 88: Canada APAC Compressor Oil Market Volume (Million) Forecast, by Application 2019 & 2032
- Table 89: Mexico APAC Compressor Oil Market Revenue (Million) Forecast, by Application 2019 & 2032
- Table 90: Mexico APAC Compressor Oil Market Volume (Million) Forecast, by Application 2019 & 2032
- Table 91: Global APAC Compressor Oil Market Revenue Million Forecast, by Country 2019 & 2032
- Table 92: Global APAC Compressor Oil Market Volume Million Forecast, by Country 2019 & 2032
- Table 93: United Arab Emirates APAC Compressor Oil Market Revenue (Million) Forecast, by Application 2019 & 2032
- Table 94: United Arab Emirates APAC Compressor Oil Market Volume (Million) Forecast, by Application 2019 & 2032
- Table 95: Saudi Arabia APAC Compressor Oil Market Revenue (Million) Forecast, by Application 2019 & 2032
- Table 96: Saudi Arabia APAC Compressor Oil Market Volume (Million) Forecast, by Application 2019 & 2032
- Table 97: South Africa APAC Compressor Oil Market Revenue (Million) Forecast, by Application 2019 & 2032
- Table 98: South Africa APAC Compressor Oil Market Volume (Million) Forecast, by Application 2019 & 2032
- Table 99: Rest of Middle East and Africa APAC Compressor Oil Market Revenue (Million) Forecast, by Application 2019 & 2032
- Table 100: Rest of Middle East and Africa APAC Compressor Oil Market Volume (Million) Forecast, by Application 2019 & 2032
- Table 101: Global APAC Compressor Oil Market Revenue Million Forecast, by Base Oil 2019 & 2032
- Table 102: Global APAC Compressor Oil Market Volume Million Forecast, by Base Oil 2019 & 2032
- Table 103: Global APAC Compressor Oil Market Revenue Million Forecast, by End-User Industry 2019 & 2032
- Table 104: Global APAC Compressor Oil Market Volume Million Forecast, by End-User Industry 2019 & 2032
- Table 105: Global APAC Compressor Oil Market Revenue Million Forecast, by Geography 2019 & 2032
- Table 106: Global APAC Compressor Oil Market Volume Million Forecast, by Geography 2019 & 2032
- Table 107: Global APAC Compressor Oil Market Revenue Million Forecast, by Country 2019 & 2032
- Table 108: Global APAC Compressor Oil Market Volume Million Forecast, by Country 2019 & 2032
- Table 109: Global APAC Compressor Oil Market Revenue Million Forecast, by Base Oil 2019 & 2032
- Table 110: Global APAC Compressor Oil Market Volume Million Forecast, by Base Oil 2019 & 2032
- Table 111: Global APAC Compressor Oil Market Revenue Million Forecast, by End-User Industry 2019 & 2032
- Table 112: Global APAC Compressor Oil Market Volume Million Forecast, by End-User Industry 2019 & 2032
- Table 113: Global APAC Compressor Oil Market Revenue Million Forecast, by Geography 2019 & 2032
- Table 114: Global APAC Compressor Oil Market Volume Million Forecast, by Geography 2019 & 2032
- Table 115: Global APAC Compressor Oil Market Revenue Million Forecast, by Country 2019 & 2032
- Table 116: Global APAC Compressor Oil Market Volume Million Forecast, by Country 2019 & 2032
- Table 117: Global APAC Compressor Oil Market Revenue Million Forecast, by Base Oil 2019 & 2032
- Table 118: Global APAC Compressor Oil Market Volume Million Forecast, by Base Oil 2019 & 2032
- Table 119: Global APAC Compressor Oil Market Revenue Million Forecast, by End-User Industry 2019 & 2032
- Table 120: Global APAC Compressor Oil Market Volume Million Forecast, by End-User Industry 2019 & 2032
- Table 121: Global APAC Compressor Oil Market Revenue Million Forecast, by Geography 2019 & 2032
- Table 122: Global APAC Compressor Oil Market Volume Million Forecast, by Geography 2019 & 2032
- Table 123: Global APAC Compressor Oil Market Revenue Million Forecast, by Country 2019 & 2032
- Table 124: Global APAC Compressor Oil Market Volume Million Forecast, by Country 2019 & 2032
- Table 125: Global APAC Compressor Oil Market Revenue Million Forecast, by Base Oil 2019 & 2032
- Table 126: Global APAC Compressor Oil Market Volume Million Forecast, by Base Oil 2019 & 2032
- Table 127: Global APAC Compressor Oil Market Revenue Million Forecast, by End-User Industry 2019 & 2032
- Table 128: Global APAC Compressor Oil Market Volume Million Forecast, by End-User Industry 2019 & 2032
- Table 129: Global APAC Compressor Oil Market Revenue Million Forecast, by Geography 2019 & 2032
- Table 130: Global APAC Compressor Oil Market Volume Million Forecast, by Geography 2019 & 2032
- Table 131: Global APAC Compressor Oil Market Revenue Million Forecast, by Country 2019 & 2032
- Table 132: Global APAC Compressor Oil Market Volume Million Forecast, by Country 2019 & 2032
- Table 133: Global APAC Compressor Oil Market Revenue Million Forecast, by Base Oil 2019 & 2032
- Table 134: Global APAC Compressor Oil Market Volume Million Forecast, by Base Oil 2019 & 2032
- Table 135: Global APAC Compressor Oil Market Revenue Million Forecast, by End-User Industry 2019 & 2032
- Table 136: Global APAC Compressor Oil Market Volume Million Forecast, by End-User Industry 2019 & 2032
- Table 137: Global APAC Compressor Oil Market Revenue Million Forecast, by Geography 2019 & 2032
- Table 138: Global APAC Compressor Oil Market Volume Million Forecast, by Geography 2019 & 2032
- Table 139: Global APAC Compressor Oil Market Revenue Million Forecast, by Country 2019 & 2032
- Table 140: Global APAC Compressor Oil Market Volume Million Forecast, by Country 2019 & 2032
- Table 141: Global APAC Compressor Oil Market Revenue Million Forecast, by Base Oil 2019 & 2032
- Table 142: Global APAC Compressor Oil Market Volume Million Forecast, by Base Oil 2019 & 2032
- Table 143: Global APAC Compressor Oil Market Revenue Million Forecast, by End-User Industry 2019 & 2032
- Table 144: Global APAC Compressor Oil Market Volume Million Forecast, by End-User Industry 2019 & 2032
- Table 145: Global APAC Compressor Oil Market Revenue Million Forecast, by Geography 2019 & 2032
- Table 146: Global APAC Compressor Oil Market Volume Million Forecast, by Geography 2019 & 2032
- Table 147: Global APAC Compressor Oil Market Revenue Million Forecast, by Country 2019 & 2032
- Table 148: Global APAC Compressor Oil Market Volume Million Forecast, by Country 2019 & 2032
Frequently Asked Questions
1. What is the projected Compound Annual Growth Rate (CAGR) of the APAC Compressor Oil Market?
The projected CAGR is approximately 3.97%.
2. Which companies are prominent players in the APAC Compressor Oil Market?
Key companies in the market include Chevron Corporation, Gandhar Oil Refinery (India) Limited, Sasol, Valvoline Cummins Private Limited*List Not Exhaustive, China Petrochemical Corporation (Sinopec), TotalEnergies SE, HP Lubricants, Exxon Mobil Corporation, Shell Plc, Indian Oil Corporation Ltd, FUCHS.
3. What are the main segments of the APAC Compressor Oil Market?
The market segments include Base Oil, End-User Industry, Geography.
4. Can you provide details about the market size?
The market size is estimated to be USD XX Million as of 2022.
5. What are some drivers contributing to market growth?
Increasing Investments in the Oil and Gas Industry; Growing Demand from the Manufacturing Industry; Other Drivers.
6. What are the notable trends driving market growth?
Increasing Investments in the Oil and Gas Industry.
7. Are there any restraints impacting market growth?
Growing Popularity of Oil Free Compressors; Other Restraints.
8. Can you provide examples of recent developments in the market?
April 2023: Exxon Mobil Corporation announced an investment of INR 9 billion USD 109.36 million) to develop a lubricant plant in Maharashtra, India. Once operational, the plant is anticipated to have the capacity to manufacture 159 million liters of finished lubricants annually to meet the domestic demand from industrial sectors such as manufacturing, steel, power, mining, and others. The plant is expected to begin operations by the end of 2025.
9. What pricing options are available for accessing the report?
Pricing options include single-user, multi-user, and enterprise licenses priced at USD 4750, USD 5250, and USD 8750 respectively.
10. Is the market size provided in terms of value or volume?
The market size is provided in terms of value, measured in Million and volume, measured in Million.
11. Are there any specific market keywords associated with the report?
Yes, the market keyword associated with the report is "APAC Compressor Oil Market," which aids in identifying and referencing the specific market segment covered.
12. How do I determine which pricing option suits my needs best?
The pricing options vary based on user requirements and access needs. Individual users may opt for single-user licenses, while businesses requiring broader access may choose multi-user or enterprise licenses for cost-effective access to the report.
13. Are there any additional resources or data provided in the APAC Compressor Oil Market report?
While the report offers comprehensive insights, it's advisable to review the specific contents or supplementary materials provided to ascertain if additional resources or data are available.
14. How can I stay updated on further developments or reports in the APAC Compressor Oil Market?
To stay informed about further developments, trends, and reports in the APAC Compressor Oil Market, consider subscribing to industry newsletters, following relevant companies and organizations, or regularly checking reputable industry news sources and publications.
Methodology
Step 1 - Identification of Relevant Samples Size from Population Database


Step 2 - Approaches for Defining Global Market Size (Value, Volume* & Price*)

Note*: In applicable scenarios
Step 3 - Data Sources
Primary Research
- Web Analytics
- Survey Reports
- Research Institute
- Latest Research Reports
- Opinion Leaders
Secondary Research
- Annual Reports
- White Paper
- Latest Press Release
- Industry Association
- Paid Database
- Investor Presentations

Step 4 - Data Triangulation
Involves using different sources of information in order to increase the validity of a study
These sources are likely to be stakeholders in a program - participants, other researchers, program staff, other community members, and so on.
Then we put all data in single framework & apply various statistical tools to find out the dynamic on the market.
During the analysis stage, feedback from the stakeholder groups would be compared to determine areas of agreement as well as areas of divergence


