
Key Insights
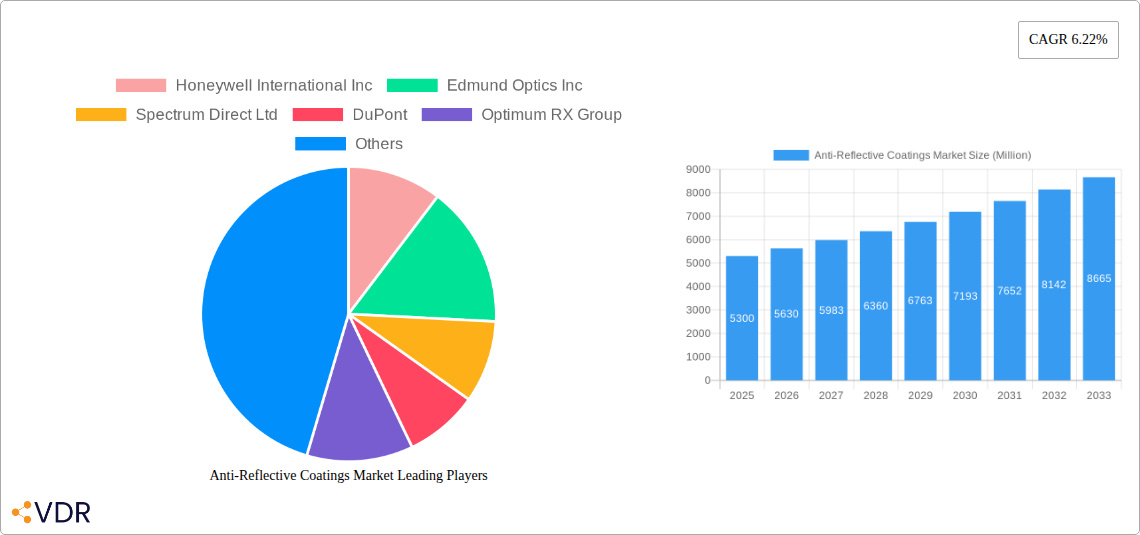
The global anti-reflective (AR) coatings market is experiencing robust growth, projected to reach $5.30 billion in 2025 and maintain a Compound Annual Growth Rate (CAGR) of 6.22% from 2025 to 2033. This expansion is driven by several key factors. The increasing demand for high-performance displays across various sectors, including consumer electronics, automotive, and solar energy, fuels the need for advanced AR coatings that enhance visibility and reduce glare. Technological advancements in deposition methods, such as chemical vapor deposition (CVD) and sputtering, are leading to the development of more durable, efficient, and cost-effective AR coatings. The rise of smart devices and augmented reality (AR) applications further contributes to market growth, as these technologies require superior optical clarity and minimal light reflection. Growth in the semiconductor and electronic devices segments is particularly significant, driven by the miniaturization of electronic components and the need for improved optical performance.
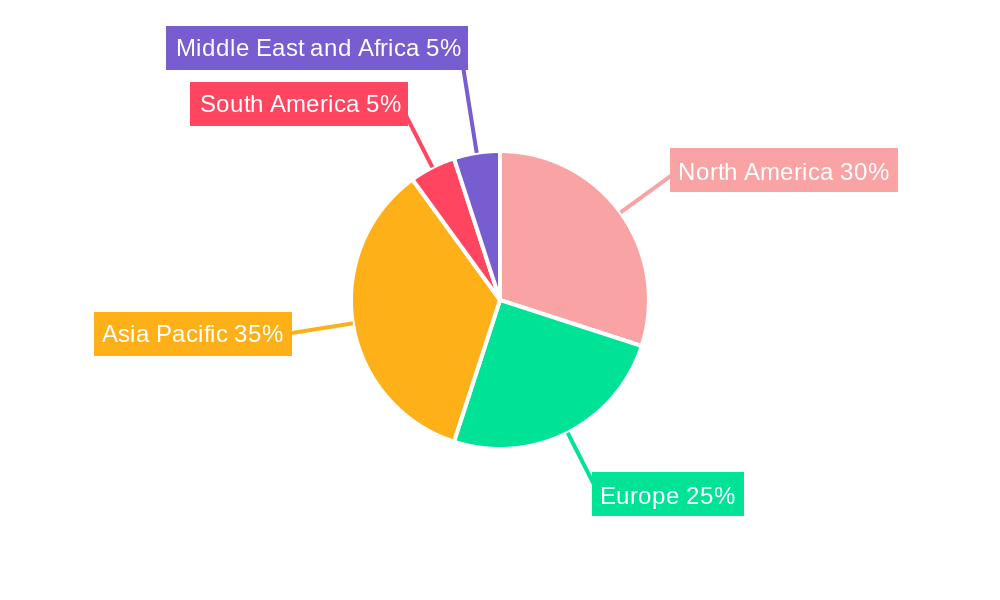
Market segmentation reveals a diverse landscape. Chemical vapor deposition and sputtering are currently dominant deposition methods, but advancements in electronic beam deposition are expected to increase its market share. Application-wise, semiconductors and electronic devices hold a substantial portion of the market, followed by eyewear, solar panels, and automotive displays. While the Asia-Pacific region, particularly China and India, is a major growth driver due to its burgeoning electronics manufacturing industry, North America and Europe continue to hold strong market positions owing to their established technological infrastructure and robust research and development activities. The market faces some challenges, such as the high initial investment costs associated with advanced deposition technologies and the potential environmental impact of some coating materials. However, ongoing innovations and increasing demand are projected to outweigh these restraints, leading to sustained market expansion.
Anti-Reflective Coatings Market: A Comprehensive Report (2019-2033)
This in-depth report provides a comprehensive analysis of the Anti-Reflective Coatings market, encompassing market dynamics, growth trends, regional dominance, product landscape, key players, and future opportunities. The report covers the parent market of optical coatings and the child market of anti-reflective coatings, offering a granular view of this rapidly evolving sector. The study period spans from 2019 to 2033, with 2025 serving as the base and estimated year. The forecast period is 2025-2033, and the historical period covers 2019-2024. The market size is valued in million units.
Anti-Reflective Coatings Market Dynamics & Structure
The anti-reflective coatings market is characterized by moderate concentration, with several major players and numerous smaller niche companies. Technological innovation, particularly in deposition methods and material science, is a key driver, alongside stringent regulatory frameworks concerning environmental impact and product safety. Competitive pressures from alternative technologies and the constant push for improved performance metrics shape the competitive landscape. Mergers and acquisitions (M&A) activity has been relatively steady, with larger players seeking to expand their product portfolios and geographic reach. The market share of the top 5 players is estimated at xx%, indicating a moderately competitive environment.
- Market Concentration: Moderately concentrated, with xx% market share held by top 5 players.
- Technological Innovation: Driven by advancements in CVD, EBD, and sputtering techniques.
- Regulatory Landscape: Stringent environmental and safety regulations impact manufacturing processes.
- Competitive Substitutes: Presence of alternative technologies necessitates continuous innovation.
- M&A Activity: Steady M&A activity reflects consolidation and expansion strategies among key players; xx deals recorded in the last 5 years.
- Innovation Barriers: High R&D costs and complex manufacturing processes present significant barriers to entry.
Anti-Reflective Coatings Market Growth Trends & Insights
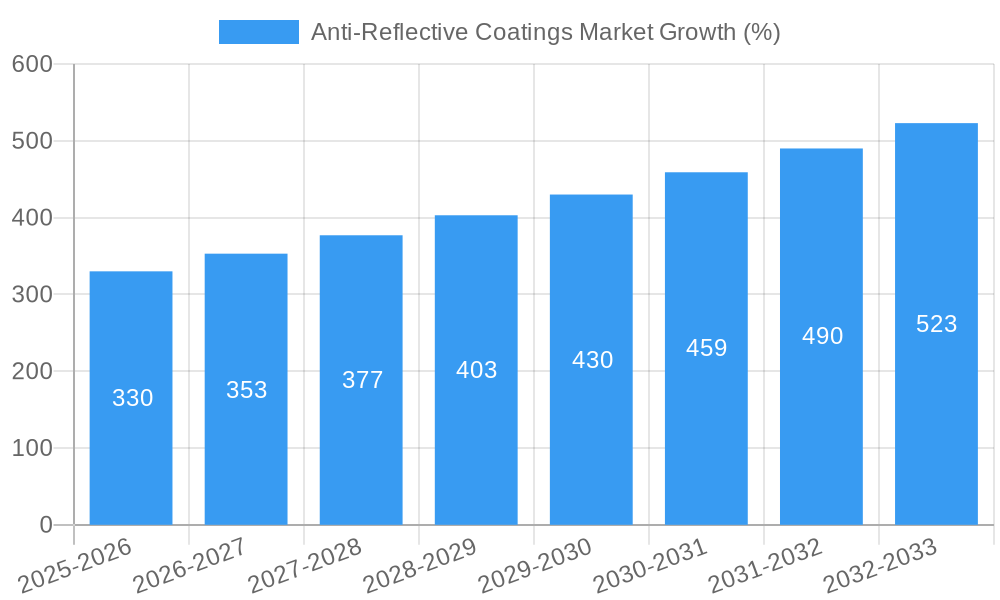
The anti-reflective coatings market has witnessed consistent growth over the past five years, driven by increasing demand across diverse applications. The market size is projected to reach xx million units by 2025 and xx million units by 2033, exhibiting a CAGR of xx% during the forecast period. This growth is fueled by the expanding adoption of advanced technologies in various end-use sectors, including semiconductors, electronics, automotive, and renewable energy. Technological disruptions, particularly the development of novel materials and deposition methods, are further accelerating market expansion. Consumer preferences for enhanced visual clarity and durability are also contributing to the overall growth trajectory.
Dominant Regions, Countries, or Segments in Anti-Reflective Coatings Market
North America currently dominates the anti-reflective coatings market, followed by Asia-Pacific. Within the application segments, semiconductors and electronic devices contribute significantly to overall market value, owing to the high demand for high-performance anti-reflective coatings in these sectors. Sputtering is the leading deposition method, driven by its cost-effectiveness and scalability.
By Application:
- Semiconductors: High growth due to increasing demand for advanced chip manufacturing.
- Electronic Devices: Strong growth driven by the proliferation of smartphones, tablets, and other electronic gadgets.
- Eyewear: Steady growth, driven by increasing consumer preference for improved visual comfort.
- Solar Panels: Significant growth potential fueled by the global expansion of renewable energy initiatives.
By Deposition Method:
- Sputtering: Dominant deposition technique due to scalability and cost-effectiveness.
- Chemical Vapor Deposition (CVD): High-performance applications drive growth in this segment.
- Electronic Beam Deposition (EBD): Niche applications requiring high precision and uniformity.
Anti-Reflective Coatings Market Product Landscape
The anti-reflective coatings market offers a wide range of products with varying performance characteristics. Recent innovations focus on enhancing durability, scratch resistance, and optical clarity. Unique selling propositions include improved transmission rates, reduced glare, and enhanced color reproduction. Technological advancements in materials science are leading to the development of coatings with superior properties and expanded applications.
Key Drivers, Barriers & Challenges in Anti-Reflective Coatings Market
Key Drivers:
- Increasing demand for high-performance optical components across multiple industries.
- Technological advancements leading to improved coating performance and reduced costs.
- Growing adoption of renewable energy technologies, particularly solar panels.
Key Challenges:
- Stringent environmental regulations impacting manufacturing processes.
- High R&D costs associated with developing novel coating materials.
- Intense competition from existing and emerging players. Price wars are resulting in a xx% decrease in average profit margins.
Emerging Opportunities in Anti-Reflective Coatings Market
- Expanding applications in augmented reality (AR) and virtual reality (VR) devices.
- Development of anti-reflective coatings for flexible electronics and wearable devices.
- Growing demand for anti-reflective coatings in the automotive sector for enhanced driver visibility.
Growth Accelerators in the Anti-Reflective Coatings Market Industry
Strategic partnerships and collaborations among material suppliers, coating manufacturers, and end-users are driving growth. Investments in R&D are crucial for developing next-generation coatings with superior performance characteristics. Expansion into emerging markets with high growth potential is also a key growth accelerator.
Key Players Shaping the Anti-Reflective Coatings Market Market
- Honeywell International Inc
- Edmund Optics Inc
- Spectrum Direct Ltd
- DuPont
- Optimum RX Group
- Viavi Solutions
- Majestic Optical Coatings
- HOYA VISION CARE COMPANY (HOYA Corporation)
- ESSILOR OF AMERICA LLC
- EKSMA Optics USB
- Optical Coatings Japan
- PPG Industries
- Rodenstock GmbH
- AGC Inc
- COCO LENI
- Torr Scientific Ltd
- Zygo Corporation
- Quantum Coating
- AccuCoat Inc
- Zeiss International
- Evaporated Coatings Inc
- Optics Balzers AG
Notable Milestones in Anti-Reflective Coatings Market Sector
- February 2022: Zygo Corporation expands its European presence with a new Italian office, boosting its anti-reflective coatings business.
- February 2021: Viavi Solutions establishes a new manufacturing facility in Arizona to meet growing demand for optical security and performance products, including anti-reflective coatings.
In-Depth Anti-Reflective Coatings Market Market Outlook
The future of the anti-reflective coatings market looks promising, driven by continued technological innovation and expansion into new applications. Strategic partnerships, investments in R&D, and expansion into emerging markets will be crucial for sustained growth. The market is poised for substantial growth, presenting significant opportunities for established players and new entrants alike.
Anti-Reflective Coatings Market Segmentation
-
1. Deposition Method
- 1.1. Chemical Vapor Deposition
- 1.2. Electronic Beam Deposition
- 1.3. Sputtering
- 1.4. Other Deposition Methods
-
2. Application
- 2.1. Semiconductors
- 2.2. Electronic Devices
- 2.3. Eyewear
- 2.4. Solar Panels
- 2.5. Automotive Displays
- 2.6. Other Applications
Anti-Reflective Coatings Market Segmentation By Geography
-
1. Asia Pacific
- 1.1. China
- 1.2. India
- 1.3. Japan
- 1.4. South Korea
- 1.5. Malaysia
- 1.6. Thailand
- 1.7. Indonesia
- 1.8. Vietnam
- 1.9. Rest of Asia Pacific
-
2. North America
- 2.1. United States
- 2.2. Canada
- 2.3. Mexico
-
3. Europe
- 3.1. Germany
- 3.2. United Kingdom
- 3.3. France
- 3.4. Italy
- 3.5. Spain
- 3.6. NORDIC countries
- 3.7. Turkey
- 3.8. Russia
- 3.9. Rest of Europe
-
4. South America
- 4.1. Brazil
- 4.2. Argentina
- 4.3. Colombia
- 4.4. Rest of South America
-
5. Middle East and Africa
- 5.1. Saudi Arabia
- 5.2. Qatar
- 5.3. United Arab Emirates
- 5.4. Nigeria
- 5.5. Egypt
- 5.6. South Africa
- 5.7. Rest of Middle East and Africa
Anti-Reflective Coatings Market REPORT HIGHLIGHTS
| Aspects | Details |
|---|---|
| Study Period | 2019-2033 |
| Base Year | 2024 |
| Estimated Year | 2025 |
| Forecast Period | 2025-2033 |
| Historical Period | 2019-2024 |
| Growth Rate | CAGR of 6.22% from 2019-2033 |
| Segmentation |
|
Table of Contents
- 1. Introduction
- 1.1. Research Scope
- 1.2. Market Segmentation
- 1.3. Research Methodology
- 1.4. Definitions and Assumptions
- 2. Executive Summary
- 2.1. Introduction
- 3. Market Dynamics
- 3.1. Introduction
- 3.2. Market Drivers
- 3.2.1. Increasing Demand from Eyewear Applications; Other Drivers
- 3.3. Market Restrains
- 3.3.1. High Cost of Anti-reflective Coatings; Dearth of Awareness
- 3.4. Market Trends
- 3.4.1. Increasing Demand from Eyewear Application
- 4. Market Factor Analysis
- 4.1. Porters Five Forces
- 4.2. Supply/Value Chain
- 4.3. PESTEL analysis
- 4.4. Market Entropy
- 4.5. Patent/Trademark Analysis
- 5. Global Anti-Reflective Coatings Market Analysis, Insights and Forecast, 2019-2031
- 5.1. Market Analysis, Insights and Forecast - by Deposition Method
- 5.1.1. Chemical Vapor Deposition
- 5.1.2. Electronic Beam Deposition
- 5.1.3. Sputtering
- 5.1.4. Other Deposition Methods
- 5.2. Market Analysis, Insights and Forecast - by Application
- 5.2.1. Semiconductors
- 5.2.2. Electronic Devices
- 5.2.3. Eyewear
- 5.2.4. Solar Panels
- 5.2.5. Automotive Displays
- 5.2.6. Other Applications
- 5.3. Market Analysis, Insights and Forecast - by Region
- 5.3.1. Asia Pacific
- 5.3.2. North America
- 5.3.3. Europe
- 5.3.4. South America
- 5.3.5. Middle East and Africa
- 5.1. Market Analysis, Insights and Forecast - by Deposition Method
- 6. Asia Pacific Anti-Reflective Coatings Market Analysis, Insights and Forecast, 2019-2031
- 6.1. Market Analysis, Insights and Forecast - by Deposition Method
- 6.1.1. Chemical Vapor Deposition
- 6.1.2. Electronic Beam Deposition
- 6.1.3. Sputtering
- 6.1.4. Other Deposition Methods
- 6.2. Market Analysis, Insights and Forecast - by Application
- 6.2.1. Semiconductors
- 6.2.2. Electronic Devices
- 6.2.3. Eyewear
- 6.2.4. Solar Panels
- 6.2.5. Automotive Displays
- 6.2.6. Other Applications
- 6.1. Market Analysis, Insights and Forecast - by Deposition Method
- 7. North America Anti-Reflective Coatings Market Analysis, Insights and Forecast, 2019-2031
- 7.1. Market Analysis, Insights and Forecast - by Deposition Method
- 7.1.1. Chemical Vapor Deposition
- 7.1.2. Electronic Beam Deposition
- 7.1.3. Sputtering
- 7.1.4. Other Deposition Methods
- 7.2. Market Analysis, Insights and Forecast - by Application
- 7.2.1. Semiconductors
- 7.2.2. Electronic Devices
- 7.2.3. Eyewear
- 7.2.4. Solar Panels
- 7.2.5. Automotive Displays
- 7.2.6. Other Applications
- 7.1. Market Analysis, Insights and Forecast - by Deposition Method
- 8. Europe Anti-Reflective Coatings Market Analysis, Insights and Forecast, 2019-2031
- 8.1. Market Analysis, Insights and Forecast - by Deposition Method
- 8.1.1. Chemical Vapor Deposition
- 8.1.2. Electronic Beam Deposition
- 8.1.3. Sputtering
- 8.1.4. Other Deposition Methods
- 8.2. Market Analysis, Insights and Forecast - by Application
- 8.2.1. Semiconductors
- 8.2.2. Electronic Devices
- 8.2.3. Eyewear
- 8.2.4. Solar Panels
- 8.2.5. Automotive Displays
- 8.2.6. Other Applications
- 8.1. Market Analysis, Insights and Forecast - by Deposition Method
- 9. South America Anti-Reflective Coatings Market Analysis, Insights and Forecast, 2019-2031
- 9.1. Market Analysis, Insights and Forecast - by Deposition Method
- 9.1.1. Chemical Vapor Deposition
- 9.1.2. Electronic Beam Deposition
- 9.1.3. Sputtering
- 9.1.4. Other Deposition Methods
- 9.2. Market Analysis, Insights and Forecast - by Application
- 9.2.1. Semiconductors
- 9.2.2. Electronic Devices
- 9.2.3. Eyewear
- 9.2.4. Solar Panels
- 9.2.5. Automotive Displays
- 9.2.6. Other Applications
- 9.1. Market Analysis, Insights and Forecast - by Deposition Method
- 10. Middle East and Africa Anti-Reflective Coatings Market Analysis, Insights and Forecast, 2019-2031
- 10.1. Market Analysis, Insights and Forecast - by Deposition Method
- 10.1.1. Chemical Vapor Deposition
- 10.1.2. Electronic Beam Deposition
- 10.1.3. Sputtering
- 10.1.4. Other Deposition Methods
- 10.2. Market Analysis, Insights and Forecast - by Application
- 10.2.1. Semiconductors
- 10.2.2. Electronic Devices
- 10.2.3. Eyewear
- 10.2.4. Solar Panels
- 10.2.5. Automotive Displays
- 10.2.6. Other Applications
- 10.1. Market Analysis, Insights and Forecast - by Deposition Method
- 11. Asia Pacific Anti-Reflective Coatings Market Analysis, Insights and Forecast, 2019-2031
- 11.1. Market Analysis, Insights and Forecast - By Country/Sub-region
- 11.1.1 China
- 11.1.2 India
- 11.1.3 Japan
- 11.1.4 South Korea
- 11.1.5 Rest of Asia Pacific
- 12. North America Anti-Reflective Coatings Market Analysis, Insights and Forecast, 2019-2031
- 12.1. Market Analysis, Insights and Forecast - By Country/Sub-region
- 12.1.1 United States
- 12.1.2 Canada
- 12.1.3 Mexico
- 13. Europe Anti-Reflective Coatings Market Analysis, Insights and Forecast, 2019-2031
- 13.1. Market Analysis, Insights and Forecast - By Country/Sub-region
- 13.1.1 Germany
- 13.1.2 United Kingdom
- 13.1.3 Italy
- 13.1.4 France
- 13.1.5 Rest of Europe
- 14. South America Anti-Reflective Coatings Market Analysis, Insights and Forecast, 2019-2031
- 14.1. Market Analysis, Insights and Forecast - By Country/Sub-region
- 14.1.1 Brazil
- 14.1.2 Argentina
- 14.1.3 Rest of South America
- 15. Middle East and Africa Anti-Reflective Coatings Market Analysis, Insights and Forecast, 2019-2031
- 15.1. Market Analysis, Insights and Forecast - By Country/Sub-region
- 15.1.1 Saudi Arabia
- 15.1.2 South Africa
- 15.1.3 Rest of Middle East and Africa
- 16. Competitive Analysis
- 16.1. Global Market Share Analysis 2024
- 16.2. Company Profiles
- 16.2.1 Honeywell International Inc
- 16.2.1.1. Overview
- 16.2.1.2. Products
- 16.2.1.3. SWOT Analysis
- 16.2.1.4. Recent Developments
- 16.2.1.5. Financials (Based on Availability)
- 16.2.2 Edmund Optics Inc
- 16.2.2.1. Overview
- 16.2.2.2. Products
- 16.2.2.3. SWOT Analysis
- 16.2.2.4. Recent Developments
- 16.2.2.5. Financials (Based on Availability)
- 16.2.3 Spectrum Direct Ltd
- 16.2.3.1. Overview
- 16.2.3.2. Products
- 16.2.3.3. SWOT Analysis
- 16.2.3.4. Recent Developments
- 16.2.3.5. Financials (Based on Availability)
- 16.2.4 DuPont
- 16.2.4.1. Overview
- 16.2.4.2. Products
- 16.2.4.3. SWOT Analysis
- 16.2.4.4. Recent Developments
- 16.2.4.5. Financials (Based on Availability)
- 16.2.5 Optimum RX Group
- 16.2.5.1. Overview
- 16.2.5.2. Products
- 16.2.5.3. SWOT Analysis
- 16.2.5.4. Recent Developments
- 16.2.5.5. Financials (Based on Availability)
- 16.2.6 Viavi Solutions
- 16.2.6.1. Overview
- 16.2.6.2. Products
- 16.2.6.3. SWOT Analysis
- 16.2.6.4. Recent Developments
- 16.2.6.5. Financials (Based on Availability)
- 16.2.7 Majestic Optical Coatings
- 16.2.7.1. Overview
- 16.2.7.2. Products
- 16.2.7.3. SWOT Analysis
- 16.2.7.4. Recent Developments
- 16.2.7.5. Financials (Based on Availability)
- 16.2.8 HOYA VISION CARE COMPANY (HOYA Corporation)
- 16.2.8.1. Overview
- 16.2.8.2. Products
- 16.2.8.3. SWOT Analysis
- 16.2.8.4. Recent Developments
- 16.2.8.5. Financials (Based on Availability)
- 16.2.9 ESSILOR OF AMERICA LLC
- 16.2.9.1. Overview
- 16.2.9.2. Products
- 16.2.9.3. SWOT Analysis
- 16.2.9.4. Recent Developments
- 16.2.9.5. Financials (Based on Availability)
- 16.2.10 EKSMA Optics USB
- 16.2.10.1. Overview
- 16.2.10.2. Products
- 16.2.10.3. SWOT Analysis
- 16.2.10.4. Recent Developments
- 16.2.10.5. Financials (Based on Availability)
- 16.2.11 Optical Coatings Japan
- 16.2.11.1. Overview
- 16.2.11.2. Products
- 16.2.11.3. SWOT Analysis
- 16.2.11.4. Recent Developments
- 16.2.11.5. Financials (Based on Availability)
- 16.2.12 PPG Industries
- 16.2.12.1. Overview
- 16.2.12.2. Products
- 16.2.12.3. SWOT Analysis
- 16.2.12.4. Recent Developments
- 16.2.12.5. Financials (Based on Availability)
- 16.2.13 Rodenstock GmbH
- 16.2.13.1. Overview
- 16.2.13.2. Products
- 16.2.13.3. SWOT Analysis
- 16.2.13.4. Recent Developments
- 16.2.13.5. Financials (Based on Availability)
- 16.2.14 AGC Inc
- 16.2.14.1. Overview
- 16.2.14.2. Products
- 16.2.14.3. SWOT Analysis
- 16.2.14.4. Recent Developments
- 16.2.14.5. Financials (Based on Availability)
- 16.2.15 COCO LENI
- 16.2.15.1. Overview
- 16.2.15.2. Products
- 16.2.15.3. SWOT Analysis
- 16.2.15.4. Recent Developments
- 16.2.15.5. Financials (Based on Availability)
- 16.2.16 Torr Scientific Ltd
- 16.2.16.1. Overview
- 16.2.16.2. Products
- 16.2.16.3. SWOT Analysis
- 16.2.16.4. Recent Developments
- 16.2.16.5. Financials (Based on Availability)
- 16.2.17 Zygo Corporatio
- 16.2.17.1. Overview
- 16.2.17.2. Products
- 16.2.17.3. SWOT Analysis
- 16.2.17.4. Recent Developments
- 16.2.17.5. Financials (Based on Availability)
- 16.2.18 Quantum Coating
- 16.2.18.1. Overview
- 16.2.18.2. Products
- 16.2.18.3. SWOT Analysis
- 16.2.18.4. Recent Developments
- 16.2.18.5. Financials (Based on Availability)
- 16.2.19 AccuCoat Inc
- 16.2.19.1. Overview
- 16.2.19.2. Products
- 16.2.19.3. SWOT Analysis
- 16.2.19.4. Recent Developments
- 16.2.19.5. Financials (Based on Availability)
- 16.2.20 Zeiss International
- 16.2.20.1. Overview
- 16.2.20.2. Products
- 16.2.20.3. SWOT Analysis
- 16.2.20.4. Recent Developments
- 16.2.20.5. Financials (Based on Availability)
- 16.2.21 Evaporated Coatings Inc
- 16.2.21.1. Overview
- 16.2.21.2. Products
- 16.2.21.3. SWOT Analysis
- 16.2.21.4. Recent Developments
- 16.2.21.5. Financials (Based on Availability)
- 16.2.22 Optics Balzers AG
- 16.2.22.1. Overview
- 16.2.22.2. Products
- 16.2.22.3. SWOT Analysis
- 16.2.22.4. Recent Developments
- 16.2.22.5. Financials (Based on Availability)
- 16.2.1 Honeywell International Inc
List of Figures
- Figure 1: Global Anti-Reflective Coatings Market Revenue Breakdown (Million, %) by Region 2024 & 2032
- Figure 2: Global Anti-Reflective Coatings Market Volume Breakdown (Kiloton, %) by Region 2024 & 2032
- Figure 3: Asia Pacific Anti-Reflective Coatings Market Revenue (Million), by Country 2024 & 2032
- Figure 4: Asia Pacific Anti-Reflective Coatings Market Volume (Kiloton), by Country 2024 & 2032
- Figure 5: Asia Pacific Anti-Reflective Coatings Market Revenue Share (%), by Country 2024 & 2032
- Figure 6: Asia Pacific Anti-Reflective Coatings Market Volume Share (%), by Country 2024 & 2032
- Figure 7: North America Anti-Reflective Coatings Market Revenue (Million), by Country 2024 & 2032
- Figure 8: North America Anti-Reflective Coatings Market Volume (Kiloton), by Country 2024 & 2032
- Figure 9: North America Anti-Reflective Coatings Market Revenue Share (%), by Country 2024 & 2032
- Figure 10: North America Anti-Reflective Coatings Market Volume Share (%), by Country 2024 & 2032
- Figure 11: Europe Anti-Reflective Coatings Market Revenue (Million), by Country 2024 & 2032
- Figure 12: Europe Anti-Reflective Coatings Market Volume (Kiloton), by Country 2024 & 2032
- Figure 13: Europe Anti-Reflective Coatings Market Revenue Share (%), by Country 2024 & 2032
- Figure 14: Europe Anti-Reflective Coatings Market Volume Share (%), by Country 2024 & 2032
- Figure 15: South America Anti-Reflective Coatings Market Revenue (Million), by Country 2024 & 2032
- Figure 16: South America Anti-Reflective Coatings Market Volume (Kiloton), by Country 2024 & 2032
- Figure 17: South America Anti-Reflective Coatings Market Revenue Share (%), by Country 2024 & 2032
- Figure 18: South America Anti-Reflective Coatings Market Volume Share (%), by Country 2024 & 2032
- Figure 19: Middle East and Africa Anti-Reflective Coatings Market Revenue (Million), by Country 2024 & 2032
- Figure 20: Middle East and Africa Anti-Reflective Coatings Market Volume (Kiloton), by Country 2024 & 2032
- Figure 21: Middle East and Africa Anti-Reflective Coatings Market Revenue Share (%), by Country 2024 & 2032
- Figure 22: Middle East and Africa Anti-Reflective Coatings Market Volume Share (%), by Country 2024 & 2032
- Figure 23: Asia Pacific Anti-Reflective Coatings Market Revenue (Million), by Deposition Method 2024 & 2032
- Figure 24: Asia Pacific Anti-Reflective Coatings Market Volume (Kiloton), by Deposition Method 2024 & 2032
- Figure 25: Asia Pacific Anti-Reflective Coatings Market Revenue Share (%), by Deposition Method 2024 & 2032
- Figure 26: Asia Pacific Anti-Reflective Coatings Market Volume Share (%), by Deposition Method 2024 & 2032
- Figure 27: Asia Pacific Anti-Reflective Coatings Market Revenue (Million), by Application 2024 & 2032
- Figure 28: Asia Pacific Anti-Reflective Coatings Market Volume (Kiloton), by Application 2024 & 2032
- Figure 29: Asia Pacific Anti-Reflective Coatings Market Revenue Share (%), by Application 2024 & 2032
- Figure 30: Asia Pacific Anti-Reflective Coatings Market Volume Share (%), by Application 2024 & 2032
- Figure 31: Asia Pacific Anti-Reflective Coatings Market Revenue (Million), by Country 2024 & 2032
- Figure 32: Asia Pacific Anti-Reflective Coatings Market Volume (Kiloton), by Country 2024 & 2032
- Figure 33: Asia Pacific Anti-Reflective Coatings Market Revenue Share (%), by Country 2024 & 2032
- Figure 34: Asia Pacific Anti-Reflective Coatings Market Volume Share (%), by Country 2024 & 2032
- Figure 35: North America Anti-Reflective Coatings Market Revenue (Million), by Deposition Method 2024 & 2032
- Figure 36: North America Anti-Reflective Coatings Market Volume (Kiloton), by Deposition Method 2024 & 2032
- Figure 37: North America Anti-Reflective Coatings Market Revenue Share (%), by Deposition Method 2024 & 2032
- Figure 38: North America Anti-Reflective Coatings Market Volume Share (%), by Deposition Method 2024 & 2032
- Figure 39: North America Anti-Reflective Coatings Market Revenue (Million), by Application 2024 & 2032
- Figure 40: North America Anti-Reflective Coatings Market Volume (Kiloton), by Application 2024 & 2032
- Figure 41: North America Anti-Reflective Coatings Market Revenue Share (%), by Application 2024 & 2032
- Figure 42: North America Anti-Reflective Coatings Market Volume Share (%), by Application 2024 & 2032
- Figure 43: North America Anti-Reflective Coatings Market Revenue (Million), by Country 2024 & 2032
- Figure 44: North America Anti-Reflective Coatings Market Volume (Kiloton), by Country 2024 & 2032
- Figure 45: North America Anti-Reflective Coatings Market Revenue Share (%), by Country 2024 & 2032
- Figure 46: North America Anti-Reflective Coatings Market Volume Share (%), by Country 2024 & 2032
- Figure 47: Europe Anti-Reflective Coatings Market Revenue (Million), by Deposition Method 2024 & 2032
- Figure 48: Europe Anti-Reflective Coatings Market Volume (Kiloton), by Deposition Method 2024 & 2032
- Figure 49: Europe Anti-Reflective Coatings Market Revenue Share (%), by Deposition Method 2024 & 2032
- Figure 50: Europe Anti-Reflective Coatings Market Volume Share (%), by Deposition Method 2024 & 2032
- Figure 51: Europe Anti-Reflective Coatings Market Revenue (Million), by Application 2024 & 2032
- Figure 52: Europe Anti-Reflective Coatings Market Volume (Kiloton), by Application 2024 & 2032
- Figure 53: Europe Anti-Reflective Coatings Market Revenue Share (%), by Application 2024 & 2032
- Figure 54: Europe Anti-Reflective Coatings Market Volume Share (%), by Application 2024 & 2032
- Figure 55: Europe Anti-Reflective Coatings Market Revenue (Million), by Country 2024 & 2032
- Figure 56: Europe Anti-Reflective Coatings Market Volume (Kiloton), by Country 2024 & 2032
- Figure 57: Europe Anti-Reflective Coatings Market Revenue Share (%), by Country 2024 & 2032
- Figure 58: Europe Anti-Reflective Coatings Market Volume Share (%), by Country 2024 & 2032
- Figure 59: South America Anti-Reflective Coatings Market Revenue (Million), by Deposition Method 2024 & 2032
- Figure 60: South America Anti-Reflective Coatings Market Volume (Kiloton), by Deposition Method 2024 & 2032
- Figure 61: South America Anti-Reflective Coatings Market Revenue Share (%), by Deposition Method 2024 & 2032
- Figure 62: South America Anti-Reflective Coatings Market Volume Share (%), by Deposition Method 2024 & 2032
- Figure 63: South America Anti-Reflective Coatings Market Revenue (Million), by Application 2024 & 2032
- Figure 64: South America Anti-Reflective Coatings Market Volume (Kiloton), by Application 2024 & 2032
- Figure 65: South America Anti-Reflective Coatings Market Revenue Share (%), by Application 2024 & 2032
- Figure 66: South America Anti-Reflective Coatings Market Volume Share (%), by Application 2024 & 2032
- Figure 67: South America Anti-Reflective Coatings Market Revenue (Million), by Country 2024 & 2032
- Figure 68: South America Anti-Reflective Coatings Market Volume (Kiloton), by Country 2024 & 2032
- Figure 69: South America Anti-Reflective Coatings Market Revenue Share (%), by Country 2024 & 2032
- Figure 70: South America Anti-Reflective Coatings Market Volume Share (%), by Country 2024 & 2032
- Figure 71: Middle East and Africa Anti-Reflective Coatings Market Revenue (Million), by Deposition Method 2024 & 2032
- Figure 72: Middle East and Africa Anti-Reflective Coatings Market Volume (Kiloton), by Deposition Method 2024 & 2032
- Figure 73: Middle East and Africa Anti-Reflective Coatings Market Revenue Share (%), by Deposition Method 2024 & 2032
- Figure 74: Middle East and Africa Anti-Reflective Coatings Market Volume Share (%), by Deposition Method 2024 & 2032
- Figure 75: Middle East and Africa Anti-Reflective Coatings Market Revenue (Million), by Application 2024 & 2032
- Figure 76: Middle East and Africa Anti-Reflective Coatings Market Volume (Kiloton), by Application 2024 & 2032
- Figure 77: Middle East and Africa Anti-Reflective Coatings Market Revenue Share (%), by Application 2024 & 2032
- Figure 78: Middle East and Africa Anti-Reflective Coatings Market Volume Share (%), by Application 2024 & 2032
- Figure 79: Middle East and Africa Anti-Reflective Coatings Market Revenue (Million), by Country 2024 & 2032
- Figure 80: Middle East and Africa Anti-Reflective Coatings Market Volume (Kiloton), by Country 2024 & 2032
- Figure 81: Middle East and Africa Anti-Reflective Coatings Market Revenue Share (%), by Country 2024 & 2032
- Figure 82: Middle East and Africa Anti-Reflective Coatings Market Volume Share (%), by Country 2024 & 2032
List of Tables
- Table 1: Global Anti-Reflective Coatings Market Revenue Million Forecast, by Region 2019 & 2032
- Table 2: Global Anti-Reflective Coatings Market Volume Kiloton Forecast, by Region 2019 & 2032
- Table 3: Global Anti-Reflective Coatings Market Revenue Million Forecast, by Deposition Method 2019 & 2032
- Table 4: Global Anti-Reflective Coatings Market Volume Kiloton Forecast, by Deposition Method 2019 & 2032
- Table 5: Global Anti-Reflective Coatings Market Revenue Million Forecast, by Application 2019 & 2032
- Table 6: Global Anti-Reflective Coatings Market Volume Kiloton Forecast, by Application 2019 & 2032
- Table 7: Global Anti-Reflective Coatings Market Revenue Million Forecast, by Region 2019 & 2032
- Table 8: Global Anti-Reflective Coatings Market Volume Kiloton Forecast, by Region 2019 & 2032
- Table 9: Global Anti-Reflective Coatings Market Revenue Million Forecast, by Country 2019 & 2032
- Table 10: Global Anti-Reflective Coatings Market Volume Kiloton Forecast, by Country 2019 & 2032
- Table 11: China Anti-Reflective Coatings Market Revenue (Million) Forecast, by Application 2019 & 2032
- Table 12: China Anti-Reflective Coatings Market Volume (Kiloton) Forecast, by Application 2019 & 2032
- Table 13: India Anti-Reflective Coatings Market Revenue (Million) Forecast, by Application 2019 & 2032
- Table 14: India Anti-Reflective Coatings Market Volume (Kiloton) Forecast, by Application 2019 & 2032
- Table 15: Japan Anti-Reflective Coatings Market Revenue (Million) Forecast, by Application 2019 & 2032
- Table 16: Japan Anti-Reflective Coatings Market Volume (Kiloton) Forecast, by Application 2019 & 2032
- Table 17: South Korea Anti-Reflective Coatings Market Revenue (Million) Forecast, by Application 2019 & 2032
- Table 18: South Korea Anti-Reflective Coatings Market Volume (Kiloton) Forecast, by Application 2019 & 2032
- Table 19: Rest of Asia Pacific Anti-Reflective Coatings Market Revenue (Million) Forecast, by Application 2019 & 2032
- Table 20: Rest of Asia Pacific Anti-Reflective Coatings Market Volume (Kiloton) Forecast, by Application 2019 & 2032
- Table 21: Global Anti-Reflective Coatings Market Revenue Million Forecast, by Country 2019 & 2032
- Table 22: Global Anti-Reflective Coatings Market Volume Kiloton Forecast, by Country 2019 & 2032
- Table 23: United States Anti-Reflective Coatings Market Revenue (Million) Forecast, by Application 2019 & 2032
- Table 24: United States Anti-Reflective Coatings Market Volume (Kiloton) Forecast, by Application 2019 & 2032
- Table 25: Canada Anti-Reflective Coatings Market Revenue (Million) Forecast, by Application 2019 & 2032
- Table 26: Canada Anti-Reflective Coatings Market Volume (Kiloton) Forecast, by Application 2019 & 2032
- Table 27: Mexico Anti-Reflective Coatings Market Revenue (Million) Forecast, by Application 2019 & 2032
- Table 28: Mexico Anti-Reflective Coatings Market Volume (Kiloton) Forecast, by Application 2019 & 2032
- Table 29: Global Anti-Reflective Coatings Market Revenue Million Forecast, by Country 2019 & 2032
- Table 30: Global Anti-Reflective Coatings Market Volume Kiloton Forecast, by Country 2019 & 2032
- Table 31: Germany Anti-Reflective Coatings Market Revenue (Million) Forecast, by Application 2019 & 2032
- Table 32: Germany Anti-Reflective Coatings Market Volume (Kiloton) Forecast, by Application 2019 & 2032
- Table 33: United Kingdom Anti-Reflective Coatings Market Revenue (Million) Forecast, by Application 2019 & 2032
- Table 34: United Kingdom Anti-Reflective Coatings Market Volume (Kiloton) Forecast, by Application 2019 & 2032
- Table 35: Italy Anti-Reflective Coatings Market Revenue (Million) Forecast, by Application 2019 & 2032
- Table 36: Italy Anti-Reflective Coatings Market Volume (Kiloton) Forecast, by Application 2019 & 2032
- Table 37: France Anti-Reflective Coatings Market Revenue (Million) Forecast, by Application 2019 & 2032
- Table 38: France Anti-Reflective Coatings Market Volume (Kiloton) Forecast, by Application 2019 & 2032
- Table 39: Rest of Europe Anti-Reflective Coatings Market Revenue (Million) Forecast, by Application 2019 & 2032
- Table 40: Rest of Europe Anti-Reflective Coatings Market Volume (Kiloton) Forecast, by Application 2019 & 2032
- Table 41: Global Anti-Reflective Coatings Market Revenue Million Forecast, by Country 2019 & 2032
- Table 42: Global Anti-Reflective Coatings Market Volume Kiloton Forecast, by Country 2019 & 2032
- Table 43: Brazil Anti-Reflective Coatings Market Revenue (Million) Forecast, by Application 2019 & 2032
- Table 44: Brazil Anti-Reflective Coatings Market Volume (Kiloton) Forecast, by Application 2019 & 2032
- Table 45: Argentina Anti-Reflective Coatings Market Revenue (Million) Forecast, by Application 2019 & 2032
- Table 46: Argentina Anti-Reflective Coatings Market Volume (Kiloton) Forecast, by Application 2019 & 2032
- Table 47: Rest of South America Anti-Reflective Coatings Market Revenue (Million) Forecast, by Application 2019 & 2032
- Table 48: Rest of South America Anti-Reflective Coatings Market Volume (Kiloton) Forecast, by Application 2019 & 2032
- Table 49: Global Anti-Reflective Coatings Market Revenue Million Forecast, by Country 2019 & 2032
- Table 50: Global Anti-Reflective Coatings Market Volume Kiloton Forecast, by Country 2019 & 2032
- Table 51: Saudi Arabia Anti-Reflective Coatings Market Revenue (Million) Forecast, by Application 2019 & 2032
- Table 52: Saudi Arabia Anti-Reflective Coatings Market Volume (Kiloton) Forecast, by Application 2019 & 2032
- Table 53: South Africa Anti-Reflective Coatings Market Revenue (Million) Forecast, by Application 2019 & 2032
- Table 54: South Africa Anti-Reflective Coatings Market Volume (Kiloton) Forecast, by Application 2019 & 2032
- Table 55: Rest of Middle East and Africa Anti-Reflective Coatings Market Revenue (Million) Forecast, by Application 2019 & 2032
- Table 56: Rest of Middle East and Africa Anti-Reflective Coatings Market Volume (Kiloton) Forecast, by Application 2019 & 2032
- Table 57: Global Anti-Reflective Coatings Market Revenue Million Forecast, by Deposition Method 2019 & 2032
- Table 58: Global Anti-Reflective Coatings Market Volume Kiloton Forecast, by Deposition Method 2019 & 2032
- Table 59: Global Anti-Reflective Coatings Market Revenue Million Forecast, by Application 2019 & 2032
- Table 60: Global Anti-Reflective Coatings Market Volume Kiloton Forecast, by Application 2019 & 2032
- Table 61: Global Anti-Reflective Coatings Market Revenue Million Forecast, by Country 2019 & 2032
- Table 62: Global Anti-Reflective Coatings Market Volume Kiloton Forecast, by Country 2019 & 2032
- Table 63: China Anti-Reflective Coatings Market Revenue (Million) Forecast, by Application 2019 & 2032
- Table 64: China Anti-Reflective Coatings Market Volume (Kiloton) Forecast, by Application 2019 & 2032
- Table 65: India Anti-Reflective Coatings Market Revenue (Million) Forecast, by Application 2019 & 2032
- Table 66: India Anti-Reflective Coatings Market Volume (Kiloton) Forecast, by Application 2019 & 2032
- Table 67: Japan Anti-Reflective Coatings Market Revenue (Million) Forecast, by Application 2019 & 2032
- Table 68: Japan Anti-Reflective Coatings Market Volume (Kiloton) Forecast, by Application 2019 & 2032
- Table 69: South Korea Anti-Reflective Coatings Market Revenue (Million) Forecast, by Application 2019 & 2032
- Table 70: South Korea Anti-Reflective Coatings Market Volume (Kiloton) Forecast, by Application 2019 & 2032
- Table 71: Malaysia Anti-Reflective Coatings Market Revenue (Million) Forecast, by Application 2019 & 2032
- Table 72: Malaysia Anti-Reflective Coatings Market Volume (Kiloton) Forecast, by Application 2019 & 2032
- Table 73: Thailand Anti-Reflective Coatings Market Revenue (Million) Forecast, by Application 2019 & 2032
- Table 74: Thailand Anti-Reflective Coatings Market Volume (Kiloton) Forecast, by Application 2019 & 2032
- Table 75: Indonesia Anti-Reflective Coatings Market Revenue (Million) Forecast, by Application 2019 & 2032
- Table 76: Indonesia Anti-Reflective Coatings Market Volume (Kiloton) Forecast, by Application 2019 & 2032
- Table 77: Vietnam Anti-Reflective Coatings Market Revenue (Million) Forecast, by Application 2019 & 2032
- Table 78: Vietnam Anti-Reflective Coatings Market Volume (Kiloton) Forecast, by Application 2019 & 2032
- Table 79: Rest of Asia Pacific Anti-Reflective Coatings Market Revenue (Million) Forecast, by Application 2019 & 2032
- Table 80: Rest of Asia Pacific Anti-Reflective Coatings Market Volume (Kiloton) Forecast, by Application 2019 & 2032
- Table 81: Global Anti-Reflective Coatings Market Revenue Million Forecast, by Deposition Method 2019 & 2032
- Table 82: Global Anti-Reflective Coatings Market Volume Kiloton Forecast, by Deposition Method 2019 & 2032
- Table 83: Global Anti-Reflective Coatings Market Revenue Million Forecast, by Application 2019 & 2032
- Table 84: Global Anti-Reflective Coatings Market Volume Kiloton Forecast, by Application 2019 & 2032
- Table 85: Global Anti-Reflective Coatings Market Revenue Million Forecast, by Country 2019 & 2032
- Table 86: Global Anti-Reflective Coatings Market Volume Kiloton Forecast, by Country 2019 & 2032
- Table 87: United States Anti-Reflective Coatings Market Revenue (Million) Forecast, by Application 2019 & 2032
- Table 88: United States Anti-Reflective Coatings Market Volume (Kiloton) Forecast, by Application 2019 & 2032
- Table 89: Canada Anti-Reflective Coatings Market Revenue (Million) Forecast, by Application 2019 & 2032
- Table 90: Canada Anti-Reflective Coatings Market Volume (Kiloton) Forecast, by Application 2019 & 2032
- Table 91: Mexico Anti-Reflective Coatings Market Revenue (Million) Forecast, by Application 2019 & 2032
- Table 92: Mexico Anti-Reflective Coatings Market Volume (Kiloton) Forecast, by Application 2019 & 2032
- Table 93: Global Anti-Reflective Coatings Market Revenue Million Forecast, by Deposition Method 2019 & 2032
- Table 94: Global Anti-Reflective Coatings Market Volume Kiloton Forecast, by Deposition Method 2019 & 2032
- Table 95: Global Anti-Reflective Coatings Market Revenue Million Forecast, by Application 2019 & 2032
- Table 96: Global Anti-Reflective Coatings Market Volume Kiloton Forecast, by Application 2019 & 2032
- Table 97: Global Anti-Reflective Coatings Market Revenue Million Forecast, by Country 2019 & 2032
- Table 98: Global Anti-Reflective Coatings Market Volume Kiloton Forecast, by Country 2019 & 2032
- Table 99: Germany Anti-Reflective Coatings Market Revenue (Million) Forecast, by Application 2019 & 2032
- Table 100: Germany Anti-Reflective Coatings Market Volume (Kiloton) Forecast, by Application 2019 & 2032
- Table 101: United Kingdom Anti-Reflective Coatings Market Revenue (Million) Forecast, by Application 2019 & 2032
- Table 102: United Kingdom Anti-Reflective Coatings Market Volume (Kiloton) Forecast, by Application 2019 & 2032
- Table 103: France Anti-Reflective Coatings Market Revenue (Million) Forecast, by Application 2019 & 2032
- Table 104: France Anti-Reflective Coatings Market Volume (Kiloton) Forecast, by Application 2019 & 2032
- Table 105: Italy Anti-Reflective Coatings Market Revenue (Million) Forecast, by Application 2019 & 2032
- Table 106: Italy Anti-Reflective Coatings Market Volume (Kiloton) Forecast, by Application 2019 & 2032
- Table 107: Spain Anti-Reflective Coatings Market Revenue (Million) Forecast, by Application 2019 & 2032
- Table 108: Spain Anti-Reflective Coatings Market Volume (Kiloton) Forecast, by Application 2019 & 2032
- Table 109: NORDIC countries Anti-Reflective Coatings Market Revenue (Million) Forecast, by Application 2019 & 2032
- Table 110: NORDIC countries Anti-Reflective Coatings Market Volume (Kiloton) Forecast, by Application 2019 & 2032
- Table 111: Turkey Anti-Reflective Coatings Market Revenue (Million) Forecast, by Application 2019 & 2032
- Table 112: Turkey Anti-Reflective Coatings Market Volume (Kiloton) Forecast, by Application 2019 & 2032
- Table 113: Russia Anti-Reflective Coatings Market Revenue (Million) Forecast, by Application 2019 & 2032
- Table 114: Russia Anti-Reflective Coatings Market Volume (Kiloton) Forecast, by Application 2019 & 2032
- Table 115: Rest of Europe Anti-Reflective Coatings Market Revenue (Million) Forecast, by Application 2019 & 2032
- Table 116: Rest of Europe Anti-Reflective Coatings Market Volume (Kiloton) Forecast, by Application 2019 & 2032
- Table 117: Global Anti-Reflective Coatings Market Revenue Million Forecast, by Deposition Method 2019 & 2032
- Table 118: Global Anti-Reflective Coatings Market Volume Kiloton Forecast, by Deposition Method 2019 & 2032
- Table 119: Global Anti-Reflective Coatings Market Revenue Million Forecast, by Application 2019 & 2032
- Table 120: Global Anti-Reflective Coatings Market Volume Kiloton Forecast, by Application 2019 & 2032
- Table 121: Global Anti-Reflective Coatings Market Revenue Million Forecast, by Country 2019 & 2032
- Table 122: Global Anti-Reflective Coatings Market Volume Kiloton Forecast, by Country 2019 & 2032
- Table 123: Brazil Anti-Reflective Coatings Market Revenue (Million) Forecast, by Application 2019 & 2032
- Table 124: Brazil Anti-Reflective Coatings Market Volume (Kiloton) Forecast, by Application 2019 & 2032
- Table 125: Argentina Anti-Reflective Coatings Market Revenue (Million) Forecast, by Application 2019 & 2032
- Table 126: Argentina Anti-Reflective Coatings Market Volume (Kiloton) Forecast, by Application 2019 & 2032
- Table 127: Colombia Anti-Reflective Coatings Market Revenue (Million) Forecast, by Application 2019 & 2032
- Table 128: Colombia Anti-Reflective Coatings Market Volume (Kiloton) Forecast, by Application 2019 & 2032
- Table 129: Rest of South America Anti-Reflective Coatings Market Revenue (Million) Forecast, by Application 2019 & 2032
- Table 130: Rest of South America Anti-Reflective Coatings Market Volume (Kiloton) Forecast, by Application 2019 & 2032
- Table 131: Global Anti-Reflective Coatings Market Revenue Million Forecast, by Deposition Method 2019 & 2032
- Table 132: Global Anti-Reflective Coatings Market Volume Kiloton Forecast, by Deposition Method 2019 & 2032
- Table 133: Global Anti-Reflective Coatings Market Revenue Million Forecast, by Application 2019 & 2032
- Table 134: Global Anti-Reflective Coatings Market Volume Kiloton Forecast, by Application 2019 & 2032
- Table 135: Global Anti-Reflective Coatings Market Revenue Million Forecast, by Country 2019 & 2032
- Table 136: Global Anti-Reflective Coatings Market Volume Kiloton Forecast, by Country 2019 & 2032
- Table 137: Saudi Arabia Anti-Reflective Coatings Market Revenue (Million) Forecast, by Application 2019 & 2032
- Table 138: Saudi Arabia Anti-Reflective Coatings Market Volume (Kiloton) Forecast, by Application 2019 & 2032
- Table 139: Qatar Anti-Reflective Coatings Market Revenue (Million) Forecast, by Application 2019 & 2032
- Table 140: Qatar Anti-Reflective Coatings Market Volume (Kiloton) Forecast, by Application 2019 & 2032
- Table 141: United Arab Emirates Anti-Reflective Coatings Market Revenue (Million) Forecast, by Application 2019 & 2032
- Table 142: United Arab Emirates Anti-Reflective Coatings Market Volume (Kiloton) Forecast, by Application 2019 & 2032
- Table 143: Nigeria Anti-Reflective Coatings Market Revenue (Million) Forecast, by Application 2019 & 2032
- Table 144: Nigeria Anti-Reflective Coatings Market Volume (Kiloton) Forecast, by Application 2019 & 2032
- Table 145: Egypt Anti-Reflective Coatings Market Revenue (Million) Forecast, by Application 2019 & 2032
- Table 146: Egypt Anti-Reflective Coatings Market Volume (Kiloton) Forecast, by Application 2019 & 2032
- Table 147: South Africa Anti-Reflective Coatings Market Revenue (Million) Forecast, by Application 2019 & 2032
- Table 148: South Africa Anti-Reflective Coatings Market Volume (Kiloton) Forecast, by Application 2019 & 2032
- Table 149: Rest of Middle East and Africa Anti-Reflective Coatings Market Revenue (Million) Forecast, by Application 2019 & 2032
- Table 150: Rest of Middle East and Africa Anti-Reflective Coatings Market Volume (Kiloton) Forecast, by Application 2019 & 2032
Frequently Asked Questions
1. What is the projected Compound Annual Growth Rate (CAGR) of the Anti-Reflective Coatings Market?
The projected CAGR is approximately 6.22%.
2. Which companies are prominent players in the Anti-Reflective Coatings Market?
Key companies in the market include Honeywell International Inc, Edmund Optics Inc, Spectrum Direct Ltd, DuPont, Optimum RX Group, Viavi Solutions, Majestic Optical Coatings, HOYA VISION CARE COMPANY (HOYA Corporation), ESSILOR OF AMERICA LLC, EKSMA Optics USB, Optical Coatings Japan, PPG Industries, Rodenstock GmbH, AGC Inc, COCO LENI, Torr Scientific Ltd, Zygo Corporatio, Quantum Coating, AccuCoat Inc, Zeiss International, Evaporated Coatings Inc, Optics Balzers AG.
3. What are the main segments of the Anti-Reflective Coatings Market?
The market segments include Deposition Method, Application.
4. Can you provide details about the market size?
The market size is estimated to be USD 5.30 Million as of 2022.
5. What are some drivers contributing to market growth?
Increasing Demand from Eyewear Applications; Other Drivers.
6. What are the notable trends driving market growth?
Increasing Demand from Eyewear Application.
7. Are there any restraints impacting market growth?
High Cost of Anti-reflective Coatings; Dearth of Awareness.
8. Can you provide examples of recent developments in the market?
February 2022: Zygo Corporation, a company engaged in manufacturing optical metrology and optical component, announced the opening of a new office in Italy, building upon its extensive network of offices and partnerships throughout Europe for expanding its business, including anti-reflective coatings.
9. What pricing options are available for accessing the report?
Pricing options include single-user, multi-user, and enterprise licenses priced at USD 4750, USD 5250, and USD 8750 respectively.
10. Is the market size provided in terms of value or volume?
The market size is provided in terms of value, measured in Million and volume, measured in Kiloton.
11. Are there any specific market keywords associated with the report?
Yes, the market keyword associated with the report is "Anti-Reflective Coatings Market," which aids in identifying and referencing the specific market segment covered.
12. How do I determine which pricing option suits my needs best?
The pricing options vary based on user requirements and access needs. Individual users may opt for single-user licenses, while businesses requiring broader access may choose multi-user or enterprise licenses for cost-effective access to the report.
13. Are there any additional resources or data provided in the Anti-Reflective Coatings Market report?
While the report offers comprehensive insights, it's advisable to review the specific contents or supplementary materials provided to ascertain if additional resources or data are available.
14. How can I stay updated on further developments or reports in the Anti-Reflective Coatings Market?
To stay informed about further developments, trends, and reports in the Anti-Reflective Coatings Market, consider subscribing to industry newsletters, following relevant companies and organizations, or regularly checking reputable industry news sources and publications.
Methodology
Step 1 - Identification of Relevant Samples Size from Population Database


Step 2 - Approaches for Defining Global Market Size (Value, Volume* & Price*)

Note*: In applicable scenarios
Step 3 - Data Sources
Primary Research
- Web Analytics
- Survey Reports
- Research Institute
- Latest Research Reports
- Opinion Leaders
Secondary Research
- Annual Reports
- White Paper
- Latest Press Release
- Industry Association
- Paid Database
- Investor Presentations

Step 4 - Data Triangulation
Involves using different sources of information in order to increase the validity of a study
These sources are likely to be stakeholders in a program - participants, other researchers, program staff, other community members, and so on.
Then we put all data in single framework & apply various statistical tools to find out the dynamic on the market.
During the analysis stage, feedback from the stakeholder groups would be compared to determine areas of agreement as well as areas of divergence


