
Key Insights
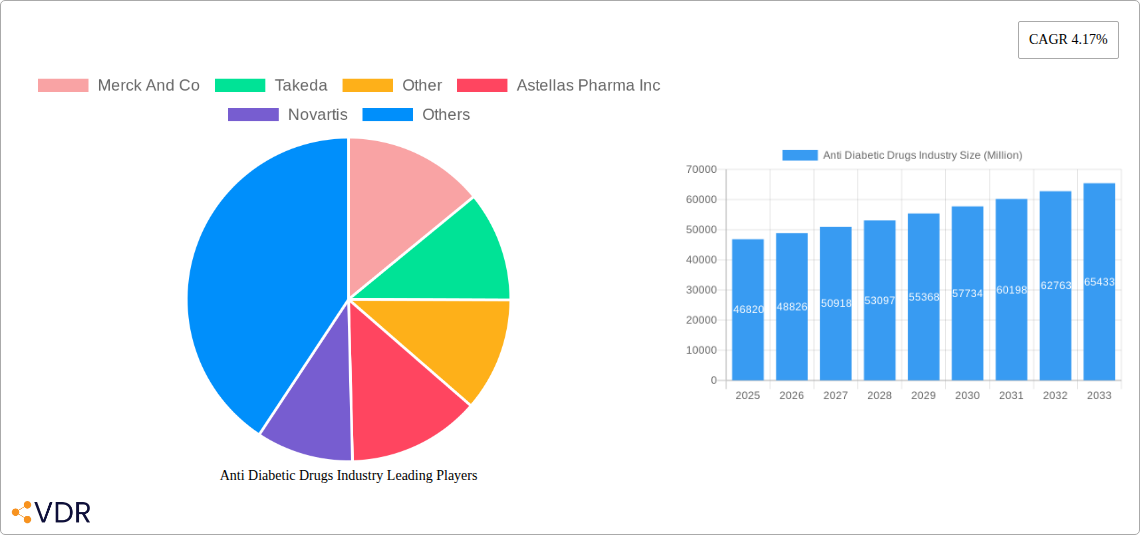
The global anti-diabetic drugs market, valued at $46.82 billion in 2025, is projected to experience robust growth, driven by rising prevalence of type 1 and type 2 diabetes, particularly in developing nations. A compound annual growth rate (CAGR) of 4.17% from 2025 to 2033 indicates a significant market expansion. This growth is fueled by several factors. Increasing awareness of diabetes management and improved access to healthcare, especially in emerging economies like those in Asia-Pacific and Latin America, are major contributors. Furthermore, the continuous innovation in drug development, with novel therapies offering improved efficacy and safety profiles (like SGLT-2 inhibitors and GLP-1 receptor agonists, although not explicitly listed as segments), further fuels market expansion. The market is segmented by drug class, reflecting the diversity of treatment approaches, with each class showing varying growth rates depending on efficacy, safety profiles, and market penetration. Major pharmaceutical companies like Merck, Takeda, Novartis, and others are heavily invested in research and development, and competition among these players is driving innovation and potentially pricing pressures. While potential restraints include side effects associated with certain drug classes and cost-related access issues, the overall market outlook remains positive, driven by the escalating global diabetes epidemic.
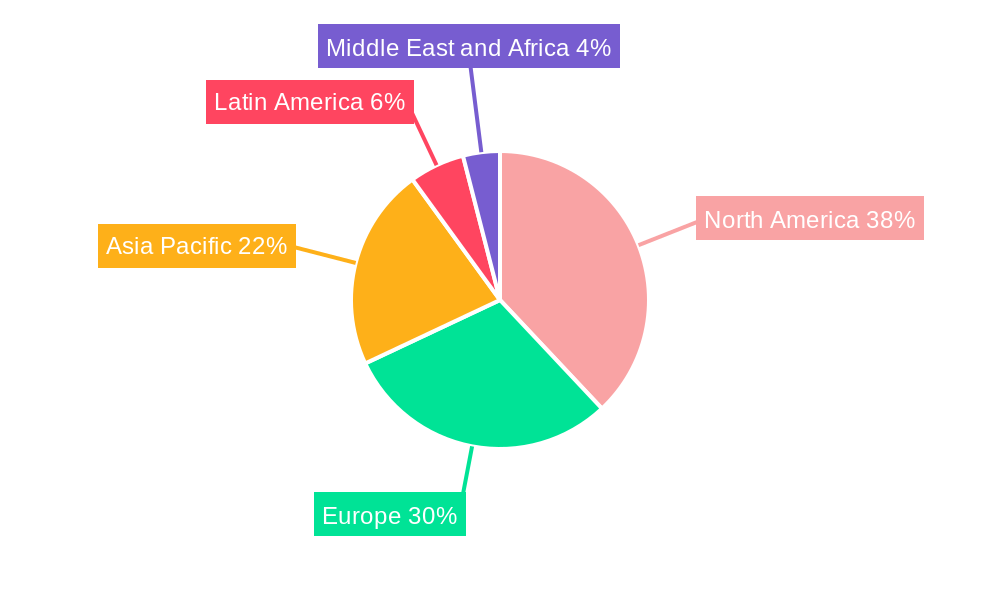
The regional distribution of the market reveals significant variations. North America and Europe currently hold larger market shares due to higher prevalence rates and greater access to advanced medical care. However, the Asia-Pacific region is anticipated to witness the most significant growth in the coming years, given the rapidly increasing diabetic population and expanding healthcare infrastructure in countries like China and India. Latin America and the Middle East and Africa regions are also projected to show substantial growth, albeit at a slower pace, owing to increasing awareness and improved access to healthcare in these regions. The competitive landscape is characterized by the presence of major pharmaceutical companies continually vying for market share through new drug launches, strategic partnerships, and acquisitions. This competitive dynamic further contributes to market dynamism and innovation within the anti-diabetic drug sector.
Anti Diabetic Drugs Industry Market Report: 2019-2033
This comprehensive report provides a detailed analysis of the global Anti Diabetic Drugs market, encompassing market dynamics, growth trends, regional performance, product landscape, and key players. With a study period spanning 2019-2033, a base year of 2025, and a forecast period of 2025-2033, this report offers invaluable insights for industry professionals, investors, and strategic decision-makers. The report analyzes the parent market of pharmaceutical drugs and the child market of anti-diabetic drugs, offering a granular understanding of market segmentation by drug class and region. Market values are presented in million units.
Anti Diabetic Drugs Industry Market Dynamics & Structure
The global anti-diabetic drugs market is characterized by a moderately consolidated structure, with several large pharmaceutical companies holding significant market share. Technological innovation, particularly in the development of novel drug classes like SGLT-2 inhibitors and GLP-1 receptor agonists, is a major driver of growth. Stringent regulatory frameworks governing drug approvals and safety impact market entry and product lifecycles. Competition from existing drugs and emerging therapies, including alternative treatment approaches, influences market dynamics. The market also displays notable M&A activity as larger companies seek to expand their portfolios and gain access to innovative technologies. End-user demographics, primarily encompassing the aging population and increasing prevalence of type 2 diabetes, fuel market expansion.
- Market Concentration: Highly concentrated with top 10 players holding xx% market share in 2024.
- Technological Innovation: Significant R&D investment driving the development of novel therapies, including oral insulin and GLP-1 analogs.
- Regulatory Landscape: Stringent regulatory approvals impacting market entry and product lifecycles.
- Competitive Substitutes: Alternative treatments like lifestyle modifications and bariatric surgery exert competitive pressure.
- M&A Activity: Significant M&A activity observed in recent years, driving consolidation. xx deals recorded between 2019-2024, valued at xx million units.
- End-User Demographics: Aging population and rising prevalence of diabetes are key drivers of market growth.
Anti Diabetic Drugs Industry Growth Trends & Insights
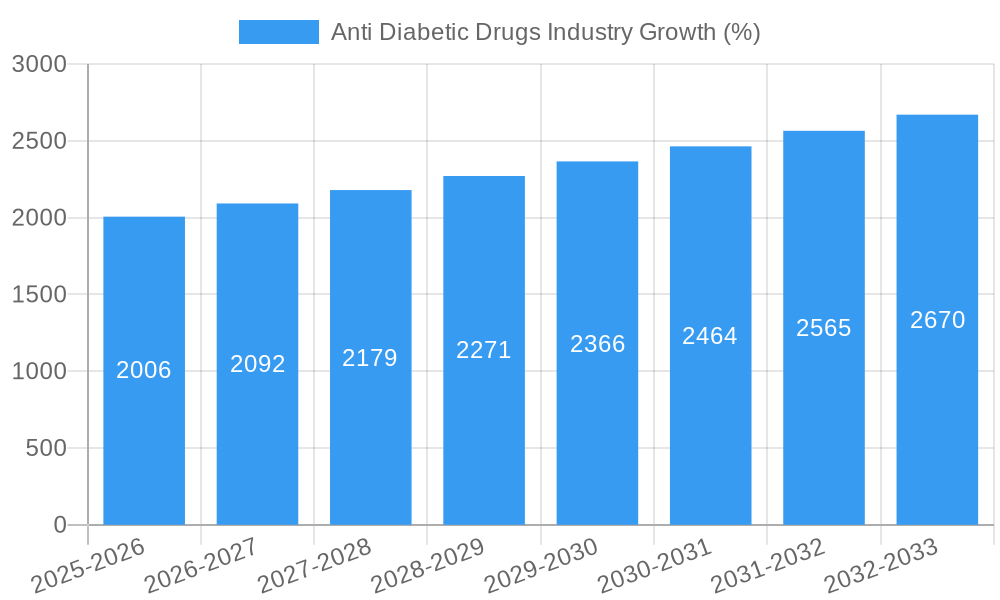
The global anti-diabetic drugs market experienced robust growth during the historical period (2019-2024), driven by increasing prevalence of diabetes, growing awareness, and the introduction of novel therapies. The market size reached xx million units in 2024, exhibiting a CAGR of xx% during this period. Technological disruptions, like the emergence of oral insulin and advanced GLP-1 analogs, are reshaping the treatment landscape. Consumer behavior shifts toward personalized medicine and preference for convenient delivery systems are also influencing market dynamics. The forecast period (2025-2033) projects continued growth, driven by factors like an expanding diabetic population and advancements in drug development. Market penetration of novel therapies is expected to increase significantly, contributing to overall market expansion. The expected CAGR for the forecast period is xx%.
Dominant Regions, Countries, or Segments in Anti Diabetic Drugs Industry
North America currently holds the largest market share, driven by high diabetes prevalence, advanced healthcare infrastructure, and strong pharmaceutical R&D activities. Europe follows as a significant market, exhibiting steady growth due to similar factors. The Asia-Pacific region is experiencing rapid growth due to rising diabetes cases and expanding access to healthcare. However, the relatively lower per capita income in certain countries presents a challenge. Within drug classes, SGLT-2 inhibitors and DPP-4 inhibitors demonstrate the highest growth potential due to their efficacy and safety profiles.
- North America: High prevalence of diabetes, advanced healthcare infrastructure, and strong R&D contribute to market dominance. Market share in 2024: xx%.
- Europe: Steady growth driven by similar factors to North America. Market share in 2024: xx%.
- Asia Pacific: Rapid growth potential driven by increasing prevalence of diabetes, but lower per capita income is a limiting factor. Market share in 2024: xx%.
- Latin America, Middle East, and Africa: These regions are expected to show slower but steady growth, driven by increasing awareness of the disease. Market share in 2024: xx%.
- Drug Class Dominance: SGLT-2 inhibitors and DPP-4 inhibitors exhibit the highest growth rates due to superior efficacy and safety profiles.
Anti Diabetic Drugs Industry Product Landscape
The anti-diabetic drug market encompasses a wide range of products, including insulin, oral hypoglycemics (e.g., metformin, sulfonylureas), and newer classes like SGLT-2 inhibitors and GLP-1 receptor agonists. Recent innovations focus on improving efficacy, safety, and convenience of delivery. Oral insulin capsules represent a significant technological advancement with potential to revolutionize diabetes management. The unique selling propositions of newer therapies emphasize reduced cardiovascular risks and improved glycemic control compared to older-generation drugs. Technological advancements are mainly focused on optimizing drug delivery systems and developing more targeted therapies to minimize side effects.
Key Drivers, Barriers & Challenges in Anti Diabetic Drugs Industry
Key Drivers:
- Rising prevalence of diabetes globally.
- Technological advancements in drug discovery and development.
- Increasing healthcare expenditure and insurance coverage.
- Growing awareness and improved diagnosis rates.
Key Barriers & Challenges:
- High cost of novel therapies limiting affordability and access.
- Stringent regulatory approvals and potential delays in market entry.
- Competition from existing treatments and emerging therapies.
- Supply chain disruptions impacting drug availability. Estimated impact in 2024: xx million units.
Emerging Opportunities in Anti Diabetic Drugs Industry
- Untapped markets in developing countries with high diabetes prevalence.
- Development of personalized medicine approaches tailoring treatment to individual needs.
- Expansion of digital health solutions supporting diabetes management.
- Focus on combination therapies to improve treatment outcomes.
Growth Accelerators in the Anti Diabetic Drugs Industry
The long-term growth of the anti-diabetic drug market is primarily driven by technological breakthroughs that lead to safer and more effective therapies. Strategic partnerships between pharmaceutical companies and technology providers are also key factors. Expansion into emerging markets with high diabetes prevalence further contributes to growth acceleration.
Key Players Shaping the Anti Diabetic Drugs Industry Market
- Merck And Co
- Takeda
- Other
- Astellas Pharma Inc
- Novartis
- Johnson & Johnson (Janssen Pharmaceuticals)
- Eli Lilly and Company
- AstraZeneca
- Bristol Myers Squibb
- Boehringer Ingelheim
- Pfizer
- Sanofi S A
Notable Milestones in Anti Diabetic Drugs Industry Sector
- July 2022: Glenmark Pharmaceuticals Limited launched sitagliptin and its FDCs in India, expanding access to affordable treatment options.
- March 2022: Oramed announced the evaluation of ORMD-0801, a potential game-changer in oral insulin therapy.
In-Depth Anti Diabetic Drugs Industry Market Outlook
The future of the anti-diabetic drugs market is promising, with continued growth driven by technological advancements, expanding markets, and increasing awareness. Strategic partnerships and investments in R&D will further shape the market landscape. The focus will remain on developing more efficacious, safer, and affordable treatment options to cater to the growing number of individuals affected by diabetes worldwide.
Anti Diabetic Drugs Industry Segmentation
-
1. Drugs
-
1.1. Biguanides
- 1.1.1. Metformin
-
1.2. Alpha-glucosidase inhibitors
- 1.2.1. Alpha-glucosidase Inhibitors
-
1.3. Dopamine -D2 Receptor Agonist
- 1.3.1. Bromocriptin (Cycloset)
-
1.4. Sodium-glucose Cotransport -2 (SGLT-2) inhibitor
- 1.4.1. Invokana (Canagliflozin)
- 1.4.2. Jardiance (Empagliflozin)
- 1.4.3. Farxiga/Forxiga (Dapagliflozin)
- 1.4.4. Suglat (Ipragliflozin)
-
1.5. Dipeptidyl Peptidase - 4 (DPP-4) Inhibitors
- 1.5.1. Januvia (Sitagliptin)
- 1.5.2. Onglyza (Saxagliptin)
- 1.5.3. Tradjenta (Linagliptin)
- 1.5.4. Vipidia/Nesina (Alogliptin)
- 1.5.5. Galvus (Vildagliptin)
- 1.6. Sulfonylureas
- 1.7. Meglitinides
-
1.1. Biguanides
Anti Diabetic Drugs Industry Segmentation By Geography
-
1. North America
- 1.1. United States
- 1.2. Canada
- 1.3. Rest of North America
-
2. Europe
- 2.1. France
- 2.2. Germany
- 2.3. Italy
- 2.4. Spain
- 2.5. United Kingdom
- 2.6. Russia
- 2.7. Rest of Europe
-
3. Latin America
- 3.1. Mexico
- 3.2. Brazil
- 3.3. Rest of Latin America
-
4. Asia Pacific
- 4.1. Japan
- 4.2. South Korea
- 4.3. China
- 4.4. India
- 4.5. Australia
- 4.6. Vietnam
- 4.7. Malaysia
- 4.8. Indonesia
- 4.9. Philippines
- 4.10. Thailand
- 4.11. Rest of Asia Pacific
-
5. Middle East and Africa
- 5.1. Saudi Arabia
- 5.2. Iran
- 5.3. Egypt
- 5.4. Oman
- 5.5. South Africa
- 5.6. Rest of Middle East and Africa
Anti Diabetic Drugs Industry REPORT HIGHLIGHTS
| Aspects | Details |
|---|---|
| Study Period | 2019-2033 |
| Base Year | 2024 |
| Estimated Year | 2025 |
| Forecast Period | 2025-2033 |
| Historical Period | 2019-2024 |
| Growth Rate | CAGR of 4.17% from 2019-2033 |
| Segmentation |
|
Table of Contents
- 1. Introduction
- 1.1. Research Scope
- 1.2. Market Segmentation
- 1.3. Research Methodology
- 1.4. Definitions and Assumptions
- 2. Executive Summary
- 2.1. Introduction
- 3. Market Dynamics
- 3.1. Introduction
- 3.2. Market Drivers
- 3.2.1. Rising Prevalence of Chronic Diseases; Technological Advancements
- 3.3. Market Restrains
- 3.3.1. Risk of Needlestick Injuries
- 3.4. Market Trends
- 3.4.1. Biguanide Segment Occupies the Highest Market Share in the Oral Anti-Diabetic Drugs Market in the current year
- 4. Market Factor Analysis
- 4.1. Porters Five Forces
- 4.2. Supply/Value Chain
- 4.3. PESTEL analysis
- 4.4. Market Entropy
- 4.5. Patent/Trademark Analysis
- 5. Global Anti Diabetic Drugs Industry Analysis, Insights and Forecast, 2019-2031
- 5.1. Market Analysis, Insights and Forecast - by Drugs
- 5.1.1. Biguanides
- 5.1.1.1. Metformin
- 5.1.2. Alpha-glucosidase inhibitors
- 5.1.2.1. Alpha-glucosidase Inhibitors
- 5.1.3. Dopamine -D2 Receptor Agonist
- 5.1.3.1. Bromocriptin (Cycloset)
- 5.1.4. Sodium-glucose Cotransport -2 (SGLT-2) inhibitor
- 5.1.4.1. Invokana (Canagliflozin)
- 5.1.4.2. Jardiance (Empagliflozin)
- 5.1.4.3. Farxiga/Forxiga (Dapagliflozin)
- 5.1.4.4. Suglat (Ipragliflozin)
- 5.1.5. Dipeptidyl Peptidase - 4 (DPP-4) Inhibitors
- 5.1.5.1. Januvia (Sitagliptin)
- 5.1.5.2. Onglyza (Saxagliptin)
- 5.1.5.3. Tradjenta (Linagliptin)
- 5.1.5.4. Vipidia/Nesina (Alogliptin)
- 5.1.5.5. Galvus (Vildagliptin)
- 5.1.6. Sulfonylureas
- 5.1.7. Meglitinides
- 5.1.1. Biguanides
- 5.2. Market Analysis, Insights and Forecast - by Region
- 5.2.1. North America
- 5.2.2. Europe
- 5.2.3. Latin America
- 5.2.4. Asia Pacific
- 5.2.5. Middle East and Africa
- 5.1. Market Analysis, Insights and Forecast - by Drugs
- 6. North America Anti Diabetic Drugs Industry Analysis, Insights and Forecast, 2019-2031
- 6.1. Market Analysis, Insights and Forecast - by Drugs
- 6.1.1. Biguanides
- 6.1.1.1. Metformin
- 6.1.2. Alpha-glucosidase inhibitors
- 6.1.2.1. Alpha-glucosidase Inhibitors
- 6.1.3. Dopamine -D2 Receptor Agonist
- 6.1.3.1. Bromocriptin (Cycloset)
- 6.1.4. Sodium-glucose Cotransport -2 (SGLT-2) inhibitor
- 6.1.4.1. Invokana (Canagliflozin)
- 6.1.4.2. Jardiance (Empagliflozin)
- 6.1.4.3. Farxiga/Forxiga (Dapagliflozin)
- 6.1.4.4. Suglat (Ipragliflozin)
- 6.1.5. Dipeptidyl Peptidase - 4 (DPP-4) Inhibitors
- 6.1.5.1. Januvia (Sitagliptin)
- 6.1.5.2. Onglyza (Saxagliptin)
- 6.1.5.3. Tradjenta (Linagliptin)
- 6.1.5.4. Vipidia/Nesina (Alogliptin)
- 6.1.5.5. Galvus (Vildagliptin)
- 6.1.6. Sulfonylureas
- 6.1.7. Meglitinides
- 6.1.1. Biguanides
- 6.1. Market Analysis, Insights and Forecast - by Drugs
- 7. Europe Anti Diabetic Drugs Industry Analysis, Insights and Forecast, 2019-2031
- 7.1. Market Analysis, Insights and Forecast - by Drugs
- 7.1.1. Biguanides
- 7.1.1.1. Metformin
- 7.1.2. Alpha-glucosidase inhibitors
- 7.1.2.1. Alpha-glucosidase Inhibitors
- 7.1.3. Dopamine -D2 Receptor Agonist
- 7.1.3.1. Bromocriptin (Cycloset)
- 7.1.4. Sodium-glucose Cotransport -2 (SGLT-2) inhibitor
- 7.1.4.1. Invokana (Canagliflozin)
- 7.1.4.2. Jardiance (Empagliflozin)
- 7.1.4.3. Farxiga/Forxiga (Dapagliflozin)
- 7.1.4.4. Suglat (Ipragliflozin)
- 7.1.5. Dipeptidyl Peptidase - 4 (DPP-4) Inhibitors
- 7.1.5.1. Januvia (Sitagliptin)
- 7.1.5.2. Onglyza (Saxagliptin)
- 7.1.5.3. Tradjenta (Linagliptin)
- 7.1.5.4. Vipidia/Nesina (Alogliptin)
- 7.1.5.5. Galvus (Vildagliptin)
- 7.1.6. Sulfonylureas
- 7.1.7. Meglitinides
- 7.1.1. Biguanides
- 7.1. Market Analysis, Insights and Forecast - by Drugs
- 8. Latin America Anti Diabetic Drugs Industry Analysis, Insights and Forecast, 2019-2031
- 8.1. Market Analysis, Insights and Forecast - by Drugs
- 8.1.1. Biguanides
- 8.1.1.1. Metformin
- 8.1.2. Alpha-glucosidase inhibitors
- 8.1.2.1. Alpha-glucosidase Inhibitors
- 8.1.3. Dopamine -D2 Receptor Agonist
- 8.1.3.1. Bromocriptin (Cycloset)
- 8.1.4. Sodium-glucose Cotransport -2 (SGLT-2) inhibitor
- 8.1.4.1. Invokana (Canagliflozin)
- 8.1.4.2. Jardiance (Empagliflozin)
- 8.1.4.3. Farxiga/Forxiga (Dapagliflozin)
- 8.1.4.4. Suglat (Ipragliflozin)
- 8.1.5. Dipeptidyl Peptidase - 4 (DPP-4) Inhibitors
- 8.1.5.1. Januvia (Sitagliptin)
- 8.1.5.2. Onglyza (Saxagliptin)
- 8.1.5.3. Tradjenta (Linagliptin)
- 8.1.5.4. Vipidia/Nesina (Alogliptin)
- 8.1.5.5. Galvus (Vildagliptin)
- 8.1.6. Sulfonylureas
- 8.1.7. Meglitinides
- 8.1.1. Biguanides
- 8.1. Market Analysis, Insights and Forecast - by Drugs
- 9. Asia Pacific Anti Diabetic Drugs Industry Analysis, Insights and Forecast, 2019-2031
- 9.1. Market Analysis, Insights and Forecast - by Drugs
- 9.1.1. Biguanides
- 9.1.1.1. Metformin
- 9.1.2. Alpha-glucosidase inhibitors
- 9.1.2.1. Alpha-glucosidase Inhibitors
- 9.1.3. Dopamine -D2 Receptor Agonist
- 9.1.3.1. Bromocriptin (Cycloset)
- 9.1.4. Sodium-glucose Cotransport -2 (SGLT-2) inhibitor
- 9.1.4.1. Invokana (Canagliflozin)
- 9.1.4.2. Jardiance (Empagliflozin)
- 9.1.4.3. Farxiga/Forxiga (Dapagliflozin)
- 9.1.4.4. Suglat (Ipragliflozin)
- 9.1.5. Dipeptidyl Peptidase - 4 (DPP-4) Inhibitors
- 9.1.5.1. Januvia (Sitagliptin)
- 9.1.5.2. Onglyza (Saxagliptin)
- 9.1.5.3. Tradjenta (Linagliptin)
- 9.1.5.4. Vipidia/Nesina (Alogliptin)
- 9.1.5.5. Galvus (Vildagliptin)
- 9.1.6. Sulfonylureas
- 9.1.7. Meglitinides
- 9.1.1. Biguanides
- 9.1. Market Analysis, Insights and Forecast - by Drugs
- 10. Middle East and Africa Anti Diabetic Drugs Industry Analysis, Insights and Forecast, 2019-2031
- 10.1. Market Analysis, Insights and Forecast - by Drugs
- 10.1.1. Biguanides
- 10.1.1.1. Metformin
- 10.1.2. Alpha-glucosidase inhibitors
- 10.1.2.1. Alpha-glucosidase Inhibitors
- 10.1.3. Dopamine -D2 Receptor Agonist
- 10.1.3.1. Bromocriptin (Cycloset)
- 10.1.4. Sodium-glucose Cotransport -2 (SGLT-2) inhibitor
- 10.1.4.1. Invokana (Canagliflozin)
- 10.1.4.2. Jardiance (Empagliflozin)
- 10.1.4.3. Farxiga/Forxiga (Dapagliflozin)
- 10.1.4.4. Suglat (Ipragliflozin)
- 10.1.5. Dipeptidyl Peptidase - 4 (DPP-4) Inhibitors
- 10.1.5.1. Januvia (Sitagliptin)
- 10.1.5.2. Onglyza (Saxagliptin)
- 10.1.5.3. Tradjenta (Linagliptin)
- 10.1.5.4. Vipidia/Nesina (Alogliptin)
- 10.1.5.5. Galvus (Vildagliptin)
- 10.1.6. Sulfonylureas
- 10.1.7. Meglitinides
- 10.1.1. Biguanides
- 10.1. Market Analysis, Insights and Forecast - by Drugs
- 11. North America Anti Diabetic Drugs Industry Analysis, Insights and Forecast, 2019-2031
- 11.1. Market Analysis, Insights and Forecast - By Country/Sub-region
- 11.1.1 United States
- 11.1.2 Canada
- 11.1.3 Mexico
- 12. Europe Anti Diabetic Drugs Industry Analysis, Insights and Forecast, 2019-2031
- 12.1. Market Analysis, Insights and Forecast - By Country/Sub-region
- 12.1.1 Germany
- 12.1.2 United Kingdom
- 12.1.3 France
- 12.1.4 Spain
- 12.1.5 Italy
- 12.1.6 Spain
- 12.1.7 Belgium
- 12.1.8 Netherland
- 12.1.9 Nordics
- 12.1.10 Rest of Europe
- 13. Asia Pacific Anti Diabetic Drugs Industry Analysis, Insights and Forecast, 2019-2031
- 13.1. Market Analysis, Insights and Forecast - By Country/Sub-region
- 13.1.1 China
- 13.1.2 Japan
- 13.1.3 India
- 13.1.4 South Korea
- 13.1.5 Southeast Asia
- 13.1.6 Australia
- 13.1.7 Indonesia
- 13.1.8 Phillipes
- 13.1.9 Singapore
- 13.1.10 Thailandc
- 13.1.11 Rest of Asia Pacific
- 14. South America Anti Diabetic Drugs Industry Analysis, Insights and Forecast, 2019-2031
- 14.1. Market Analysis, Insights and Forecast - By Country/Sub-region
- 14.1.1 Brazil
- 14.1.2 Argentina
- 14.1.3 Peru
- 14.1.4 Chile
- 14.1.5 Colombia
- 14.1.6 Ecuador
- 14.1.7 Venezuela
- 14.1.8 Rest of South America
- 15. MEA Anti Diabetic Drugs Industry Analysis, Insights and Forecast, 2019-2031
- 15.1. Market Analysis, Insights and Forecast - By Country/Sub-region
- 15.1.1 United Arab Emirates
- 15.1.2 Saudi Arabia
- 15.1.3 South Africa
- 15.1.4 Rest of Middle East and Africa
- 16. Competitive Analysis
- 16.1. Global Market Share Analysis 2024
- 16.2. Company Profiles
- 16.2.1 Merck And Co
- 16.2.1.1. Overview
- 16.2.1.2. Products
- 16.2.1.3. SWOT Analysis
- 16.2.1.4. Recent Developments
- 16.2.1.5. Financials (Based on Availability)
- 16.2.2 Takeda
- 16.2.2.1. Overview
- 16.2.2.2. Products
- 16.2.2.3. SWOT Analysis
- 16.2.2.4. Recent Developments
- 16.2.2.5. Financials (Based on Availability)
- 16.2.3 Other
- 16.2.3.1. Overview
- 16.2.3.2. Products
- 16.2.3.3. SWOT Analysis
- 16.2.3.4. Recent Developments
- 16.2.3.5. Financials (Based on Availability)
- 16.2.4 Astellas Pharma Inc
- 16.2.4.1. Overview
- 16.2.4.2. Products
- 16.2.4.3. SWOT Analysis
- 16.2.4.4. Recent Developments
- 16.2.4.5. Financials (Based on Availability)
- 16.2.5 Novartis
- 16.2.5.1. Overview
- 16.2.5.2. Products
- 16.2.5.3. SWOT Analysis
- 16.2.5.4. Recent Developments
- 16.2.5.5. Financials (Based on Availability)
- 16.2.6 Johnson & Johnson (Janssen Pharmaceuticals)
- 16.2.6.1. Overview
- 16.2.6.2. Products
- 16.2.6.3. SWOT Analysis
- 16.2.6.4. Recent Developments
- 16.2.6.5. Financials (Based on Availability)
- 16.2.7 Merck and Co
- 16.2.7.1. Overview
- 16.2.7.2. Products
- 16.2.7.3. SWOT Analysis
- 16.2.7.4. Recent Developments
- 16.2.7.5. Financials (Based on Availability)
- 16.2.8 Eli Lilly and Company
- 16.2.8.1. Overview
- 16.2.8.2. Products
- 16.2.8.3. SWOT Analysis
- 16.2.8.4. Recent Developments
- 16.2.8.5. Financials (Based on Availability)
- 16.2.9 AstraZeneca
- 16.2.9.1. Overview
- 16.2.9.2. Products
- 16.2.9.3. SWOT Analysis
- 16.2.9.4. Recent Developments
- 16.2.9.5. Financials (Based on Availability)
- 16.2.10 Bristol Myers Squibb
- 16.2.10.1. Overview
- 16.2.10.2. Products
- 16.2.10.3. SWOT Analysis
- 16.2.10.4. Recent Developments
- 16.2.10.5. Financials (Based on Availability)
- 16.2.11 Boehringer Ingelheim
- 16.2.11.1. Overview
- 16.2.11.2. Products
- 16.2.11.3. SWOT Analysis
- 16.2.11.4. Recent Developments
- 16.2.11.5. Financials (Based on Availability)
- 16.2.12 Pfizer
- 16.2.12.1. Overview
- 16.2.12.2. Products
- 16.2.12.3. SWOT Analysis
- 16.2.12.4. Recent Developments
- 16.2.12.5. Financials (Based on Availability)
- 16.2.13 Sanofi S A
- 16.2.13.1. Overview
- 16.2.13.2. Products
- 16.2.13.3. SWOT Analysis
- 16.2.13.4. Recent Developments
- 16.2.13.5. Financials (Based on Availability)
- 16.2.1 Merck And Co
List of Figures
- Figure 1: Global Anti Diabetic Drugs Industry Revenue Breakdown (Million, %) by Region 2024 & 2032
- Figure 2: North America Anti Diabetic Drugs Industry Revenue (Million), by Country 2024 & 2032
- Figure 3: North America Anti Diabetic Drugs Industry Revenue Share (%), by Country 2024 & 2032
- Figure 4: Europe Anti Diabetic Drugs Industry Revenue (Million), by Country 2024 & 2032
- Figure 5: Europe Anti Diabetic Drugs Industry Revenue Share (%), by Country 2024 & 2032
- Figure 6: Asia Pacific Anti Diabetic Drugs Industry Revenue (Million), by Country 2024 & 2032
- Figure 7: Asia Pacific Anti Diabetic Drugs Industry Revenue Share (%), by Country 2024 & 2032
- Figure 8: South America Anti Diabetic Drugs Industry Revenue (Million), by Country 2024 & 2032
- Figure 9: South America Anti Diabetic Drugs Industry Revenue Share (%), by Country 2024 & 2032
- Figure 10: MEA Anti Diabetic Drugs Industry Revenue (Million), by Country 2024 & 2032
- Figure 11: MEA Anti Diabetic Drugs Industry Revenue Share (%), by Country 2024 & 2032
- Figure 12: North America Anti Diabetic Drugs Industry Revenue (Million), by Drugs 2024 & 2032
- Figure 13: North America Anti Diabetic Drugs Industry Revenue Share (%), by Drugs 2024 & 2032
- Figure 14: North America Anti Diabetic Drugs Industry Revenue (Million), by Country 2024 & 2032
- Figure 15: North America Anti Diabetic Drugs Industry Revenue Share (%), by Country 2024 & 2032
- Figure 16: Europe Anti Diabetic Drugs Industry Revenue (Million), by Drugs 2024 & 2032
- Figure 17: Europe Anti Diabetic Drugs Industry Revenue Share (%), by Drugs 2024 & 2032
- Figure 18: Europe Anti Diabetic Drugs Industry Revenue (Million), by Country 2024 & 2032
- Figure 19: Europe Anti Diabetic Drugs Industry Revenue Share (%), by Country 2024 & 2032
- Figure 20: Latin America Anti Diabetic Drugs Industry Revenue (Million), by Drugs 2024 & 2032
- Figure 21: Latin America Anti Diabetic Drugs Industry Revenue Share (%), by Drugs 2024 & 2032
- Figure 22: Latin America Anti Diabetic Drugs Industry Revenue (Million), by Country 2024 & 2032
- Figure 23: Latin America Anti Diabetic Drugs Industry Revenue Share (%), by Country 2024 & 2032
- Figure 24: Asia Pacific Anti Diabetic Drugs Industry Revenue (Million), by Drugs 2024 & 2032
- Figure 25: Asia Pacific Anti Diabetic Drugs Industry Revenue Share (%), by Drugs 2024 & 2032
- Figure 26: Asia Pacific Anti Diabetic Drugs Industry Revenue (Million), by Country 2024 & 2032
- Figure 27: Asia Pacific Anti Diabetic Drugs Industry Revenue Share (%), by Country 2024 & 2032
- Figure 28: Middle East and Africa Anti Diabetic Drugs Industry Revenue (Million), by Drugs 2024 & 2032
- Figure 29: Middle East and Africa Anti Diabetic Drugs Industry Revenue Share (%), by Drugs 2024 & 2032
- Figure 30: Middle East and Africa Anti Diabetic Drugs Industry Revenue (Million), by Country 2024 & 2032
- Figure 31: Middle East and Africa Anti Diabetic Drugs Industry Revenue Share (%), by Country 2024 & 2032
List of Tables
- Table 1: Global Anti Diabetic Drugs Industry Revenue Million Forecast, by Region 2019 & 2032
- Table 2: Global Anti Diabetic Drugs Industry Revenue Million Forecast, by Drugs 2019 & 2032
- Table 3: Global Anti Diabetic Drugs Industry Revenue Million Forecast, by Region 2019 & 2032
- Table 4: Global Anti Diabetic Drugs Industry Revenue Million Forecast, by Country 2019 & 2032
- Table 5: United States Anti Diabetic Drugs Industry Revenue (Million) Forecast, by Application 2019 & 2032
- Table 6: Canada Anti Diabetic Drugs Industry Revenue (Million) Forecast, by Application 2019 & 2032
- Table 7: Mexico Anti Diabetic Drugs Industry Revenue (Million) Forecast, by Application 2019 & 2032
- Table 8: Global Anti Diabetic Drugs Industry Revenue Million Forecast, by Country 2019 & 2032
- Table 9: Germany Anti Diabetic Drugs Industry Revenue (Million) Forecast, by Application 2019 & 2032
- Table 10: United Kingdom Anti Diabetic Drugs Industry Revenue (Million) Forecast, by Application 2019 & 2032
- Table 11: France Anti Diabetic Drugs Industry Revenue (Million) Forecast, by Application 2019 & 2032
- Table 12: Spain Anti Diabetic Drugs Industry Revenue (Million) Forecast, by Application 2019 & 2032
- Table 13: Italy Anti Diabetic Drugs Industry Revenue (Million) Forecast, by Application 2019 & 2032
- Table 14: Spain Anti Diabetic Drugs Industry Revenue (Million) Forecast, by Application 2019 & 2032
- Table 15: Belgium Anti Diabetic Drugs Industry Revenue (Million) Forecast, by Application 2019 & 2032
- Table 16: Netherland Anti Diabetic Drugs Industry Revenue (Million) Forecast, by Application 2019 & 2032
- Table 17: Nordics Anti Diabetic Drugs Industry Revenue (Million) Forecast, by Application 2019 & 2032
- Table 18: Rest of Europe Anti Diabetic Drugs Industry Revenue (Million) Forecast, by Application 2019 & 2032
- Table 19: Global Anti Diabetic Drugs Industry Revenue Million Forecast, by Country 2019 & 2032
- Table 20: China Anti Diabetic Drugs Industry Revenue (Million) Forecast, by Application 2019 & 2032
- Table 21: Japan Anti Diabetic Drugs Industry Revenue (Million) Forecast, by Application 2019 & 2032
- Table 22: India Anti Diabetic Drugs Industry Revenue (Million) Forecast, by Application 2019 & 2032
- Table 23: South Korea Anti Diabetic Drugs Industry Revenue (Million) Forecast, by Application 2019 & 2032
- Table 24: Southeast Asia Anti Diabetic Drugs Industry Revenue (Million) Forecast, by Application 2019 & 2032
- Table 25: Australia Anti Diabetic Drugs Industry Revenue (Million) Forecast, by Application 2019 & 2032
- Table 26: Indonesia Anti Diabetic Drugs Industry Revenue (Million) Forecast, by Application 2019 & 2032
- Table 27: Phillipes Anti Diabetic Drugs Industry Revenue (Million) Forecast, by Application 2019 & 2032
- Table 28: Singapore Anti Diabetic Drugs Industry Revenue (Million) Forecast, by Application 2019 & 2032
- Table 29: Thailandc Anti Diabetic Drugs Industry Revenue (Million) Forecast, by Application 2019 & 2032
- Table 30: Rest of Asia Pacific Anti Diabetic Drugs Industry Revenue (Million) Forecast, by Application 2019 & 2032
- Table 31: Global Anti Diabetic Drugs Industry Revenue Million Forecast, by Country 2019 & 2032
- Table 32: Brazil Anti Diabetic Drugs Industry Revenue (Million) Forecast, by Application 2019 & 2032
- Table 33: Argentina Anti Diabetic Drugs Industry Revenue (Million) Forecast, by Application 2019 & 2032
- Table 34: Peru Anti Diabetic Drugs Industry Revenue (Million) Forecast, by Application 2019 & 2032
- Table 35: Chile Anti Diabetic Drugs Industry Revenue (Million) Forecast, by Application 2019 & 2032
- Table 36: Colombia Anti Diabetic Drugs Industry Revenue (Million) Forecast, by Application 2019 & 2032
- Table 37: Ecuador Anti Diabetic Drugs Industry Revenue (Million) Forecast, by Application 2019 & 2032
- Table 38: Venezuela Anti Diabetic Drugs Industry Revenue (Million) Forecast, by Application 2019 & 2032
- Table 39: Rest of South America Anti Diabetic Drugs Industry Revenue (Million) Forecast, by Application 2019 & 2032
- Table 40: Global Anti Diabetic Drugs Industry Revenue Million Forecast, by Country 2019 & 2032
- Table 41: United Arab Emirates Anti Diabetic Drugs Industry Revenue (Million) Forecast, by Application 2019 & 2032
- Table 42: Saudi Arabia Anti Diabetic Drugs Industry Revenue (Million) Forecast, by Application 2019 & 2032
- Table 43: South Africa Anti Diabetic Drugs Industry Revenue (Million) Forecast, by Application 2019 & 2032
- Table 44: Rest of Middle East and Africa Anti Diabetic Drugs Industry Revenue (Million) Forecast, by Application 2019 & 2032
- Table 45: Global Anti Diabetic Drugs Industry Revenue Million Forecast, by Drugs 2019 & 2032
- Table 46: Global Anti Diabetic Drugs Industry Revenue Million Forecast, by Country 2019 & 2032
- Table 47: United States Anti Diabetic Drugs Industry Revenue (Million) Forecast, by Application 2019 & 2032
- Table 48: Canada Anti Diabetic Drugs Industry Revenue (Million) Forecast, by Application 2019 & 2032
- Table 49: Rest of North America Anti Diabetic Drugs Industry Revenue (Million) Forecast, by Application 2019 & 2032
- Table 50: Global Anti Diabetic Drugs Industry Revenue Million Forecast, by Drugs 2019 & 2032
- Table 51: Global Anti Diabetic Drugs Industry Revenue Million Forecast, by Country 2019 & 2032
- Table 52: France Anti Diabetic Drugs Industry Revenue (Million) Forecast, by Application 2019 & 2032
- Table 53: Germany Anti Diabetic Drugs Industry Revenue (Million) Forecast, by Application 2019 & 2032
- Table 54: Italy Anti Diabetic Drugs Industry Revenue (Million) Forecast, by Application 2019 & 2032
- Table 55: Spain Anti Diabetic Drugs Industry Revenue (Million) Forecast, by Application 2019 & 2032
- Table 56: United Kingdom Anti Diabetic Drugs Industry Revenue (Million) Forecast, by Application 2019 & 2032
- Table 57: Russia Anti Diabetic Drugs Industry Revenue (Million) Forecast, by Application 2019 & 2032
- Table 58: Rest of Europe Anti Diabetic Drugs Industry Revenue (Million) Forecast, by Application 2019 & 2032
- Table 59: Global Anti Diabetic Drugs Industry Revenue Million Forecast, by Drugs 2019 & 2032
- Table 60: Global Anti Diabetic Drugs Industry Revenue Million Forecast, by Country 2019 & 2032
- Table 61: Mexico Anti Diabetic Drugs Industry Revenue (Million) Forecast, by Application 2019 & 2032
- Table 62: Brazil Anti Diabetic Drugs Industry Revenue (Million) Forecast, by Application 2019 & 2032
- Table 63: Rest of Latin America Anti Diabetic Drugs Industry Revenue (Million) Forecast, by Application 2019 & 2032
- Table 64: Global Anti Diabetic Drugs Industry Revenue Million Forecast, by Drugs 2019 & 2032
- Table 65: Global Anti Diabetic Drugs Industry Revenue Million Forecast, by Country 2019 & 2032
- Table 66: Japan Anti Diabetic Drugs Industry Revenue (Million) Forecast, by Application 2019 & 2032
- Table 67: South Korea Anti Diabetic Drugs Industry Revenue (Million) Forecast, by Application 2019 & 2032
- Table 68: China Anti Diabetic Drugs Industry Revenue (Million) Forecast, by Application 2019 & 2032
- Table 69: India Anti Diabetic Drugs Industry Revenue (Million) Forecast, by Application 2019 & 2032
- Table 70: Australia Anti Diabetic Drugs Industry Revenue (Million) Forecast, by Application 2019 & 2032
- Table 71: Vietnam Anti Diabetic Drugs Industry Revenue (Million) Forecast, by Application 2019 & 2032
- Table 72: Malaysia Anti Diabetic Drugs Industry Revenue (Million) Forecast, by Application 2019 & 2032
- Table 73: Indonesia Anti Diabetic Drugs Industry Revenue (Million) Forecast, by Application 2019 & 2032
- Table 74: Philippines Anti Diabetic Drugs Industry Revenue (Million) Forecast, by Application 2019 & 2032
- Table 75: Thailand Anti Diabetic Drugs Industry Revenue (Million) Forecast, by Application 2019 & 2032
- Table 76: Rest of Asia Pacific Anti Diabetic Drugs Industry Revenue (Million) Forecast, by Application 2019 & 2032
- Table 77: Global Anti Diabetic Drugs Industry Revenue Million Forecast, by Drugs 2019 & 2032
- Table 78: Global Anti Diabetic Drugs Industry Revenue Million Forecast, by Country 2019 & 2032
- Table 79: Saudi Arabia Anti Diabetic Drugs Industry Revenue (Million) Forecast, by Application 2019 & 2032
- Table 80: Iran Anti Diabetic Drugs Industry Revenue (Million) Forecast, by Application 2019 & 2032
- Table 81: Egypt Anti Diabetic Drugs Industry Revenue (Million) Forecast, by Application 2019 & 2032
- Table 82: Oman Anti Diabetic Drugs Industry Revenue (Million) Forecast, by Application 2019 & 2032
- Table 83: South Africa Anti Diabetic Drugs Industry Revenue (Million) Forecast, by Application 2019 & 2032
- Table 84: Rest of Middle East and Africa Anti Diabetic Drugs Industry Revenue (Million) Forecast, by Application 2019 & 2032
Frequently Asked Questions
1. What is the projected Compound Annual Growth Rate (CAGR) of the Anti Diabetic Drugs Industry?
The projected CAGR is approximately 4.17%.
2. Which companies are prominent players in the Anti Diabetic Drugs Industry?
Key companies in the market include Merck And Co, Takeda, Other, Astellas Pharma Inc, Novartis, Johnson & Johnson (Janssen Pharmaceuticals), Merck and Co, Eli Lilly and Company, AstraZeneca, Bristol Myers Squibb, Boehringer Ingelheim, Pfizer, Sanofi S A.
3. What are the main segments of the Anti Diabetic Drugs Industry?
The market segments include Drugs.
4. Can you provide details about the market size?
The market size is estimated to be USD 46.82 Million as of 2022.
5. What are some drivers contributing to market growth?
Rising Prevalence of Chronic Diseases; Technological Advancements.
6. What are the notable trends driving market growth?
Biguanide Segment Occupies the Highest Market Share in the Oral Anti-Diabetic Drugs Market in the current year.
7. Are there any restraints impacting market growth?
Risk of Needlestick Injuries.
8. Can you provide examples of recent developments in the market?
July 2022: Glenmark Pharmaceuticals Limited announced that it had launched sitagliptin and its Fixed Dose Combinations (FDCs) for adults with Type 2 diabetes in India. Glenmark introduced 8 different combinations of sitagliptin-based drugs under the brand name SITAZIT and its variants at an affordable price.
9. What pricing options are available for accessing the report?
Pricing options include single-user, multi-user, and enterprise licenses priced at USD 4750, USD 5250, and USD 8750 respectively.
10. Is the market size provided in terms of value or volume?
The market size is provided in terms of value, measured in Million.
11. Are there any specific market keywords associated with the report?
Yes, the market keyword associated with the report is "Anti Diabetic Drugs Industry," which aids in identifying and referencing the specific market segment covered.
12. How do I determine which pricing option suits my needs best?
The pricing options vary based on user requirements and access needs. Individual users may opt for single-user licenses, while businesses requiring broader access may choose multi-user or enterprise licenses for cost-effective access to the report.
13. Are there any additional resources or data provided in the Anti Diabetic Drugs Industry report?
While the report offers comprehensive insights, it's advisable to review the specific contents or supplementary materials provided to ascertain if additional resources or data are available.
14. How can I stay updated on further developments or reports in the Anti Diabetic Drugs Industry?
To stay informed about further developments, trends, and reports in the Anti Diabetic Drugs Industry, consider subscribing to industry newsletters, following relevant companies and organizations, or regularly checking reputable industry news sources and publications.
Methodology
Step 1 - Identification of Relevant Samples Size from Population Database


Step 2 - Approaches for Defining Global Market Size (Value, Volume* & Price*)

Note*: In applicable scenarios
Step 3 - Data Sources
Primary Research
- Web Analytics
- Survey Reports
- Research Institute
- Latest Research Reports
- Opinion Leaders
Secondary Research
- Annual Reports
- White Paper
- Latest Press Release
- Industry Association
- Paid Database
- Investor Presentations

Step 4 - Data Triangulation
Involves using different sources of information in order to increase the validity of a study
These sources are likely to be stakeholders in a program - participants, other researchers, program staff, other community members, and so on.
Then we put all data in single framework & apply various statistical tools to find out the dynamic on the market.
During the analysis stage, feedback from the stakeholder groups would be compared to determine areas of agreement as well as areas of divergence


