

Key Insights
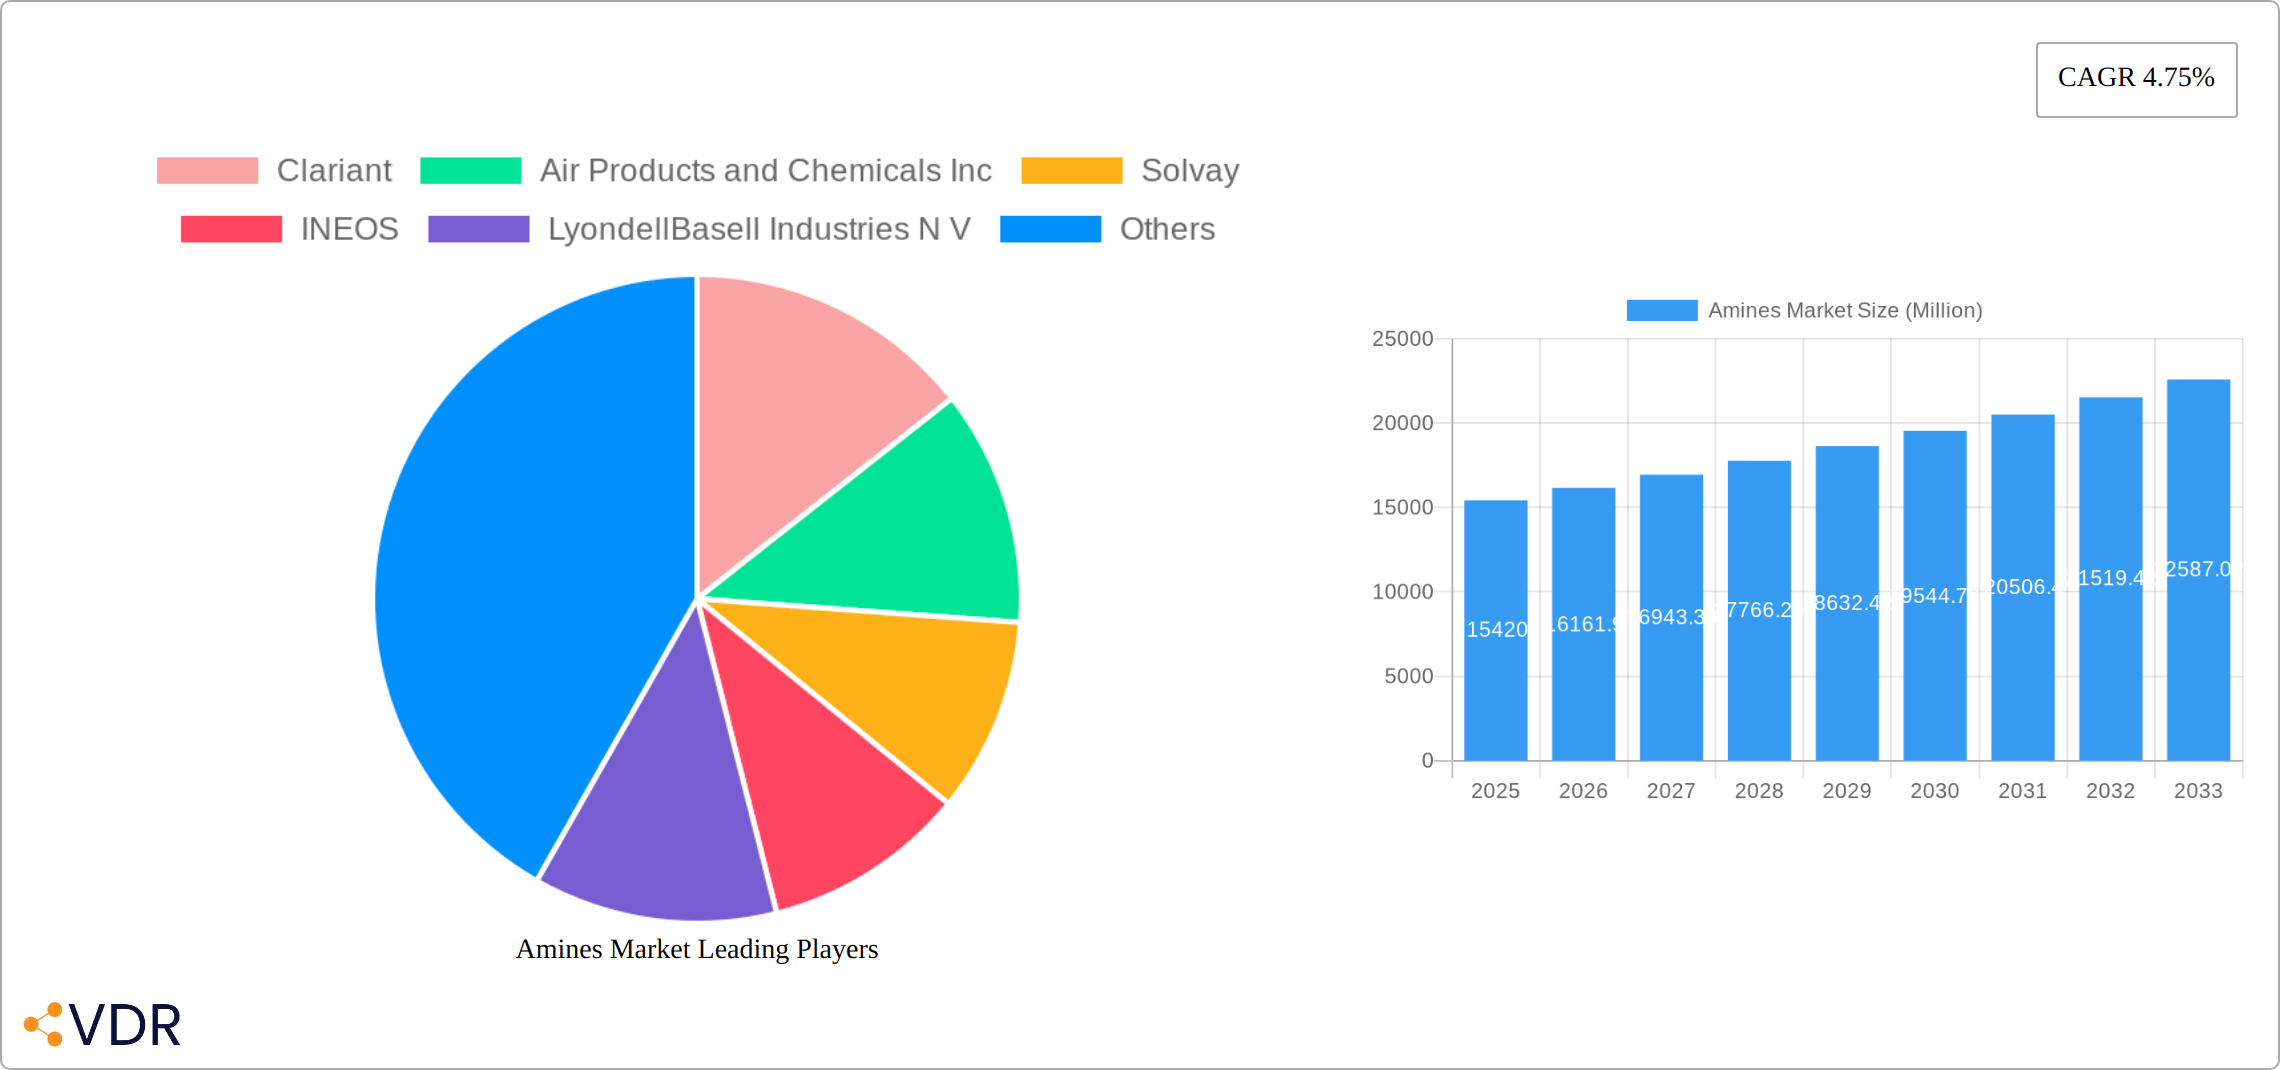
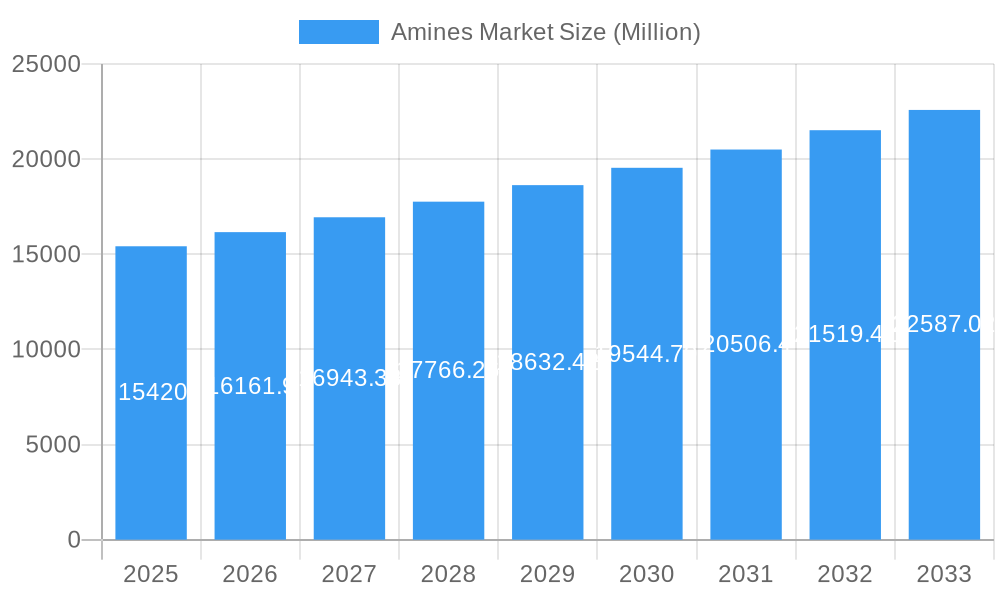
The global amines market, valued at $15.42 billion in 2025, is projected to experience robust growth, driven by a compound annual growth rate (CAGR) of 4.75% from 2025 to 2033. This expansion is fueled by several key factors. The increasing demand for amines in various end-use industries, such as personal care, cleaning products, and agrochemicals, is a primary driver. The rising global population and increasing disposable incomes in developing economies are further boosting demand for these products. Technological advancements leading to the development of more efficient and sustainable amine production processes contribute to market growth. Specifically, the growing adoption of bio-based amines is expected to significantly impact the market in the coming years, driven by rising concerns regarding environmental sustainability and the search for renewable alternatives. The market is segmented by type (ethyleneamines, alkylamines, fatty amines, specialty amines, ethanolamines) and end-use (rubber, personal care, cleaning products, adhesives, paints and resins, agrochemicals, oil and petrochemicals, and others). The Asia-Pacific region, particularly China and India, is expected to dominate the market due to rapid industrialization and increasing consumption in these regions.
Amines Market Market Size (In Billion)
Competition within the amines market is intense, with numerous major players vying for market share. Key companies such as Clariant, Air Products and Chemicals Inc., Solvay, INEOS, and BASF SE hold significant market positions. These companies are engaged in strategies focused on product innovation, expansion into new markets, and strategic partnerships to maintain their competitive edge. However, potential restraints include fluctuating raw material prices and stringent environmental regulations. Navigating these challenges requires ongoing innovation and a commitment to sustainable practices. The market's future growth trajectory will likely be shaped by the successful integration of eco-friendly production methods, meeting evolving regulatory standards, and catering to the demands of a growing and increasingly discerning consumer base.
Amines Market Company Market Share
Amines Market: A Comprehensive Market Report (2019-2033)
This comprehensive report provides an in-depth analysis of the Amines Market, encompassing market dynamics, growth trends, regional analysis, product landscape, and key players. The report covers the period from 2019 to 2033, with a focus on the forecast period 2025-2033 and a base year of 2025. The total market size is projected to reach xx Million units by 2033. This report is an essential resource for industry professionals, investors, and anyone seeking to understand this dynamic market.
Amines Market Dynamics & Structure
The Amines Market is characterized by a moderately consolidated structure, with several major players holding significant market share. Technological innovation, particularly in sustainable amine production, is a key driver, while stringent regulatory frameworks concerning environmental impact influence market strategies. Competitive product substitutes, such as alternative chemicals in specific applications, pose a challenge. End-user demographics are diverse, ranging from the rubber industry to personal care, influencing demand variations across segments. M&A activity has been relatively moderate in recent years, with a focus on strategic acquisitions to expand product portfolios and geographic reach. The global market share of the top five players is estimated at 45% in 2025.
- Market Concentration: Moderately consolidated, with top 5 players holding approximately 45% market share (2025).
- Technological Innovation: Focus on sustainable and high-performance amine production.
- Regulatory Framework: Stringent environmental regulations impacting manufacturing processes.
- Competitive Substitutes: Alternative chemicals present in specific niche applications.
- M&A Activity: Moderate activity focused on strategic expansion.
- Innovation Barriers: High R&D costs and complex regulatory approvals.
Amines Market Growth Trends & Insights
The Amines Market is experiencing steady growth, driven by increasing demand across various end-use industries. The market size has grown significantly from xx Million units in 2019 to xx Million units in 2024, exhibiting a CAGR of xx% during this period. This growth is expected to continue, with a projected CAGR of xx% during 2025-2033, reaching xx Million units by 2033. The adoption rate of amines in new applications is further fueling this growth. Technological disruptions, particularly advancements in production processes and novel amine formulations, are also driving market expansion. Shifting consumer preferences towards sustainable and eco-friendly products are impacting demand for greener amine alternatives.
Dominant Regions, Countries, or Segments in Amines Market
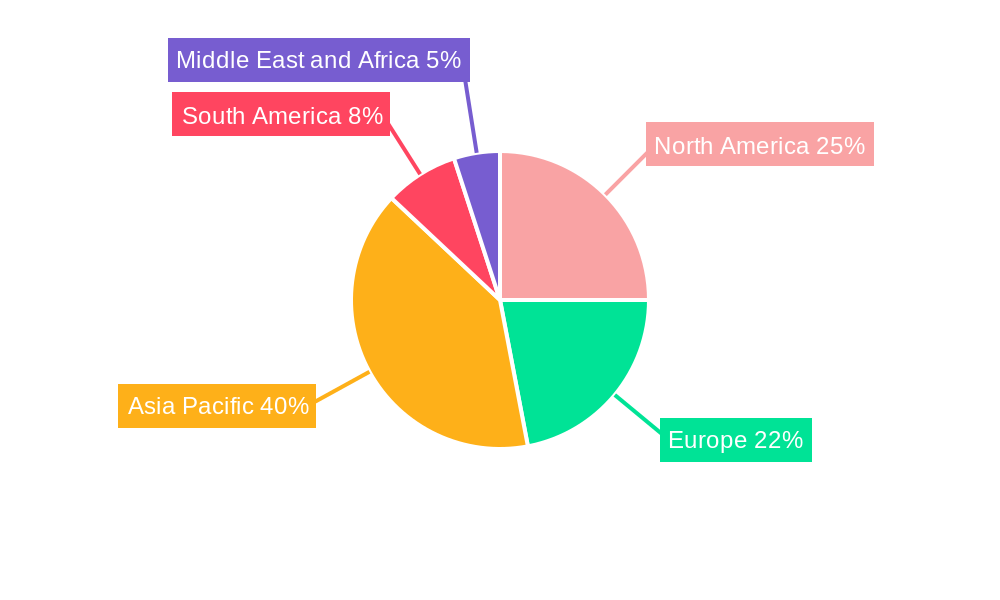
The Asia-Pacific region reigns supreme in the amines market, fueled by robust economic growth, rapid industrialization, and the expansion of downstream industries, particularly within China and India. Ethyleneamines and alkylamines dominate the product segments, commanding the largest market share due to their diverse applications across numerous sectors. High-growth potential is evident in end-use segments such as rubber manufacturing, personal care product formulation, and agrochemical production. North America and Europe represent mature markets characterized by stable growth, driven by ongoing technological advancements and a growing emphasis on sustainable and environmentally friendly solutions. Specific countries experiencing significant growth include India, China, and several Southeast Asian nations experiencing rapid industrialization.
- Asia-Pacific Leadership: China and India lead the way, driven by substantial economic expansion and industrial growth. Southeast Asia is also a significant contributor.
- Key Product Segments: Ethyleneamines and alkylamines hold the dominant market share due to widespread applications. Specific niche amines are also demonstrating strong growth in specialized markets.
- High-Growth End-Use Sectors: The rubber industry, personal care products, and agrochemicals are experiencing particularly strong demand for amines.
- North America & Europe: Mature markets showcasing stable growth, focused on innovation and sustainable practices. Increased regulatory scrutiny is driving the adoption of more eco-friendly processes and products.
Amines Market Product Landscape
The Amines Market exhibits a diverse product landscape, with ongoing innovation in amine types and formulations. Recent advancements have focused on developing high-performance amines with enhanced properties, such as improved reactivity, stability, and biodegradability. New applications are continually emerging, driven by technological advancements in various sectors, creating opportunities for specialized amine products. The unique selling propositions of many amines often lie in their specific chemical properties tailoring them to particular applications.
Key Drivers, Barriers & Challenges in Amines Market
Key Drivers:
- Booming End-Use Demand: Expanding applications across diverse industries, particularly in developing economies, fuel market growth.
- Technological Innovation: Advancements in amine production and formulation are leading to more efficient and sustainable processes.
- Sustainability Focus: The increasing demand for eco-friendly alternatives is driving innovation and market expansion in bio-based and sustainable amine solutions.
- Government Initiatives: Supportive government policies and investments in infrastructure in key regions are fostering market expansion.
Challenges & Restraints:
- Raw Material Price Volatility: Fluctuations in the cost of raw materials pose a significant challenge to profitability.
- Stringent Environmental Regulations: Compliance with increasingly stringent environmental regulations adds to manufacturing costs and complexity.
- Intense Competition: The market is characterized by intense competition among established players and new entrants, leading to pressure on profit margins. This pressure is projected to reduce profit margins by approximately 2% by 2030.
Emerging Opportunities in Amines Market
- Growing demand for bio-based and biodegradable amines.
- Expansion into new and emerging applications in sectors like renewable energy.
- Focus on developing high-performance amines for specialized applications.
Growth Accelerators in the Amines Market Industry
Technological breakthroughs in production processes, coupled with strategic partnerships to expand market reach, are key growth accelerators. Focus on developing innovative amine applications in high-growth sectors, along with expanding into untapped markets, further propel market expansion.
Key Players Shaping the Amines Market Market
- Clariant
- Air Products and Chemicals Inc
- Solvay
- INEOS
- LyondellBasell Industries N V
- Celanese Corporation
- Alkyl Amines Chemicals Limited
- INVISTA
- Kemipex
- BASF SE
- Arkema Group
- Huntsman International LLC
- SABIC
- Akzo Nobel N V
- Daicel Corporation
- Mitsubishi Gas Chemical Company Inc
- DowDuPont
- Tosoh Corporation
- *List Not Exhaustive
Notable Milestones in Amines Market Sector
- July 2022: LyondellBasell announced a significant expansion of its amine production facility in China, signaling a commitment to the growing Asian market.
- March 2023: Solvay's launch of a new range of sustainable amine products highlights the growing importance of eco-friendly solutions within the industry.
- [Add another recent milestone here with date and brief description]
In-Depth Amines Market Market Outlook
The amines market is projected to experience sustained growth, driven by increasing demand across various applications and continuous technological advancements. Strategic partnerships, a focus on developing and implementing sustainable practices, and expansion into new and emerging markets are key opportunities for market participants. This presents attractive prospects for investment and further expansion within the sector. The market is expected to witness substantial growth in the coming years, fueled by innovation and adaptation to changing market demands and regulatory landscapes.
Amines Market Segmentation
-
1. Type
- 1.1. Ethyleneamines
- 1.2. Alkylamines
- 1.3. Fatty Amines
- 1.4. Specialty Amines
- 1.5. Ethanolamines
-
2. End-use
- 2.1. Rubber
- 2.2. Personal Care products
- 2.3. Cleaning Products
- 2.4. Adhesives, Paints, and Resins
- 2.5. Agro Chemicals
- 2.6. Oil and Petrochemical
- 2.7. Other End-uses
Amines Market Segmentation By Geography
-
1. Asia Pacific
- 1.1. China
- 1.2. India
- 1.3. Japan
- 1.4. South Korea
- 1.5. Australia and New Zealand
- 1.6. Rest of Asia Pacific
-
2. North America
- 2.1. United States
- 2.2. Canada
- 2.3. Mexico
-
3. Europe
- 3.1. Germany
- 3.2. United Kingdom
- 3.3. Italy
- 3.4. France
- 3.5. Rest of Europe
-
4. South America
- 4.1. Brazil
- 4.2. Argentina
- 4.3. Rest of South America
-
5. Middle East and Africa
- 5.1. Saudi Arabia
- 5.2. South Africa
- 5.3. Rest of Middle East and Africa
Amines Market Regional Market Share
Geographic Coverage of Amines Market
Amines Market REPORT HIGHLIGHTS
| Aspects | Details |
|---|---|
| Study Period | 2020-2034 |
| Base Year | 2025 |
| Estimated Year | 2026 |
| Forecast Period | 2026-2034 |
| Historical Period | 2020-2025 |
| Growth Rate | CAGR of 4.75% from 2020-2034 |
| Segmentation |
|
Table of Contents
- 1. Introduction
- 1.1. Research Scope
- 1.2. Market Segmentation
- 1.3. Research Methodology
- 1.4. Definitions and Assumptions
- 2. Executive Summary
- 2.1. Introduction
- 3. Market Dynamics
- 3.1. Introduction
- 3.2. Market Drivers
- 3.2.1. ; Growing Demand for Personal Care Products from Asia-Pacific; Accelerating Demand for Pesticides from Developing Countries; Increasing Demand and Usage in Construction Sector
- 3.3. Market Restrains
- 3.3.1. ; Rising Consumption of Wood-free Products; Increasing Usage of Bio-Based Products for Agriculture in Developed Countries
- 3.4. Market Trends
- 3.4.1. Increasing Demand form Pharmaceutical Industry
- 4. Market Factor Analysis
- 4.1. Porters Five Forces
- 4.2. Supply/Value Chain
- 4.3. PESTEL analysis
- 4.4. Market Entropy
- 4.5. Patent/Trademark Analysis
- 5. Global Amines Market Analysis, Insights and Forecast, 2020-2032
- 5.1. Market Analysis, Insights and Forecast - by Type
- 5.1.1. Ethyleneamines
- 5.1.2. Alkylamines
- 5.1.3. Fatty Amines
- 5.1.4. Specialty Amines
- 5.1.5. Ethanolamines
- 5.2. Market Analysis, Insights and Forecast - by End-use
- 5.2.1. Rubber
- 5.2.2. Personal Care products
- 5.2.3. Cleaning Products
- 5.2.4. Adhesives, Paints, and Resins
- 5.2.5. Agro Chemicals
- 5.2.6. Oil and Petrochemical
- 5.2.7. Other End-uses
- 5.3. Market Analysis, Insights and Forecast - by Region
- 5.3.1. Asia Pacific
- 5.3.2. North America
- 5.3.3. Europe
- 5.3.4. South America
- 5.3.5. Middle East and Africa
- 5.1. Market Analysis, Insights and Forecast - by Type
- 6. Asia Pacific Amines Market Analysis, Insights and Forecast, 2020-2032
- 6.1. Market Analysis, Insights and Forecast - by Type
- 6.1.1. Ethyleneamines
- 6.1.2. Alkylamines
- 6.1.3. Fatty Amines
- 6.1.4. Specialty Amines
- 6.1.5. Ethanolamines
- 6.2. Market Analysis, Insights and Forecast - by End-use
- 6.2.1. Rubber
- 6.2.2. Personal Care products
- 6.2.3. Cleaning Products
- 6.2.4. Adhesives, Paints, and Resins
- 6.2.5. Agro Chemicals
- 6.2.6. Oil and Petrochemical
- 6.2.7. Other End-uses
- 6.1. Market Analysis, Insights and Forecast - by Type
- 7. North America Amines Market Analysis, Insights and Forecast, 2020-2032
- 7.1. Market Analysis, Insights and Forecast - by Type
- 7.1.1. Ethyleneamines
- 7.1.2. Alkylamines
- 7.1.3. Fatty Amines
- 7.1.4. Specialty Amines
- 7.1.5. Ethanolamines
- 7.2. Market Analysis, Insights and Forecast - by End-use
- 7.2.1. Rubber
- 7.2.2. Personal Care products
- 7.2.3. Cleaning Products
- 7.2.4. Adhesives, Paints, and Resins
- 7.2.5. Agro Chemicals
- 7.2.6. Oil and Petrochemical
- 7.2.7. Other End-uses
- 7.1. Market Analysis, Insights and Forecast - by Type
- 8. Europe Amines Market Analysis, Insights and Forecast, 2020-2032
- 8.1. Market Analysis, Insights and Forecast - by Type
- 8.1.1. Ethyleneamines
- 8.1.2. Alkylamines
- 8.1.3. Fatty Amines
- 8.1.4. Specialty Amines
- 8.1.5. Ethanolamines
- 8.2. Market Analysis, Insights and Forecast - by End-use
- 8.2.1. Rubber
- 8.2.2. Personal Care products
- 8.2.3. Cleaning Products
- 8.2.4. Adhesives, Paints, and Resins
- 8.2.5. Agro Chemicals
- 8.2.6. Oil and Petrochemical
- 8.2.7. Other End-uses
- 8.1. Market Analysis, Insights and Forecast - by Type
- 9. South America Amines Market Analysis, Insights and Forecast, 2020-2032
- 9.1. Market Analysis, Insights and Forecast - by Type
- 9.1.1. Ethyleneamines
- 9.1.2. Alkylamines
- 9.1.3. Fatty Amines
- 9.1.4. Specialty Amines
- 9.1.5. Ethanolamines
- 9.2. Market Analysis, Insights and Forecast - by End-use
- 9.2.1. Rubber
- 9.2.2. Personal Care products
- 9.2.3. Cleaning Products
- 9.2.4. Adhesives, Paints, and Resins
- 9.2.5. Agro Chemicals
- 9.2.6. Oil and Petrochemical
- 9.2.7. Other End-uses
- 9.1. Market Analysis, Insights and Forecast - by Type
- 10. Middle East and Africa Amines Market Analysis, Insights and Forecast, 2020-2032
- 10.1. Market Analysis, Insights and Forecast - by Type
- 10.1.1. Ethyleneamines
- 10.1.2. Alkylamines
- 10.1.3. Fatty Amines
- 10.1.4. Specialty Amines
- 10.1.5. Ethanolamines
- 10.2. Market Analysis, Insights and Forecast - by End-use
- 10.2.1. Rubber
- 10.2.2. Personal Care products
- 10.2.3. Cleaning Products
- 10.2.4. Adhesives, Paints, and Resins
- 10.2.5. Agro Chemicals
- 10.2.6. Oil and Petrochemical
- 10.2.7. Other End-uses
- 10.1. Market Analysis, Insights and Forecast - by Type
- 11. Competitive Analysis
- 11.1. Global Market Share Analysis 2025
- 11.2. Company Profiles
- 11.2.1 Clariant
- 11.2.1.1. Overview
- 11.2.1.2. Products
- 11.2.1.3. SWOT Analysis
- 11.2.1.4. Recent Developments
- 11.2.1.5. Financials (Based on Availability)
- 11.2.2 Air Products and Chemicals Inc
- 11.2.2.1. Overview
- 11.2.2.2. Products
- 11.2.2.3. SWOT Analysis
- 11.2.2.4. Recent Developments
- 11.2.2.5. Financials (Based on Availability)
- 11.2.3 Solvay
- 11.2.3.1. Overview
- 11.2.3.2. Products
- 11.2.3.3. SWOT Analysis
- 11.2.3.4. Recent Developments
- 11.2.3.5. Financials (Based on Availability)
- 11.2.4 INEOS
- 11.2.4.1. Overview
- 11.2.4.2. Products
- 11.2.4.3. SWOT Analysis
- 11.2.4.4. Recent Developments
- 11.2.4.5. Financials (Based on Availability)
- 11.2.5 LyondellBasell Industries N V
- 11.2.5.1. Overview
- 11.2.5.2. Products
- 11.2.5.3. SWOT Analysis
- 11.2.5.4. Recent Developments
- 11.2.5.5. Financials (Based on Availability)
- 11.2.6 Celanese Corporation
- 11.2.6.1. Overview
- 11.2.6.2. Products
- 11.2.6.3. SWOT Analysis
- 11.2.6.4. Recent Developments
- 11.2.6.5. Financials (Based on Availability)
- 11.2.7 Alkyl Amines Chemicals Limited
- 11.2.7.1. Overview
- 11.2.7.2. Products
- 11.2.7.3. SWOT Analysis
- 11.2.7.4. Recent Developments
- 11.2.7.5. Financials (Based on Availability)
- 11.2.8 INVISTA
- 11.2.8.1. Overview
- 11.2.8.2. Products
- 11.2.8.3. SWOT Analysis
- 11.2.8.4. Recent Developments
- 11.2.8.5. Financials (Based on Availability)
- 11.2.9 Kemipex
- 11.2.9.1. Overview
- 11.2.9.2. Products
- 11.2.9.3. SWOT Analysis
- 11.2.9.4. Recent Developments
- 11.2.9.5. Financials (Based on Availability)
- 11.2.10 BASF SE
- 11.2.10.1. Overview
- 11.2.10.2. Products
- 11.2.10.3. SWOT Analysis
- 11.2.10.4. Recent Developments
- 11.2.10.5. Financials (Based on Availability)
- 11.2.11 Arkema Group
- 11.2.11.1. Overview
- 11.2.11.2. Products
- 11.2.11.3. SWOT Analysis
- 11.2.11.4. Recent Developments
- 11.2.11.5. Financials (Based on Availability)
- 11.2.12 Huntsman International LLC
- 11.2.12.1. Overview
- 11.2.12.2. Products
- 11.2.12.3. SWOT Analysis
- 11.2.12.4. Recent Developments
- 11.2.12.5. Financials (Based on Availability)
- 11.2.13 SABIC
- 11.2.13.1. Overview
- 11.2.13.2. Products
- 11.2.13.3. SWOT Analysis
- 11.2.13.4. Recent Developments
- 11.2.13.5. Financials (Based on Availability)
- 11.2.14 Akzo Nobel N V
- 11.2.14.1. Overview
- 11.2.14.2. Products
- 11.2.14.3. SWOT Analysis
- 11.2.14.4. Recent Developments
- 11.2.14.5. Financials (Based on Availability)
- 11.2.15 Daicel Corporation
- 11.2.15.1. Overview
- 11.2.15.2. Products
- 11.2.15.3. SWOT Analysis
- 11.2.15.4. Recent Developments
- 11.2.15.5. Financials (Based on Availability)
- 11.2.16 Mitsubishi Gas Chemical Company Inc
- 11.2.16.1. Overview
- 11.2.16.2. Products
- 11.2.16.3. SWOT Analysis
- 11.2.16.4. Recent Developments
- 11.2.16.5. Financials (Based on Availability)
- 11.2.17 DowDuPont
- 11.2.17.1. Overview
- 11.2.17.2. Products
- 11.2.17.3. SWOT Analysis
- 11.2.17.4. Recent Developments
- 11.2.17.5. Financials (Based on Availability)
- 11.2.18 Tosoh Corporation*List Not Exhaustive
- 11.2.18.1. Overview
- 11.2.18.2. Products
- 11.2.18.3. SWOT Analysis
- 11.2.18.4. Recent Developments
- 11.2.18.5. Financials (Based on Availability)
- 11.2.1 Clariant
List of Figures
- Figure 1: Global Amines Market Revenue Breakdown (Million, %) by Region 2025 & 2033
- Figure 2: Global Amines Market Volume Breakdown (K Tons, %) by Region 2025 & 2033
- Figure 3: Asia Pacific Amines Market Revenue (Million), by Type 2025 & 2033
- Figure 4: Asia Pacific Amines Market Volume (K Tons), by Type 2025 & 2033
- Figure 5: Asia Pacific Amines Market Revenue Share (%), by Type 2025 & 2033
- Figure 6: Asia Pacific Amines Market Volume Share (%), by Type 2025 & 2033
- Figure 7: Asia Pacific Amines Market Revenue (Million), by End-use 2025 & 2033
- Figure 8: Asia Pacific Amines Market Volume (K Tons), by End-use 2025 & 2033
- Figure 9: Asia Pacific Amines Market Revenue Share (%), by End-use 2025 & 2033
- Figure 10: Asia Pacific Amines Market Volume Share (%), by End-use 2025 & 2033
- Figure 11: Asia Pacific Amines Market Revenue (Million), by Country 2025 & 2033
- Figure 12: Asia Pacific Amines Market Volume (K Tons), by Country 2025 & 2033
- Figure 13: Asia Pacific Amines Market Revenue Share (%), by Country 2025 & 2033
- Figure 14: Asia Pacific Amines Market Volume Share (%), by Country 2025 & 2033
- Figure 15: North America Amines Market Revenue (Million), by Type 2025 & 2033
- Figure 16: North America Amines Market Volume (K Tons), by Type 2025 & 2033
- Figure 17: North America Amines Market Revenue Share (%), by Type 2025 & 2033
- Figure 18: North America Amines Market Volume Share (%), by Type 2025 & 2033
- Figure 19: North America Amines Market Revenue (Million), by End-use 2025 & 2033
- Figure 20: North America Amines Market Volume (K Tons), by End-use 2025 & 2033
- Figure 21: North America Amines Market Revenue Share (%), by End-use 2025 & 2033
- Figure 22: North America Amines Market Volume Share (%), by End-use 2025 & 2033
- Figure 23: North America Amines Market Revenue (Million), by Country 2025 & 2033
- Figure 24: North America Amines Market Volume (K Tons), by Country 2025 & 2033
- Figure 25: North America Amines Market Revenue Share (%), by Country 2025 & 2033
- Figure 26: North America Amines Market Volume Share (%), by Country 2025 & 2033
- Figure 27: Europe Amines Market Revenue (Million), by Type 2025 & 2033
- Figure 28: Europe Amines Market Volume (K Tons), by Type 2025 & 2033
- Figure 29: Europe Amines Market Revenue Share (%), by Type 2025 & 2033
- Figure 30: Europe Amines Market Volume Share (%), by Type 2025 & 2033
- Figure 31: Europe Amines Market Revenue (Million), by End-use 2025 & 2033
- Figure 32: Europe Amines Market Volume (K Tons), by End-use 2025 & 2033
- Figure 33: Europe Amines Market Revenue Share (%), by End-use 2025 & 2033
- Figure 34: Europe Amines Market Volume Share (%), by End-use 2025 & 2033
- Figure 35: Europe Amines Market Revenue (Million), by Country 2025 & 2033
- Figure 36: Europe Amines Market Volume (K Tons), by Country 2025 & 2033
- Figure 37: Europe Amines Market Revenue Share (%), by Country 2025 & 2033
- Figure 38: Europe Amines Market Volume Share (%), by Country 2025 & 2033
- Figure 39: South America Amines Market Revenue (Million), by Type 2025 & 2033
- Figure 40: South America Amines Market Volume (K Tons), by Type 2025 & 2033
- Figure 41: South America Amines Market Revenue Share (%), by Type 2025 & 2033
- Figure 42: South America Amines Market Volume Share (%), by Type 2025 & 2033
- Figure 43: South America Amines Market Revenue (Million), by End-use 2025 & 2033
- Figure 44: South America Amines Market Volume (K Tons), by End-use 2025 & 2033
- Figure 45: South America Amines Market Revenue Share (%), by End-use 2025 & 2033
- Figure 46: South America Amines Market Volume Share (%), by End-use 2025 & 2033
- Figure 47: South America Amines Market Revenue (Million), by Country 2025 & 2033
- Figure 48: South America Amines Market Volume (K Tons), by Country 2025 & 2033
- Figure 49: South America Amines Market Revenue Share (%), by Country 2025 & 2033
- Figure 50: South America Amines Market Volume Share (%), by Country 2025 & 2033
- Figure 51: Middle East and Africa Amines Market Revenue (Million), by Type 2025 & 2033
- Figure 52: Middle East and Africa Amines Market Volume (K Tons), by Type 2025 & 2033
- Figure 53: Middle East and Africa Amines Market Revenue Share (%), by Type 2025 & 2033
- Figure 54: Middle East and Africa Amines Market Volume Share (%), by Type 2025 & 2033
- Figure 55: Middle East and Africa Amines Market Revenue (Million), by End-use 2025 & 2033
- Figure 56: Middle East and Africa Amines Market Volume (K Tons), by End-use 2025 & 2033
- Figure 57: Middle East and Africa Amines Market Revenue Share (%), by End-use 2025 & 2033
- Figure 58: Middle East and Africa Amines Market Volume Share (%), by End-use 2025 & 2033
- Figure 59: Middle East and Africa Amines Market Revenue (Million), by Country 2025 & 2033
- Figure 60: Middle East and Africa Amines Market Volume (K Tons), by Country 2025 & 2033
- Figure 61: Middle East and Africa Amines Market Revenue Share (%), by Country 2025 & 2033
- Figure 62: Middle East and Africa Amines Market Volume Share (%), by Country 2025 & 2033
List of Tables
- Table 1: Global Amines Market Revenue Million Forecast, by Type 2020 & 2033
- Table 2: Global Amines Market Volume K Tons Forecast, by Type 2020 & 2033
- Table 3: Global Amines Market Revenue Million Forecast, by End-use 2020 & 2033
- Table 4: Global Amines Market Volume K Tons Forecast, by End-use 2020 & 2033
- Table 5: Global Amines Market Revenue Million Forecast, by Region 2020 & 2033
- Table 6: Global Amines Market Volume K Tons Forecast, by Region 2020 & 2033
- Table 7: Global Amines Market Revenue Million Forecast, by Type 2020 & 2033
- Table 8: Global Amines Market Volume K Tons Forecast, by Type 2020 & 2033
- Table 9: Global Amines Market Revenue Million Forecast, by End-use 2020 & 2033
- Table 10: Global Amines Market Volume K Tons Forecast, by End-use 2020 & 2033
- Table 11: Global Amines Market Revenue Million Forecast, by Country 2020 & 2033
- Table 12: Global Amines Market Volume K Tons Forecast, by Country 2020 & 2033
- Table 13: China Amines Market Revenue (Million) Forecast, by Application 2020 & 2033
- Table 14: China Amines Market Volume (K Tons) Forecast, by Application 2020 & 2033
- Table 15: India Amines Market Revenue (Million) Forecast, by Application 2020 & 2033
- Table 16: India Amines Market Volume (K Tons) Forecast, by Application 2020 & 2033
- Table 17: Japan Amines Market Revenue (Million) Forecast, by Application 2020 & 2033
- Table 18: Japan Amines Market Volume (K Tons) Forecast, by Application 2020 & 2033
- Table 19: South Korea Amines Market Revenue (Million) Forecast, by Application 2020 & 2033
- Table 20: South Korea Amines Market Volume (K Tons) Forecast, by Application 2020 & 2033
- Table 21: Australia and New Zealand Amines Market Revenue (Million) Forecast, by Application 2020 & 2033
- Table 22: Australia and New Zealand Amines Market Volume (K Tons) Forecast, by Application 2020 & 2033
- Table 23: Rest of Asia Pacific Amines Market Revenue (Million) Forecast, by Application 2020 & 2033
- Table 24: Rest of Asia Pacific Amines Market Volume (K Tons) Forecast, by Application 2020 & 2033
- Table 25: Global Amines Market Revenue Million Forecast, by Type 2020 & 2033
- Table 26: Global Amines Market Volume K Tons Forecast, by Type 2020 & 2033
- Table 27: Global Amines Market Revenue Million Forecast, by End-use 2020 & 2033
- Table 28: Global Amines Market Volume K Tons Forecast, by End-use 2020 & 2033
- Table 29: Global Amines Market Revenue Million Forecast, by Country 2020 & 2033
- Table 30: Global Amines Market Volume K Tons Forecast, by Country 2020 & 2033
- Table 31: United States Amines Market Revenue (Million) Forecast, by Application 2020 & 2033
- Table 32: United States Amines Market Volume (K Tons) Forecast, by Application 2020 & 2033
- Table 33: Canada Amines Market Revenue (Million) Forecast, by Application 2020 & 2033
- Table 34: Canada Amines Market Volume (K Tons) Forecast, by Application 2020 & 2033
- Table 35: Mexico Amines Market Revenue (Million) Forecast, by Application 2020 & 2033
- Table 36: Mexico Amines Market Volume (K Tons) Forecast, by Application 2020 & 2033
- Table 37: Global Amines Market Revenue Million Forecast, by Type 2020 & 2033
- Table 38: Global Amines Market Volume K Tons Forecast, by Type 2020 & 2033
- Table 39: Global Amines Market Revenue Million Forecast, by End-use 2020 & 2033
- Table 40: Global Amines Market Volume K Tons Forecast, by End-use 2020 & 2033
- Table 41: Global Amines Market Revenue Million Forecast, by Country 2020 & 2033
- Table 42: Global Amines Market Volume K Tons Forecast, by Country 2020 & 2033
- Table 43: Germany Amines Market Revenue (Million) Forecast, by Application 2020 & 2033
- Table 44: Germany Amines Market Volume (K Tons) Forecast, by Application 2020 & 2033
- Table 45: United Kingdom Amines Market Revenue (Million) Forecast, by Application 2020 & 2033
- Table 46: United Kingdom Amines Market Volume (K Tons) Forecast, by Application 2020 & 2033
- Table 47: Italy Amines Market Revenue (Million) Forecast, by Application 2020 & 2033
- Table 48: Italy Amines Market Volume (K Tons) Forecast, by Application 2020 & 2033
- Table 49: France Amines Market Revenue (Million) Forecast, by Application 2020 & 2033
- Table 50: France Amines Market Volume (K Tons) Forecast, by Application 2020 & 2033
- Table 51: Rest of Europe Amines Market Revenue (Million) Forecast, by Application 2020 & 2033
- Table 52: Rest of Europe Amines Market Volume (K Tons) Forecast, by Application 2020 & 2033
- Table 53: Global Amines Market Revenue Million Forecast, by Type 2020 & 2033
- Table 54: Global Amines Market Volume K Tons Forecast, by Type 2020 & 2033
- Table 55: Global Amines Market Revenue Million Forecast, by End-use 2020 & 2033
- Table 56: Global Amines Market Volume K Tons Forecast, by End-use 2020 & 2033
- Table 57: Global Amines Market Revenue Million Forecast, by Country 2020 & 2033
- Table 58: Global Amines Market Volume K Tons Forecast, by Country 2020 & 2033
- Table 59: Brazil Amines Market Revenue (Million) Forecast, by Application 2020 & 2033
- Table 60: Brazil Amines Market Volume (K Tons) Forecast, by Application 2020 & 2033
- Table 61: Argentina Amines Market Revenue (Million) Forecast, by Application 2020 & 2033
- Table 62: Argentina Amines Market Volume (K Tons) Forecast, by Application 2020 & 2033
- Table 63: Rest of South America Amines Market Revenue (Million) Forecast, by Application 2020 & 2033
- Table 64: Rest of South America Amines Market Volume (K Tons) Forecast, by Application 2020 & 2033
- Table 65: Global Amines Market Revenue Million Forecast, by Type 2020 & 2033
- Table 66: Global Amines Market Volume K Tons Forecast, by Type 2020 & 2033
- Table 67: Global Amines Market Revenue Million Forecast, by End-use 2020 & 2033
- Table 68: Global Amines Market Volume K Tons Forecast, by End-use 2020 & 2033
- Table 69: Global Amines Market Revenue Million Forecast, by Country 2020 & 2033
- Table 70: Global Amines Market Volume K Tons Forecast, by Country 2020 & 2033
- Table 71: Saudi Arabia Amines Market Revenue (Million) Forecast, by Application 2020 & 2033
- Table 72: Saudi Arabia Amines Market Volume (K Tons) Forecast, by Application 2020 & 2033
- Table 73: South Africa Amines Market Revenue (Million) Forecast, by Application 2020 & 2033
- Table 74: South Africa Amines Market Volume (K Tons) Forecast, by Application 2020 & 2033
- Table 75: Rest of Middle East and Africa Amines Market Revenue (Million) Forecast, by Application 2020 & 2033
- Table 76: Rest of Middle East and Africa Amines Market Volume (K Tons) Forecast, by Application 2020 & 2033
Frequently Asked Questions
1. What is the projected Compound Annual Growth Rate (CAGR) of the Amines Market?
The projected CAGR is approximately 4.75%.
2. Which companies are prominent players in the Amines Market?
Key companies in the market include Clariant, Air Products and Chemicals Inc, Solvay, INEOS, LyondellBasell Industries N V, Celanese Corporation, Alkyl Amines Chemicals Limited, INVISTA, Kemipex, BASF SE, Arkema Group, Huntsman International LLC, SABIC, Akzo Nobel N V, Daicel Corporation, Mitsubishi Gas Chemical Company Inc, DowDuPont, Tosoh Corporation*List Not Exhaustive.
3. What are the main segments of the Amines Market?
The market segments include Type, End-use.
4. Can you provide details about the market size?
The market size is estimated to be USD 15.42 Million as of 2022.
5. What are some drivers contributing to market growth?
; Growing Demand for Personal Care Products from Asia-Pacific; Accelerating Demand for Pesticides from Developing Countries; Increasing Demand and Usage in Construction Sector.
6. What are the notable trends driving market growth?
Increasing Demand form Pharmaceutical Industry.
7. Are there any restraints impacting market growth?
; Rising Consumption of Wood-free Products; Increasing Usage of Bio-Based Products for Agriculture in Developed Countries.
8. Can you provide examples of recent developments in the market?
In 2022, LyondellBasell announced the expansion of its amine plant in China to meet growing demand for amines in the Asia-Pacific region.
9. What pricing options are available for accessing the report?
Pricing options include single-user, multi-user, and enterprise licenses priced at USD 4750, USD 5250, and USD 8750 respectively.
10. Is the market size provided in terms of value or volume?
The market size is provided in terms of value, measured in Million and volume, measured in K Tons.
11. Are there any specific market keywords associated with the report?
Yes, the market keyword associated with the report is "Amines Market," which aids in identifying and referencing the specific market segment covered.
12. How do I determine which pricing option suits my needs best?
The pricing options vary based on user requirements and access needs. Individual users may opt for single-user licenses, while businesses requiring broader access may choose multi-user or enterprise licenses for cost-effective access to the report.
13. Are there any additional resources or data provided in the Amines Market report?
While the report offers comprehensive insights, it's advisable to review the specific contents or supplementary materials provided to ascertain if additional resources or data are available.
14. How can I stay updated on further developments or reports in the Amines Market?
To stay informed about further developments, trends, and reports in the Amines Market, consider subscribing to industry newsletters, following relevant companies and organizations, or regularly checking reputable industry news sources and publications.
Methodology
Step 1 - Identification of Relevant Samples Size from Population Database


Step 2 - Approaches for Defining Global Market Size (Value, Volume* & Price*)

Note*: In applicable scenarios
Step 3 - Data Sources
Primary Research
- Web Analytics
- Survey Reports
- Research Institute
- Latest Research Reports
- Opinion Leaders
Secondary Research
- Annual Reports
- White Paper
- Latest Press Release
- Industry Association
- Paid Database
- Investor Presentations

Step 4 - Data Triangulation
Involves using different sources of information in order to increase the validity of a study
These sources are likely to be stakeholders in a program - participants, other researchers, program staff, other community members, and so on.
Then we put all data in single framework & apply various statistical tools to find out the dynamic on the market.
During the analysis stage, feedback from the stakeholder groups would be compared to determine areas of agreement as well as areas of divergence