

Key Insights
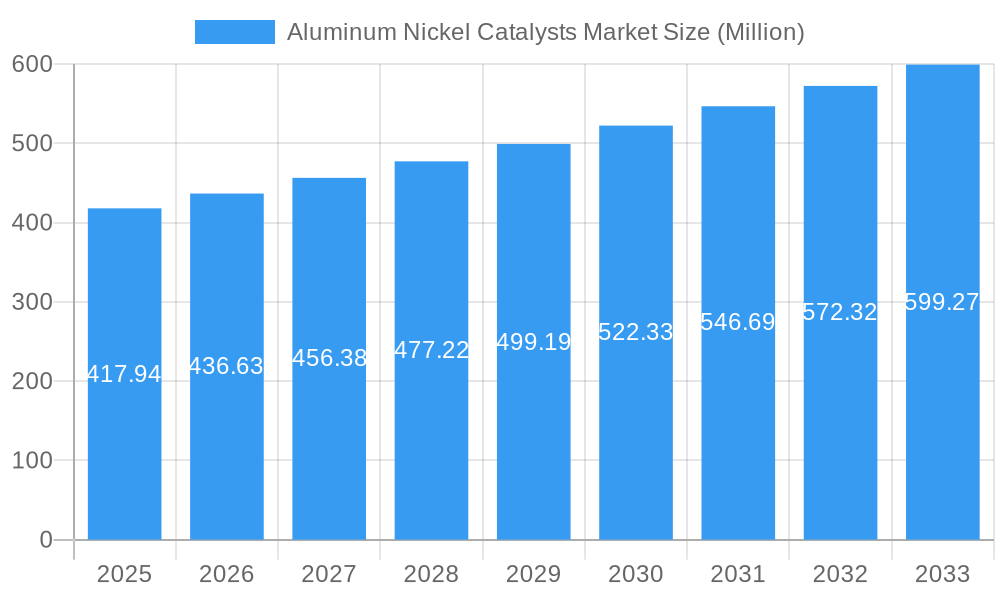
The Aluminum Nickel Catalysts market, valued at $417.94 million in 2025, is projected to experience robust growth, driven by increasing demand across key industries. A compound annual growth rate (CAGR) exceeding 4% from 2025 to 2033 indicates a significant market expansion. The growth is fueled primarily by the expanding refinery and chemical industries, particularly in hydrogenation and desulfurization processes crucial for fuel production and chemical synthesis. The activated segment within the aluminum nickel catalysts market is anticipated to hold a larger market share due to its superior catalytic activity and efficiency compared to non-activated counterparts. Furthermore, the rising adoption of renewable energy sources and the associated need for efficient catalysts in biofuel production are expected to contribute to market growth. Geographic expansion, particularly in Asia-Pacific regions experiencing rapid industrialization and economic growth, presents significant opportunities for market players. However, stringent environmental regulations and the potential volatility of raw material prices pose challenges to market expansion. Competition is moderately concentrated, with key players like Axens, Clariant, and BASF SE actively involved in research and development to improve catalyst performance and efficiency, driving innovation and market dynamics.
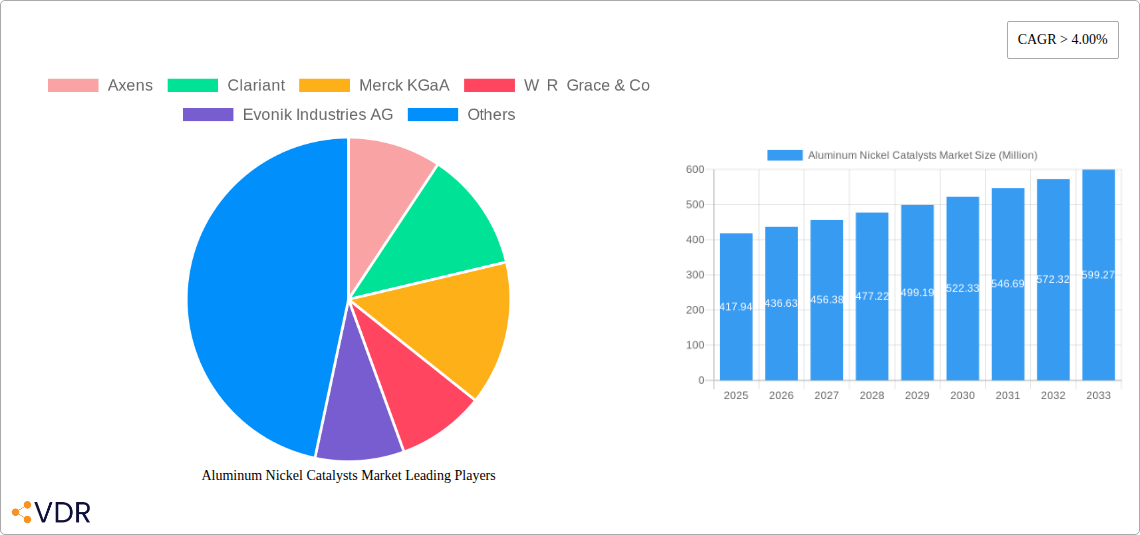
Aluminum Nickel Catalysts Market Market Size (In Million)
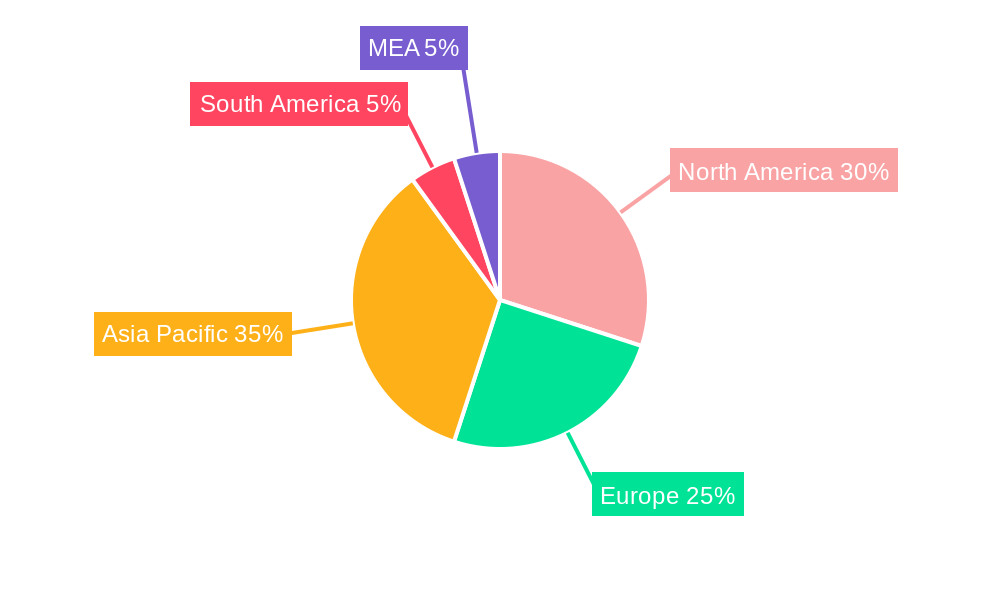
The market segmentation reveals a diversified landscape. The refinery and chemical industries dominate application, with hydrogenation and desulfurization processes being primary drivers. The 'others' category, encompassing polymers, renewables, and pharmaceuticals, is a growing segment showcasing the versatility of aluminum nickel catalysts. North America and Europe currently hold significant market share, but the Asia-Pacific region, particularly China and India, are predicted to witness the fastest growth due to burgeoning industrialization. The competitive landscape includes both established global players and regional companies, fostering innovation and competition. Long-term market outlook remains positive, contingent on sustained economic growth, technological advancements in catalyst design, and favorable regulatory environments. Strategies for market penetration will likely involve collaborations, mergers, and acquisitions, as well as focusing on developing catalysts with higher efficiency, selectivity, and sustainability.
Aluminum Nickel Catalysts Market Company Market Share
Aluminum Nickel Catalysts Market: A Comprehensive Report (2019-2033)
This comprehensive report provides an in-depth analysis of the Aluminum Nickel Catalysts market, encompassing market dynamics, growth trends, regional segmentation, product landscape, key players, and future outlook. The report covers the period from 2019 to 2033, with 2025 serving as the base and estimated year. The parent market is the Catalyst Market, while the child market is specifically Metal Catalysts. The total market size in 2025 is estimated at xx Million.
Aluminum Nickel Catalysts Market Market Dynamics & Structure
The Aluminum Nickel Catalysts market is characterized by moderate concentration, with key players holding significant market share. The market is driven by technological innovations focused on enhancing catalyst efficiency and selectivity, particularly in the refinery and chemical industries. Stringent environmental regulations regarding emissions are pushing the adoption of advanced catalysts. Competitive substitutes include other metal catalysts, but aluminum nickel catalysts maintain a strong position due to their cost-effectiveness and performance in specific applications. End-user demographics are primarily industrial, with significant demand from refineries and chemical plants. M&A activity has been moderate, with strategic acquisitions aimed at expanding product portfolios and geographical reach.
- Market Concentration: Moderately concentrated, with top 5 players holding approximately xx% market share in 2025.
- Technological Innovation: Focus on improved selectivity, activity, and lifetime; research into nanotechnology-based catalysts.
- Regulatory Framework: Stringent environmental regulations driving demand for efficient and cleaner catalysts.
- Competitive Substitutes: Other metal catalysts (e.g., nickel-based, palladium-based) pose some competition.
- M&A Activity: xx deals recorded between 2019 and 2024, primarily focused on strategic expansion.
- Innovation Barriers: High R&D costs and lengthy testing procedures for new catalyst formulations.
Aluminum Nickel Catalysts Market Growth Trends & Insights
The Aluminum Nickel Catalysts market exhibited a CAGR of xx% during the historical period (2019-2024) and is projected to maintain a CAGR of xx% during the forecast period (2025-2033). Market growth is fueled by increasing demand from the chemical and refinery industries, driven by rising global energy consumption and production of petrochemicals. Technological advancements in catalyst design and manufacturing are contributing to improved performance and reduced costs. Shifting consumer preferences towards sustainable and environmentally friendly solutions are also boosting demand. Market penetration in emerging economies is expected to increase significantly, driving future growth. The adoption rate of advanced aluminum nickel catalysts is increasing steadily, particularly in applications requiring high selectivity and efficiency.
Dominant Regions, Countries, or Segments in Aluminum Nickel Catalysts Market
The Refinery Industry segment dominates the Aluminum Nickel Catalysts market, accounting for approximately xx% of the total market share in 2025. Within this segment, North America and Europe are the leading regions, driven by robust refinery operations and stringent environmental regulations. The Activated type of catalyst holds a larger market share compared to non-activated catalysts due to its superior performance characteristics. In terms of applications, Hydrogenation and Desulfurization are the dominant applications.
- Key Drivers (Refinery Industry): Stringent emission standards, increasing demand for cleaner fuels, and ongoing refinery upgrades and expansions.
- Key Drivers (Chemical Industry): Growth in petrochemical production, demand for high-performance catalysts in various chemical processes.
- Key Drivers (Others): Expanding polymer and renewable energy sectors.
- Regional Dominance: North America and Europe, driven by mature industries and regulatory pressures.
- Segment Dominance: Refinery Industry, Activated catalysts, Hydrogenation, and Desulfurization applications.
Aluminum Nickel Catalysts Market Product Landscape
Aluminum nickel catalysts are available in various forms, including powders, pellets, and extrudates, each tailored to specific applications. Recent innovations focus on enhancing catalyst activity and selectivity through the use of promoters and support materials. The unique selling proposition of aluminum nickel catalysts lies in their cost-effectiveness, high activity, and suitability for various reactions such as hydrogenation, desulfurization, and dehydrogenation. Technological advancements are driving the development of more efficient and environmentally friendly catalysts.
Key Drivers, Barriers & Challenges in Aluminum Nickel Catalysts Market
Key Drivers: Increasing demand from refineries and chemical industries, stringent environmental regulations, technological advancements leading to improved catalyst efficiency and selectivity.
Key Challenges: Fluctuations in raw material prices, stringent safety and environmental regulations, intense competition from alternative catalysts, and potential supply chain disruptions. These challenges are estimated to impact market growth by approximately xx% by 2033.
Emerging Opportunities in Aluminum Nickel Catalysts Market
Emerging opportunities exist in the growing renewable energy sector (biofuel production) and the expanding pharmaceutical industry (catalytic hydrogenation processes). Untapped markets in developing economies also present significant growth potential. The development of next-generation catalysts with enhanced performance and sustainability features will further expand market opportunities.
Growth Accelerators in the Aluminum Nickel Catalysts Market Industry
Long-term growth will be driven by technological breakthroughs leading to more efficient and sustainable catalysts. Strategic partnerships between catalyst manufacturers and end-users will accelerate market adoption. Expansion into emerging markets and diversification into new applications will also contribute to sustained growth.
Key Players Shaping the Aluminum Nickel Catalysts Market Market
- Axens
- Clariant
- Merck KGaA
- W R Grace & Co
- Evonik Industries AG
- BASF SE
- Alfa Aesar Thermo Fisher Scientific
- Johnson Matthey
- Vineeth Precious Catalysts Pvt Ltd
- Haldor Topsoe AS
- Hangzhou JiaLi Metals Sci&Tech Limited Corporation
Notable Milestones in Aluminum Nickel Catalysts Market Sector
- 2021: Axens launched a new generation of aluminum nickel catalyst with improved selectivity.
- 2022: BASF acquired a smaller catalyst manufacturer, expanding its product portfolio.
- 2023: Johnson Matthey announced a significant investment in R&D for next-generation aluminum nickel catalysts. (Specific details not available for other years).
In-Depth Aluminum Nickel Catalysts Market Market Outlook
The Aluminum Nickel Catalysts market is poised for robust growth over the forecast period, driven by continuous technological advancements, expanding industrial applications, and increasing regulatory pressures. Strategic partnerships, investments in R&D, and expansion into new geographic markets will be crucial for companies to capitalize on the significant market potential. The market is expected to reach xx Million by 2033, presenting lucrative opportunities for both established players and new entrants.
Aluminum Nickel Catalysts Market Segmentation
-
1. Type
- 1.1. Activated
- 1.2. Non-Activated
-
2. Industry Vertical
- 2.1. Refinery Industry
- 2.2. Chemical Industry
- 2.3. Others(Polymer, Renewables, and Pharmaceuticals)
-
3. Application
- 3.1. Hydrogenation
- 3.2. Desulfurization
- 3.3. Dehydrogenation
- 3.4. Others(Refinery and Chemical)
Aluminum Nickel Catalysts Market Segmentation By Geography
-
1. Asia Pacific
- 1.1. China
- 1.2. India
- 1.3. Japan
- 1.4. South Korea
- 1.5. Rest of Asia Pacific
-
2. North America
- 2.1. United States
- 2.2. Canada
- 2.3. Mexico
-
3. Europe
- 3.1. Germany
- 3.2. France
- 3.3. Italy
- 3.4. Spain
- 3.5. Russia
- 3.6. Rest of Europe
-
4. South America
- 4.1. Brazil
- 4.2. Argentina
- 4.3. Rest of South America
-
5. Middle East and Africa
- 5.1. Saudi Arabia
- 5.2. South Africa
- 5.3. Rest of Middle East and Africa
Aluminum Nickel Catalysts Market Regional Market Share
Geographic Coverage of Aluminum Nickel Catalysts Market
Aluminum Nickel Catalysts Market REPORT HIGHLIGHTS
| Aspects | Details |
|---|---|
| Study Period | 2020-2034 |
| Base Year | 2025 |
| Estimated Year | 2026 |
| Forecast Period | 2026-2034 |
| Historical Period | 2020-2025 |
| Growth Rate | CAGR of > 4.00% from 2020-2034 |
| Segmentation |
|
Table of Contents
- 1. Introduction
- 1.1. Research Scope
- 1.2. Market Segmentation
- 1.3. Research Objective
- 1.4. Definitions and Assumptions
- 2. Executive Summary
- 2.1. Market Snapshot
- 3. Market Dynamics
- 3.1. Market Drivers
- 3.2. Market Restrains
- 3.3. Market Trends
- 3.4. Market Opportunities
- 4. Market Factor Analysis
- 4.1. Porters Five Forces
- 4.1.1. Bargaining Power of Suppliers
- 4.1.2. Bargaining Power of Buyers
- 4.1.3. Threat of New Entrants
- 4.1.4. Threat of Substitutes
- 4.1.5. Competitive Rivalry
- 4.2. PESTEL analysis
- 4.3. BCG Analysis
- 4.3.1. Stars (High Growth, High Market Share)
- 4.3.2. Cash Cows (Low Growth, High Market Share)
- 4.3.3. Question Mark (High Growth, Low Market Share)
- 4.3.4. Dogs (Low Growth, Low Market Share)
- 4.4. Ansoff Matrix Analysis
- 4.5. Supply Chain Analysis
- 4.6. Regulatory Landscape
- 4.7. Current Market Potential and Opportunity Assessment (TAM–SAM–SOM Framework)
- 4.8. VDR Analyst Note
- 4.1. Porters Five Forces
- 5. Market Analysis, Insights and Forecast 2021-2033
- 5.1. Market Analysis, Insights and Forecast - by Type
- 5.1.1. Activated
- 5.1.2. Non-Activated
- 5.2. Market Analysis, Insights and Forecast - by Industry Vertical
- 5.2.1. Refinery Industry
- 5.2.2. Chemical Industry
- 5.2.3. Others(Polymer, Renewables, and Pharmaceuticals)
- 5.3. Market Analysis, Insights and Forecast - by Application
- 5.3.1. Hydrogenation
- 5.3.2. Desulfurization
- 5.3.3. Dehydrogenation
- 5.3.4. Others(Refinery and Chemical)
- 5.4. Market Analysis, Insights and Forecast - by Region
- 5.4.1. Asia Pacific
- 5.4.2. North America
- 5.4.3. Europe
- 5.4.4. South America
- 5.4.5. Middle East and Africa
- 5.1. Market Analysis, Insights and Forecast - by Type
- 6. Global Aluminum Nickel Catalysts Market Analysis, Insights and Forecast, 2021-2033
- 6.1. Market Analysis, Insights and Forecast - by Type
- 6.1.1. Activated
- 6.1.2. Non-Activated
- 6.2. Market Analysis, Insights and Forecast - by Industry Vertical
- 6.2.1. Refinery Industry
- 6.2.2. Chemical Industry
- 6.2.3. Others(Polymer, Renewables, and Pharmaceuticals)
- 6.3. Market Analysis, Insights and Forecast - by Application
- 6.3.1. Hydrogenation
- 6.3.2. Desulfurization
- 6.3.3. Dehydrogenation
- 6.3.4. Others(Refinery and Chemical)
- 6.1. Market Analysis, Insights and Forecast - by Type
- 7. Asia Pacific Aluminum Nickel Catalysts Market Analysis, Insights and Forecast, 2021-2033
- 7.1. Market Analysis, Insights and Forecast - by Type
- 7.1.1. Activated
- 7.1.2. Non-Activated
- 7.2. Market Analysis, Insights and Forecast - by Industry Vertical
- 7.2.1. Refinery Industry
- 7.2.2. Chemical Industry
- 7.2.3. Others(Polymer, Renewables, and Pharmaceuticals)
- 7.3. Market Analysis, Insights and Forecast - by Application
- 7.3.1. Hydrogenation
- 7.3.2. Desulfurization
- 7.3.3. Dehydrogenation
- 7.3.4. Others(Refinery and Chemical)
- 7.1. Market Analysis, Insights and Forecast - by Type
- 8. North America Aluminum Nickel Catalysts Market Analysis, Insights and Forecast, 2021-2033
- 8.1. Market Analysis, Insights and Forecast - by Type
- 8.1.1. Activated
- 8.1.2. Non-Activated
- 8.2. Market Analysis, Insights and Forecast - by Industry Vertical
- 8.2.1. Refinery Industry
- 8.2.2. Chemical Industry
- 8.2.3. Others(Polymer, Renewables, and Pharmaceuticals)
- 8.3. Market Analysis, Insights and Forecast - by Application
- 8.3.1. Hydrogenation
- 8.3.2. Desulfurization
- 8.3.3. Dehydrogenation
- 8.3.4. Others(Refinery and Chemical)
- 8.1. Market Analysis, Insights and Forecast - by Type
- 9. Europe Aluminum Nickel Catalysts Market Analysis, Insights and Forecast, 2021-2033
- 9.1. Market Analysis, Insights and Forecast - by Type
- 9.1.1. Activated
- 9.1.2. Non-Activated
- 9.2. Market Analysis, Insights and Forecast - by Industry Vertical
- 9.2.1. Refinery Industry
- 9.2.2. Chemical Industry
- 9.2.3. Others(Polymer, Renewables, and Pharmaceuticals)
- 9.3. Market Analysis, Insights and Forecast - by Application
- 9.3.1. Hydrogenation
- 9.3.2. Desulfurization
- 9.3.3. Dehydrogenation
- 9.3.4. Others(Refinery and Chemical)
- 9.1. Market Analysis, Insights and Forecast - by Type
- 10. South America Aluminum Nickel Catalysts Market Analysis, Insights and Forecast, 2021-2033
- 10.1. Market Analysis, Insights and Forecast - by Type
- 10.1.1. Activated
- 10.1.2. Non-Activated
- 10.2. Market Analysis, Insights and Forecast - by Industry Vertical
- 10.2.1. Refinery Industry
- 10.2.2. Chemical Industry
- 10.2.3. Others(Polymer, Renewables, and Pharmaceuticals)
- 10.3. Market Analysis, Insights and Forecast - by Application
- 10.3.1. Hydrogenation
- 10.3.2. Desulfurization
- 10.3.3. Dehydrogenation
- 10.3.4. Others(Refinery and Chemical)
- 10.1. Market Analysis, Insights and Forecast - by Type
- 11. Middle East and Africa Aluminum Nickel Catalysts Market Analysis, Insights and Forecast, 2021-2033
- 11.1. Market Analysis, Insights and Forecast - by Type
- 11.1.1. Activated
- 11.1.2. Non-Activated
- 11.2. Market Analysis, Insights and Forecast - by Industry Vertical
- 11.2.1. Refinery Industry
- 11.2.2. Chemical Industry
- 11.2.3. Others(Polymer, Renewables, and Pharmaceuticals)
- 11.3. Market Analysis, Insights and Forecast - by Application
- 11.3.1. Hydrogenation
- 11.3.2. Desulfurization
- 11.3.3. Dehydrogenation
- 11.3.4. Others(Refinery and Chemical)
- 11.1. Market Analysis, Insights and Forecast - by Type
- 12. Competitive Analysis
- 12.1. Company Profiles
- 12.1.1 Axens
- 12.1.1.1. Company Overview
- 12.1.1.2. Products
- 12.1.1.3. Company Financials
- 12.1.1.4. SWOT Analysis
- 12.1.2 Clariant
- 12.1.2.1. Company Overview
- 12.1.2.2. Products
- 12.1.2.3. Company Financials
- 12.1.2.4. SWOT Analysis
- 12.1.3 Merck KGaA
- 12.1.3.1. Company Overview
- 12.1.3.2. Products
- 12.1.3.3. Company Financials
- 12.1.3.4. SWOT Analysis
- 12.1.4 W R Grace & Co
- 12.1.4.1. Company Overview
- 12.1.4.2. Products
- 12.1.4.3. Company Financials
- 12.1.4.4. SWOT Analysis
- 12.1.5 Evonik Industries AG
- 12.1.5.1. Company Overview
- 12.1.5.2. Products
- 12.1.5.3. Company Financials
- 12.1.5.4. SWOT Analysis
- 12.1.6 BASF SE
- 12.1.6.1. Company Overview
- 12.1.6.2. Products
- 12.1.6.3. Company Financials
- 12.1.6.4. SWOT Analysis
- 12.1.7 Alfa Aesar Thermo Fisher Scientific
- 12.1.7.1. Company Overview
- 12.1.7.2. Products
- 12.1.7.3. Company Financials
- 12.1.7.4. SWOT Analysis
- 12.1.8 Johnson Matthey
- 12.1.8.1. Company Overview
- 12.1.8.2. Products
- 12.1.8.3. Company Financials
- 12.1.8.4. SWOT Analysis
- 12.1.9 Vineeth Precious Catalysts Pvt Ltd
- 12.1.9.1. Company Overview
- 12.1.9.2. Products
- 12.1.9.3. Company Financials
- 12.1.9.4. SWOT Analysis
- 12.1.10 Haldor Topsoe AS
- 12.1.10.1. Company Overview
- 12.1.10.2. Products
- 12.1.10.3. Company Financials
- 12.1.10.4. SWOT Analysis
- 12.1.11 Hangzhou JiaLi Metals Sci&Tech Limited Corporation
- 12.1.11.1. Company Overview
- 12.1.11.2. Products
- 12.1.11.3. Company Financials
- 12.1.11.4. SWOT Analysis
- 12.1.1 Axens
- 12.2. Market Entropy
- 12.2.1 Company's Key Areas Served
- 12.2.2 Recent Developments
- 12.3. Company Market Share Analysis 2025
- 12.3.1 Top 5 Companies Market Share Analysis
- 12.3.2 Top 3 Companies Market Share Analysis
- 12.4. List of Potential Customers
- 13. Research Methodology
List of Figures
- Figure 1: Global Aluminum Nickel Catalysts Market Revenue Breakdown (Million, %) by Region 2025 & 2033
- Figure 2: Global Aluminum Nickel Catalysts Market Volume Breakdown (K Tons, %) by Region 2025 & 2033
- Figure 3: Asia Pacific Aluminum Nickel Catalysts Market Revenue (Million), by Type 2025 & 2033
- Figure 4: Asia Pacific Aluminum Nickel Catalysts Market Volume (K Tons), by Type 2025 & 2033
- Figure 5: Asia Pacific Aluminum Nickel Catalysts Market Revenue Share (%), by Type 2025 & 2033
- Figure 6: Asia Pacific Aluminum Nickel Catalysts Market Volume Share (%), by Type 2025 & 2033
- Figure 7: Asia Pacific Aluminum Nickel Catalysts Market Revenue (Million), by Industry Vertical 2025 & 2033
- Figure 8: Asia Pacific Aluminum Nickel Catalysts Market Volume (K Tons), by Industry Vertical 2025 & 2033
- Figure 9: Asia Pacific Aluminum Nickel Catalysts Market Revenue Share (%), by Industry Vertical 2025 & 2033
- Figure 10: Asia Pacific Aluminum Nickel Catalysts Market Volume Share (%), by Industry Vertical 2025 & 2033
- Figure 11: Asia Pacific Aluminum Nickel Catalysts Market Revenue (Million), by Application 2025 & 2033
- Figure 12: Asia Pacific Aluminum Nickel Catalysts Market Volume (K Tons), by Application 2025 & 2033
- Figure 13: Asia Pacific Aluminum Nickel Catalysts Market Revenue Share (%), by Application 2025 & 2033
- Figure 14: Asia Pacific Aluminum Nickel Catalysts Market Volume Share (%), by Application 2025 & 2033
- Figure 15: Asia Pacific Aluminum Nickel Catalysts Market Revenue (Million), by Country 2025 & 2033
- Figure 16: Asia Pacific Aluminum Nickel Catalysts Market Volume (K Tons), by Country 2025 & 2033
- Figure 17: Asia Pacific Aluminum Nickel Catalysts Market Revenue Share (%), by Country 2025 & 2033
- Figure 18: Asia Pacific Aluminum Nickel Catalysts Market Volume Share (%), by Country 2025 & 2033
- Figure 19: North America Aluminum Nickel Catalysts Market Revenue (Million), by Type 2025 & 2033
- Figure 20: North America Aluminum Nickel Catalysts Market Volume (K Tons), by Type 2025 & 2033
- Figure 21: North America Aluminum Nickel Catalysts Market Revenue Share (%), by Type 2025 & 2033
- Figure 22: North America Aluminum Nickel Catalysts Market Volume Share (%), by Type 2025 & 2033
- Figure 23: North America Aluminum Nickel Catalysts Market Revenue (Million), by Industry Vertical 2025 & 2033
- Figure 24: North America Aluminum Nickel Catalysts Market Volume (K Tons), by Industry Vertical 2025 & 2033
- Figure 25: North America Aluminum Nickel Catalysts Market Revenue Share (%), by Industry Vertical 2025 & 2033
- Figure 26: North America Aluminum Nickel Catalysts Market Volume Share (%), by Industry Vertical 2025 & 2033
- Figure 27: North America Aluminum Nickel Catalysts Market Revenue (Million), by Application 2025 & 2033
- Figure 28: North America Aluminum Nickel Catalysts Market Volume (K Tons), by Application 2025 & 2033
- Figure 29: North America Aluminum Nickel Catalysts Market Revenue Share (%), by Application 2025 & 2033
- Figure 30: North America Aluminum Nickel Catalysts Market Volume Share (%), by Application 2025 & 2033
- Figure 31: North America Aluminum Nickel Catalysts Market Revenue (Million), by Country 2025 & 2033
- Figure 32: North America Aluminum Nickel Catalysts Market Volume (K Tons), by Country 2025 & 2033
- Figure 33: North America Aluminum Nickel Catalysts Market Revenue Share (%), by Country 2025 & 2033
- Figure 34: North America Aluminum Nickel Catalysts Market Volume Share (%), by Country 2025 & 2033
- Figure 35: Europe Aluminum Nickel Catalysts Market Revenue (Million), by Type 2025 & 2033
- Figure 36: Europe Aluminum Nickel Catalysts Market Volume (K Tons), by Type 2025 & 2033
- Figure 37: Europe Aluminum Nickel Catalysts Market Revenue Share (%), by Type 2025 & 2033
- Figure 38: Europe Aluminum Nickel Catalysts Market Volume Share (%), by Type 2025 & 2033
- Figure 39: Europe Aluminum Nickel Catalysts Market Revenue (Million), by Industry Vertical 2025 & 2033
- Figure 40: Europe Aluminum Nickel Catalysts Market Volume (K Tons), by Industry Vertical 2025 & 2033
- Figure 41: Europe Aluminum Nickel Catalysts Market Revenue Share (%), by Industry Vertical 2025 & 2033
- Figure 42: Europe Aluminum Nickel Catalysts Market Volume Share (%), by Industry Vertical 2025 & 2033
- Figure 43: Europe Aluminum Nickel Catalysts Market Revenue (Million), by Application 2025 & 2033
- Figure 44: Europe Aluminum Nickel Catalysts Market Volume (K Tons), by Application 2025 & 2033
- Figure 45: Europe Aluminum Nickel Catalysts Market Revenue Share (%), by Application 2025 & 2033
- Figure 46: Europe Aluminum Nickel Catalysts Market Volume Share (%), by Application 2025 & 2033
- Figure 47: Europe Aluminum Nickel Catalysts Market Revenue (Million), by Country 2025 & 2033
- Figure 48: Europe Aluminum Nickel Catalysts Market Volume (K Tons), by Country 2025 & 2033
- Figure 49: Europe Aluminum Nickel Catalysts Market Revenue Share (%), by Country 2025 & 2033
- Figure 50: Europe Aluminum Nickel Catalysts Market Volume Share (%), by Country 2025 & 2033
- Figure 51: South America Aluminum Nickel Catalysts Market Revenue (Million), by Type 2025 & 2033
- Figure 52: South America Aluminum Nickel Catalysts Market Volume (K Tons), by Type 2025 & 2033
- Figure 53: South America Aluminum Nickel Catalysts Market Revenue Share (%), by Type 2025 & 2033
- Figure 54: South America Aluminum Nickel Catalysts Market Volume Share (%), by Type 2025 & 2033
- Figure 55: South America Aluminum Nickel Catalysts Market Revenue (Million), by Industry Vertical 2025 & 2033
- Figure 56: South America Aluminum Nickel Catalysts Market Volume (K Tons), by Industry Vertical 2025 & 2033
- Figure 57: South America Aluminum Nickel Catalysts Market Revenue Share (%), by Industry Vertical 2025 & 2033
- Figure 58: South America Aluminum Nickel Catalysts Market Volume Share (%), by Industry Vertical 2025 & 2033
- Figure 59: South America Aluminum Nickel Catalysts Market Revenue (Million), by Application 2025 & 2033
- Figure 60: South America Aluminum Nickel Catalysts Market Volume (K Tons), by Application 2025 & 2033
- Figure 61: South America Aluminum Nickel Catalysts Market Revenue Share (%), by Application 2025 & 2033
- Figure 62: South America Aluminum Nickel Catalysts Market Volume Share (%), by Application 2025 & 2033
- Figure 63: South America Aluminum Nickel Catalysts Market Revenue (Million), by Country 2025 & 2033
- Figure 64: South America Aluminum Nickel Catalysts Market Volume (K Tons), by Country 2025 & 2033
- Figure 65: South America Aluminum Nickel Catalysts Market Revenue Share (%), by Country 2025 & 2033
- Figure 66: South America Aluminum Nickel Catalysts Market Volume Share (%), by Country 2025 & 2033
- Figure 67: Middle East and Africa Aluminum Nickel Catalysts Market Revenue (Million), by Type 2025 & 2033
- Figure 68: Middle East and Africa Aluminum Nickel Catalysts Market Volume (K Tons), by Type 2025 & 2033
- Figure 69: Middle East and Africa Aluminum Nickel Catalysts Market Revenue Share (%), by Type 2025 & 2033
- Figure 70: Middle East and Africa Aluminum Nickel Catalysts Market Volume Share (%), by Type 2025 & 2033
- Figure 71: Middle East and Africa Aluminum Nickel Catalysts Market Revenue (Million), by Industry Vertical 2025 & 2033
- Figure 72: Middle East and Africa Aluminum Nickel Catalysts Market Volume (K Tons), by Industry Vertical 2025 & 2033
- Figure 73: Middle East and Africa Aluminum Nickel Catalysts Market Revenue Share (%), by Industry Vertical 2025 & 2033
- Figure 74: Middle East and Africa Aluminum Nickel Catalysts Market Volume Share (%), by Industry Vertical 2025 & 2033
- Figure 75: Middle East and Africa Aluminum Nickel Catalysts Market Revenue (Million), by Application 2025 & 2033
- Figure 76: Middle East and Africa Aluminum Nickel Catalysts Market Volume (K Tons), by Application 2025 & 2033
- Figure 77: Middle East and Africa Aluminum Nickel Catalysts Market Revenue Share (%), by Application 2025 & 2033
- Figure 78: Middle East and Africa Aluminum Nickel Catalysts Market Volume Share (%), by Application 2025 & 2033
- Figure 79: Middle East and Africa Aluminum Nickel Catalysts Market Revenue (Million), by Country 2025 & 2033
- Figure 80: Middle East and Africa Aluminum Nickel Catalysts Market Volume (K Tons), by Country 2025 & 2033
- Figure 81: Middle East and Africa Aluminum Nickel Catalysts Market Revenue Share (%), by Country 2025 & 2033
- Figure 82: Middle East and Africa Aluminum Nickel Catalysts Market Volume Share (%), by Country 2025 & 2033
List of Tables
- Table 1: Global Aluminum Nickel Catalysts Market Revenue Million Forecast, by Type 2020 & 2033
- Table 2: Global Aluminum Nickel Catalysts Market Volume K Tons Forecast, by Type 2020 & 2033
- Table 3: Global Aluminum Nickel Catalysts Market Revenue Million Forecast, by Industry Vertical 2020 & 2033
- Table 4: Global Aluminum Nickel Catalysts Market Volume K Tons Forecast, by Industry Vertical 2020 & 2033
- Table 5: Global Aluminum Nickel Catalysts Market Revenue Million Forecast, by Application 2020 & 2033
- Table 6: Global Aluminum Nickel Catalysts Market Volume K Tons Forecast, by Application 2020 & 2033
- Table 7: Global Aluminum Nickel Catalysts Market Revenue Million Forecast, by Region 2020 & 2033
- Table 8: Global Aluminum Nickel Catalysts Market Volume K Tons Forecast, by Region 2020 & 2033
- Table 9: Global Aluminum Nickel Catalysts Market Revenue Million Forecast, by Type 2020 & 2033
- Table 10: Global Aluminum Nickel Catalysts Market Volume K Tons Forecast, by Type 2020 & 2033
- Table 11: Global Aluminum Nickel Catalysts Market Revenue Million Forecast, by Industry Vertical 2020 & 2033
- Table 12: Global Aluminum Nickel Catalysts Market Volume K Tons Forecast, by Industry Vertical 2020 & 2033
- Table 13: Global Aluminum Nickel Catalysts Market Revenue Million Forecast, by Application 2020 & 2033
- Table 14: Global Aluminum Nickel Catalysts Market Volume K Tons Forecast, by Application 2020 & 2033
- Table 15: Global Aluminum Nickel Catalysts Market Revenue Million Forecast, by Country 2020 & 2033
- Table 16: Global Aluminum Nickel Catalysts Market Volume K Tons Forecast, by Country 2020 & 2033
- Table 17: China Aluminum Nickel Catalysts Market Revenue (Million) Forecast, by Application 2020 & 2033
- Table 18: China Aluminum Nickel Catalysts Market Volume (K Tons) Forecast, by Application 2020 & 2033
- Table 19: India Aluminum Nickel Catalysts Market Revenue (Million) Forecast, by Application 2020 & 2033
- Table 20: India Aluminum Nickel Catalysts Market Volume (K Tons) Forecast, by Application 2020 & 2033
- Table 21: Japan Aluminum Nickel Catalysts Market Revenue (Million) Forecast, by Application 2020 & 2033
- Table 22: Japan Aluminum Nickel Catalysts Market Volume (K Tons) Forecast, by Application 2020 & 2033
- Table 23: South Korea Aluminum Nickel Catalysts Market Revenue (Million) Forecast, by Application 2020 & 2033
- Table 24: South Korea Aluminum Nickel Catalysts Market Volume (K Tons) Forecast, by Application 2020 & 2033
- Table 25: Rest of Asia Pacific Aluminum Nickel Catalysts Market Revenue (Million) Forecast, by Application 2020 & 2033
- Table 26: Rest of Asia Pacific Aluminum Nickel Catalysts Market Volume (K Tons) Forecast, by Application 2020 & 2033
- Table 27: Global Aluminum Nickel Catalysts Market Revenue Million Forecast, by Type 2020 & 2033
- Table 28: Global Aluminum Nickel Catalysts Market Volume K Tons Forecast, by Type 2020 & 2033
- Table 29: Global Aluminum Nickel Catalysts Market Revenue Million Forecast, by Industry Vertical 2020 & 2033
- Table 30: Global Aluminum Nickel Catalysts Market Volume K Tons Forecast, by Industry Vertical 2020 & 2033
- Table 31: Global Aluminum Nickel Catalysts Market Revenue Million Forecast, by Application 2020 & 2033
- Table 32: Global Aluminum Nickel Catalysts Market Volume K Tons Forecast, by Application 2020 & 2033
- Table 33: Global Aluminum Nickel Catalysts Market Revenue Million Forecast, by Country 2020 & 2033
- Table 34: Global Aluminum Nickel Catalysts Market Volume K Tons Forecast, by Country 2020 & 2033
- Table 35: United States Aluminum Nickel Catalysts Market Revenue (Million) Forecast, by Application 2020 & 2033
- Table 36: United States Aluminum Nickel Catalysts Market Volume (K Tons) Forecast, by Application 2020 & 2033
- Table 37: Canada Aluminum Nickel Catalysts Market Revenue (Million) Forecast, by Application 2020 & 2033
- Table 38: Canada Aluminum Nickel Catalysts Market Volume (K Tons) Forecast, by Application 2020 & 2033
- Table 39: Mexico Aluminum Nickel Catalysts Market Revenue (Million) Forecast, by Application 2020 & 2033
- Table 40: Mexico Aluminum Nickel Catalysts Market Volume (K Tons) Forecast, by Application 2020 & 2033
- Table 41: Global Aluminum Nickel Catalysts Market Revenue Million Forecast, by Type 2020 & 2033
- Table 42: Global Aluminum Nickel Catalysts Market Volume K Tons Forecast, by Type 2020 & 2033
- Table 43: Global Aluminum Nickel Catalysts Market Revenue Million Forecast, by Industry Vertical 2020 & 2033
- Table 44: Global Aluminum Nickel Catalysts Market Volume K Tons Forecast, by Industry Vertical 2020 & 2033
- Table 45: Global Aluminum Nickel Catalysts Market Revenue Million Forecast, by Application 2020 & 2033
- Table 46: Global Aluminum Nickel Catalysts Market Volume K Tons Forecast, by Application 2020 & 2033
- Table 47: Global Aluminum Nickel Catalysts Market Revenue Million Forecast, by Country 2020 & 2033
- Table 48: Global Aluminum Nickel Catalysts Market Volume K Tons Forecast, by Country 2020 & 2033
- Table 49: Germany Aluminum Nickel Catalysts Market Revenue (Million) Forecast, by Application 2020 & 2033
- Table 50: Germany Aluminum Nickel Catalysts Market Volume (K Tons) Forecast, by Application 2020 & 2033
- Table 51: France Aluminum Nickel Catalysts Market Revenue (Million) Forecast, by Application 2020 & 2033
- Table 52: France Aluminum Nickel Catalysts Market Volume (K Tons) Forecast, by Application 2020 & 2033
- Table 53: Italy Aluminum Nickel Catalysts Market Revenue (Million) Forecast, by Application 2020 & 2033
- Table 54: Italy Aluminum Nickel Catalysts Market Volume (K Tons) Forecast, by Application 2020 & 2033
- Table 55: Spain Aluminum Nickel Catalysts Market Revenue (Million) Forecast, by Application 2020 & 2033
- Table 56: Spain Aluminum Nickel Catalysts Market Volume (K Tons) Forecast, by Application 2020 & 2033
- Table 57: Russia Aluminum Nickel Catalysts Market Revenue (Million) Forecast, by Application 2020 & 2033
- Table 58: Russia Aluminum Nickel Catalysts Market Volume (K Tons) Forecast, by Application 2020 & 2033
- Table 59: Rest of Europe Aluminum Nickel Catalysts Market Revenue (Million) Forecast, by Application 2020 & 2033
- Table 60: Rest of Europe Aluminum Nickel Catalysts Market Volume (K Tons) Forecast, by Application 2020 & 2033
- Table 61: Global Aluminum Nickel Catalysts Market Revenue Million Forecast, by Type 2020 & 2033
- Table 62: Global Aluminum Nickel Catalysts Market Volume K Tons Forecast, by Type 2020 & 2033
- Table 63: Global Aluminum Nickel Catalysts Market Revenue Million Forecast, by Industry Vertical 2020 & 2033
- Table 64: Global Aluminum Nickel Catalysts Market Volume K Tons Forecast, by Industry Vertical 2020 & 2033
- Table 65: Global Aluminum Nickel Catalysts Market Revenue Million Forecast, by Application 2020 & 2033
- Table 66: Global Aluminum Nickel Catalysts Market Volume K Tons Forecast, by Application 2020 & 2033
- Table 67: Global Aluminum Nickel Catalysts Market Revenue Million Forecast, by Country 2020 & 2033
- Table 68: Global Aluminum Nickel Catalysts Market Volume K Tons Forecast, by Country 2020 & 2033
- Table 69: Brazil Aluminum Nickel Catalysts Market Revenue (Million) Forecast, by Application 2020 & 2033
- Table 70: Brazil Aluminum Nickel Catalysts Market Volume (K Tons) Forecast, by Application 2020 & 2033
- Table 71: Argentina Aluminum Nickel Catalysts Market Revenue (Million) Forecast, by Application 2020 & 2033
- Table 72: Argentina Aluminum Nickel Catalysts Market Volume (K Tons) Forecast, by Application 2020 & 2033
- Table 73: Rest of South America Aluminum Nickel Catalysts Market Revenue (Million) Forecast, by Application 2020 & 2033
- Table 74: Rest of South America Aluminum Nickel Catalysts Market Volume (K Tons) Forecast, by Application 2020 & 2033
- Table 75: Global Aluminum Nickel Catalysts Market Revenue Million Forecast, by Type 2020 & 2033
- Table 76: Global Aluminum Nickel Catalysts Market Volume K Tons Forecast, by Type 2020 & 2033
- Table 77: Global Aluminum Nickel Catalysts Market Revenue Million Forecast, by Industry Vertical 2020 & 2033
- Table 78: Global Aluminum Nickel Catalysts Market Volume K Tons Forecast, by Industry Vertical 2020 & 2033
- Table 79: Global Aluminum Nickel Catalysts Market Revenue Million Forecast, by Application 2020 & 2033
- Table 80: Global Aluminum Nickel Catalysts Market Volume K Tons Forecast, by Application 2020 & 2033
- Table 81: Global Aluminum Nickel Catalysts Market Revenue Million Forecast, by Country 2020 & 2033
- Table 82: Global Aluminum Nickel Catalysts Market Volume K Tons Forecast, by Country 2020 & 2033
- Table 83: Saudi Arabia Aluminum Nickel Catalysts Market Revenue (Million) Forecast, by Application 2020 & 2033
- Table 84: Saudi Arabia Aluminum Nickel Catalysts Market Volume (K Tons) Forecast, by Application 2020 & 2033
- Table 85: South Africa Aluminum Nickel Catalysts Market Revenue (Million) Forecast, by Application 2020 & 2033
- Table 86: South Africa Aluminum Nickel Catalysts Market Volume (K Tons) Forecast, by Application 2020 & 2033
- Table 87: Rest of Middle East and Africa Aluminum Nickel Catalysts Market Revenue (Million) Forecast, by Application 2020 & 2033
- Table 88: Rest of Middle East and Africa Aluminum Nickel Catalysts Market Volume (K Tons) Forecast, by Application 2020 & 2033
Frequently Asked Questions
1. What is the projected Compound Annual Growth Rate (CAGR) of the Aluminum Nickel Catalysts Market?
The projected CAGR is approximately > 4.00%.
2. Which companies are prominent players in the Aluminum Nickel Catalysts Market?
Key companies in the market include Axens, Clariant, Merck KGaA, W R Grace & Co, Evonik Industries AG, BASF SE, Alfa Aesar Thermo Fisher Scientific, Johnson Matthey, Vineeth Precious Catalysts Pvt Ltd, Haldor Topsoe AS, Hangzhou JiaLi Metals Sci&Tech Limited Corporation.
3. What are the main segments of the Aluminum Nickel Catalysts Market?
The market segments include Type, Industry Vertical, Application.
4. Can you provide details about the market size?
The market size is estimated to be USD 417.94 Million as of 2022.
5. What are some drivers contributing to market growth?
Augmenting Demand for Hydrogenation Reactions; Growing Demand for Renewable Fuels and Chemicals; Other Drivers.
6. What are the notable trends driving market growth?
Soaring Demand From Hydrogenation Applications.
7. Are there any restraints impacting market growth?
Availability of Alternative Catalysts; Low Stability and Safety Issues.
8. Can you provide examples of recent developments in the market?
N/A
9. What pricing options are available for accessing the report?
Pricing options include single-user, multi-user, and enterprise licenses priced at USD 4750, USD 5250, and USD 8750 respectively.
10. Is the market size provided in terms of value or volume?
The market size is provided in terms of value, measured in Million and volume, measured in K Tons.
11. Are there any specific market keywords associated with the report?
Yes, the market keyword associated with the report is "Aluminum Nickel Catalysts Market," which aids in identifying and referencing the specific market segment covered.
12. How do I determine which pricing option suits my needs best?
The pricing options vary based on user requirements and access needs. Individual users may opt for single-user licenses, while businesses requiring broader access may choose multi-user or enterprise licenses for cost-effective access to the report.
13. Are there any additional resources or data provided in the Aluminum Nickel Catalysts Market report?
While the report offers comprehensive insights, it's advisable to review the specific contents or supplementary materials provided to ascertain if additional resources or data are available.
14. How can I stay updated on further developments or reports in the Aluminum Nickel Catalysts Market?
To stay informed about further developments, trends, and reports in the Aluminum Nickel Catalysts Market, consider subscribing to industry newsletters, following relevant companies and organizations, or regularly checking reputable industry news sources and publications.
Methodology
Step 1 - Identification of Relevant Samples Size from Population Database


Step 2 - Approaches for Defining Global Market Size (Value, Volume* & Price*)

Note*: In applicable scenarios
Step 3 - Data Sources
Primary Research
- Web Analytics
- Survey Reports
- Research Institute
- Latest Research Reports
- Opinion Leaders
Secondary Research
- Annual Reports
- White Paper
- Latest Press Release
- Industry Association
- Paid Database
- Investor Presentations

Step 4 - Data Triangulation
Involves using different sources of information in order to increase the validity of a study
These sources are likely to be stakeholders in a program - participants, other researchers, program staff, other community members, and so on.
Then we put all data in single framework & apply various statistical tools to find out the dynamic on the market.
During the analysis stage, feedback from the stakeholder groups would be compared to determine areas of agreement as well as areas of divergence