


Key Insights
The global aluminum aerosol can market, valued at approximately $7.72 billion, is projected for robust growth with a Compound Annual Growth Rate (CAGR) of 4.62% from 2025 to 2033. This expansion is propelled by escalating demand for convenient packaging across personal care, household, and automotive sectors. Aluminum's inherent lightweight and recyclability align with increasing consumer preference for sustainable solutions. Technological advancements in manufacturing also contribute to market gains. Despite potential challenges such as aluminum price volatility and competing packaging materials, the market outlook remains positive due to sustained demand for aerosol cans in both established and emerging economies. The market is segmented by material type and end-user industries, with personal and household care leading. While North America and Europe currently dominate, the Asia-Pacific region, particularly China and India, is poised for significant growth driven by rising disposable incomes.
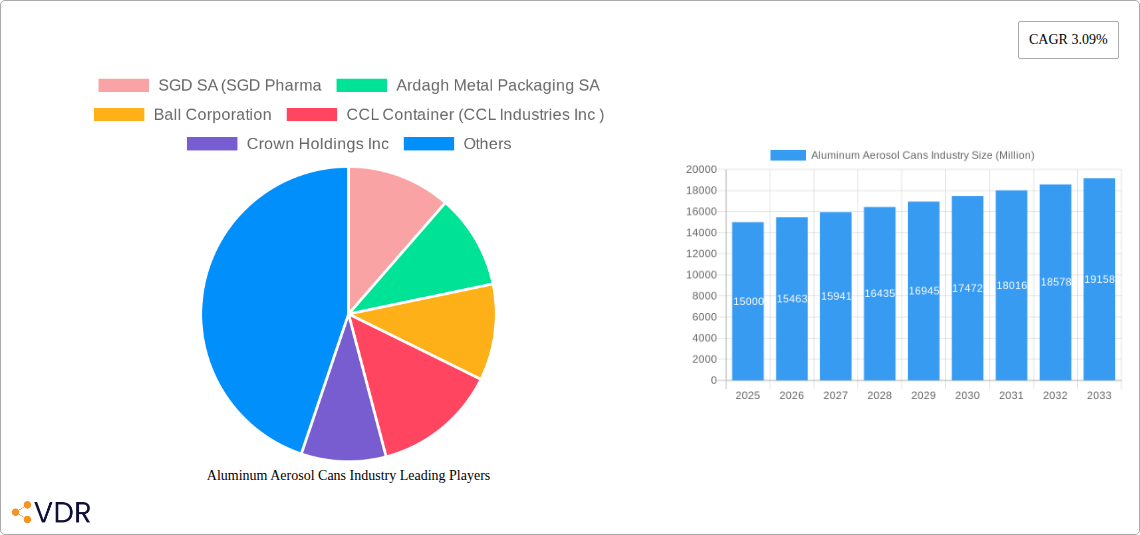
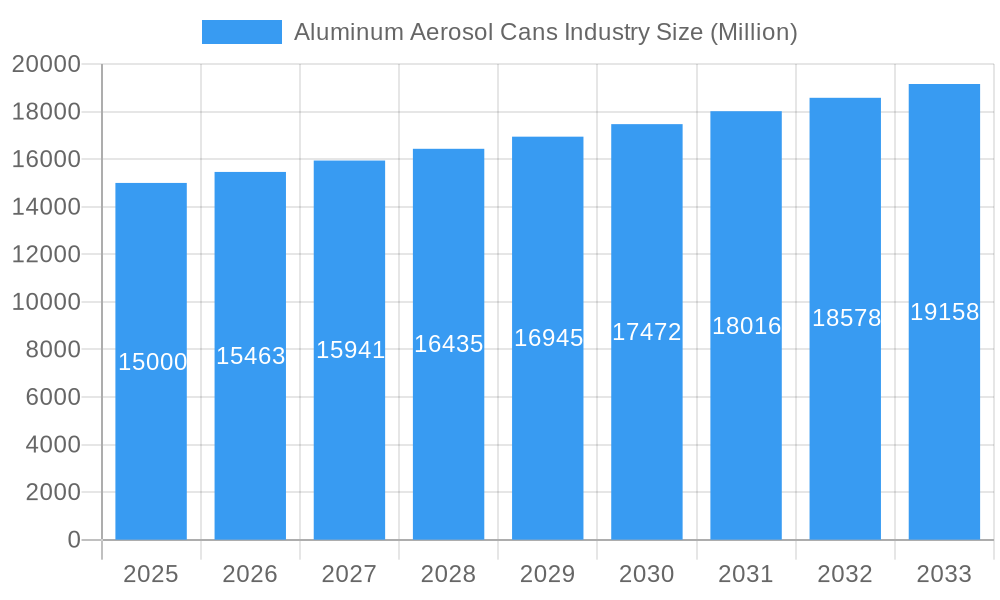
Aluminum Aerosol Cans Industry Market Size (In Billion)

The competitive landscape features major global corporations and regional players. Key participants, including Ball Corporation, Crown Holdings Inc., and Ardagh Metal Packaging SA, are actively innovating to enhance product offerings and market reach. The industry's focus on sustainability presents opportunities for companies developing lightweight and recyclable designs. Diverse consumer preferences and regulatory frameworks across regions offer both challenges and opportunities. Future success will depend on addressing sustainability concerns, adapting to evolving consumer demands, and effectively managing raw material price fluctuations. Strategic partnerships and acquisitions are anticipated to further shape the competitive environment.
Aluminum Aerosol Cans Industry Company Market Share
Aluminum Aerosol Cans Industry Market Report: 2025-2033
This comprehensive report analyzes the aluminum aerosol cans industry, covering market dynamics, growth trends, key players, and future projections. The base year for this analysis is 2025, with a forecast period extending to 2033. The market is segmented by material type (steel, aluminum, other) and end-user industry (personal care, household care, automotive, healthcare, others), providing granular insights into this dynamic sector. This report is crucial for industry professionals, investors, and strategic decision-makers seeking a thorough understanding of this multi-billion dollar market.
Aluminum Aerosol Cans Industry Market Dynamics & Structure
The aluminum aerosol can market is characterized by moderate concentration, with several major players holding significant market share. Technological innovation, particularly in sustainable materials and recyclable designs, is a key driver. Stringent environmental regulations are shaping industry practices, pushing manufacturers towards eco-friendly solutions. The market faces competition from alternative packaging formats, but aluminum's lightweight, barrier, and recyclability properties maintain its dominance in several segments. Mergers and acquisitions (M&A) activity remains relatively consistent, with larger players seeking to expand their market presence and product portfolios. The consumer preference shift towards sustainable and convenient packaging, particularly for personal care products, is a crucial factor.
- Market Concentration: Moderately concentrated, with the top 10 players holding approximately xx% of the market share in 2024 (estimated).
- Technological Innovation: Focus on lightweighting, recyclability, and sustainable materials.
- Regulatory Frameworks: Increasingly stringent environmental regulations driving sustainable packaging solutions.
- Competitive Substitutes: Plastic and other alternative packaging formats pose a competitive threat.
- M&A Activity: An average of xx M&A deals per year were observed during the historical period (2019-2024).
- Innovation Barriers: High initial investment costs for new technologies and difficulties in scaling sustainable production.
Aluminum Aerosol Cans Industry Growth Trends & Insights
The global aluminum aerosol cans market experienced significant growth during the historical period (2019-2024), driven primarily by the expanding personal care and household care sectors. The market size reached xx million units in 2024 (estimated). The increasing demand for convenient and portable products, coupled with the growing popularity of aerosol-based formulations, fueled market expansion. Technological advancements in can manufacturing and design, including improved recyclability and lightweighting, contributed to growth. However, concerns about the environmental impact of aerosol propellants and the rise of alternative packaging solutions pose challenges. The market is expected to witness a Compound Annual Growth Rate (CAGR) of xx% during the forecast period (2025-2033), reaching xx million units by 2033. Consumer preference shifts toward sustainable packaging and the adoption of eco-friendly aerosols will significantly influence future growth.
Dominant Regions, Countries, or Segments in Aluminum Aerosol Cans Industry
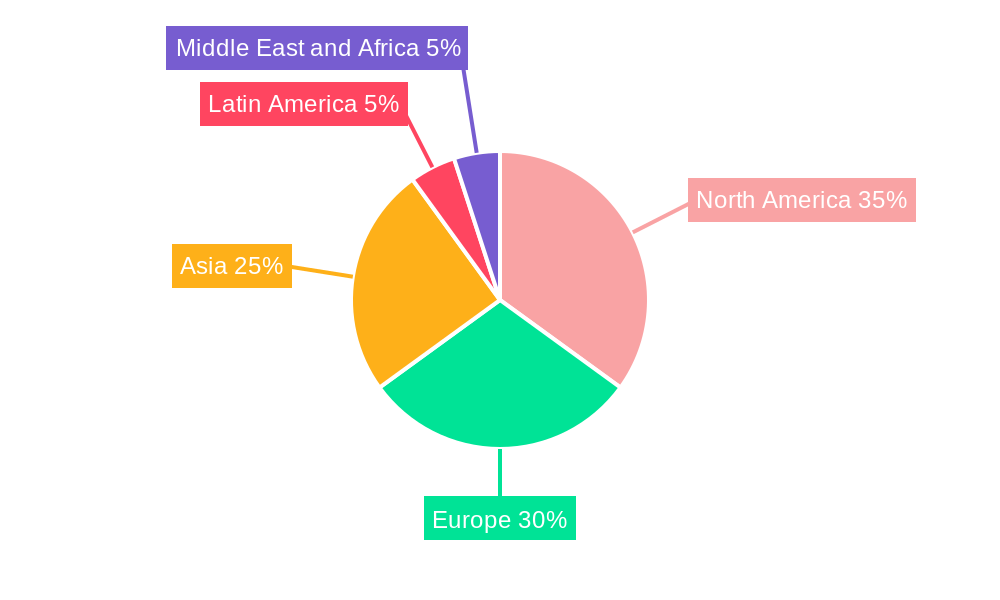
North America and Europe currently dominate the aluminum aerosol cans market, accounting for approximately xx% of the global market share in 2024 (estimated). Within these regions, the personal care segment exhibits the highest growth, driven by the increasing demand for convenient and easy-to-use cosmetic and toiletry products. Asia-Pacific is a high-growth region, with rapidly expanding economies and increasing consumer spending power.
- Dominant Region: North America
- Key Drivers (North America): Established aerosol industry, strong consumer base, and advanced recycling infrastructure.
- Dominant Segment: Personal Care (approx. xx% market share in 2024 - estimated)
- Key Drivers (Personal Care): Convenience, ease of use, and targeted product formulations.
- High-Growth Region: Asia-Pacific
- Key Drivers (Asia-Pacific): Rapid economic growth, rising disposable incomes, and increasing adoption of aerosol-based products.
Aluminum Aerosol Cans Industry Product Landscape
The aluminum aerosol can market offers a range of products tailored to diverse end-use applications, encompassing various sizes, shapes, and designs. Recent innovations focus on enhancing recyclability, reducing material weight, and improving performance. Unique selling propositions include sustainable materials, customized designs, and advanced functionalities. Technological advancements focus on improved coatings, enhanced barrier properties, and innovative dispensing mechanisms.
Key Drivers, Barriers & Challenges in Aluminum Aerosol Cans Industry
Key Drivers:
- Growing demand from personal care and household care segments.
- Increasing preference for convenient and portable products.
- Technological advancements in can design and manufacturing.
Challenges:
- Environmental concerns related to aerosol propellants and recycling.
- Competition from alternative packaging solutions.
- Fluctuations in raw material prices (aluminum).
- Stringent regulatory requirements regarding safety and environmental impact. Estimated xx% increase in regulatory compliance costs between 2024 and 2028.
Emerging Opportunities in Aluminum Aerosol Cans Industry
- Expanding into emerging markets with high growth potential.
- Developing innovative applications for aerosol cans in new industries.
- Catering to the growing demand for sustainable and eco-friendly packaging solutions.
- Focusing on product differentiation through enhanced functionality and design.
Growth Accelerators in the Aluminum Aerosol Cans Industry Industry
Technological advancements in materials science and manufacturing processes are accelerating growth. Strategic partnerships between can manufacturers and brand owners are crucial for innovation and market expansion. Expansion into new applications and markets, such as food and beverage, holds significant growth potential.
Key Players Shaping the Aluminum Aerosol Cans Industry Market
- SGD SA (SGD Pharma)
- Ardagh Metal Packaging SA
- Ball Corporation
- CCL Container (CCL Industries Inc)
- Crown Holdings Inc
- Trivium Packaging
- Graham Packaging Company
- Colep Packaging Portugal SA
- Mauser Packaging Solutions (Bway Corporation)
- CPMC Holdings Limited
- Toyo Seikan Co Ltd
- NAMPAK Ltd
Notable Milestones in Aluminum Aerosol Cans Industry Sector
- February 2024: Lindal Group partners with the UK Aerosol Recycling Initiative, aiming for a 50% recycling rate by 2030.
- February 2024: Unilever launches Lynx Fine Fragrance Collection in 150ml aerosol cans, targeting Gen Z males.
In-Depth Aluminum Aerosol Cans Industry Market Outlook
The aluminum aerosol cans market is poised for continued growth, driven by sustained demand from key end-use segments and the increasing focus on sustainability. Strategic investments in research and development, coupled with innovative product offerings and expansion into new markets, will be key success factors. The market's future is bright, with substantial opportunities for growth and innovation.
Aluminum Aerosol Cans Industry Segmentation
-
1. Material Type
- 1.1. Steel
- 1.2. Aluminium
- 1.3. Other Material Type
-
2. End-user Industry
- 2.1. Personal Care
- 2.2. Household Care
- 2.3. Automotive
- 2.4. Healthcare
- 2.5. Other End-user Industries
Aluminum Aerosol Cans Industry Segmentation By Geography
-
1. North America
- 1.1. United States
- 1.2. Canada
-
2. Europe
- 2.1. France
- 2.2. Germany
- 2.3. Italy
- 2.4. Spain
- 2.5. United Kingdom
-
3. Asia
- 3.1. China
- 3.2. India
- 3.3. Japan
- 4. Australia and New Zealand
-
5. Latin America
- 5.1. Brazil
- 5.2. Argentina
- 5.3. Mexico
-
6. Middle East and Africa
- 6.1. Saudi Arabia
- 6.2. United Arab Emirates
- 6.3. South Africa
Aluminum Aerosol Cans Industry Regional Market Share
Geographic Coverage of Aluminum Aerosol Cans Industry
Aluminum Aerosol Cans Industry REPORT HIGHLIGHTS
| Aspects | Details |
|---|---|
| Study Period | 2020-2034 |
| Base Year | 2025 |
| Estimated Year | 2026 |
| Forecast Period | 2026-2034 |
| Historical Period | 2020-2025 |
| Growth Rate | CAGR of 4.62% from 2020-2034 |
| Segmentation |
|
Table of Contents
- 1. Introduction
- 1.1. Research Scope
- 1.2. Market Segmentation
- 1.3. Research Methodology
- 1.4. Definitions and Assumptions
- 2. Executive Summary
- 2.1. Introduction
- 3. Market Dynamics
- 3.1. Introduction
- 3.2. Market Drivers
- 3.2.1. Recyclability of Aerosol Cans; Growing Demand from the Personal Care and Cosmetics Industry
- 3.3. Market Restrains
- 3.3.1. Stringent Regulations Regarding Waste Disposal
- 3.4. Market Trends
- 3.4.1. The Automotive Industry to be the Fastest Growing End User
- 4. Market Factor Analysis
- 4.1. Porters Five Forces
- 4.2. Supply/Value Chain
- 4.3. PESTEL analysis
- 4.4. Market Entropy
- 4.5. Patent/Trademark Analysis
- 5. Global Aluminum Aerosol Cans Industry Analysis, Insights and Forecast, 2020-2032
- 5.1. Market Analysis, Insights and Forecast - by Material Type
- 5.1.1. Steel
- 5.1.2. Aluminium
- 5.1.3. Other Material Type
- 5.2. Market Analysis, Insights and Forecast - by End-user Industry
- 5.2.1. Personal Care
- 5.2.2. Household Care
- 5.2.3. Automotive
- 5.2.4. Healthcare
- 5.2.5. Other End-user Industries
- 5.3. Market Analysis, Insights and Forecast - by Region
- 5.3.1. North America
- 5.3.2. Europe
- 5.3.3. Asia
- 5.3.4. Australia and New Zealand
- 5.3.5. Latin America
- 5.3.6. Middle East and Africa
- 5.1. Market Analysis, Insights and Forecast - by Material Type
- 6. North America Aluminum Aerosol Cans Industry Analysis, Insights and Forecast, 2020-2032
- 6.1. Market Analysis, Insights and Forecast - by Material Type
- 6.1.1. Steel
- 6.1.2. Aluminium
- 6.1.3. Other Material Type
- 6.2. Market Analysis, Insights and Forecast - by End-user Industry
- 6.2.1. Personal Care
- 6.2.2. Household Care
- 6.2.3. Automotive
- 6.2.4. Healthcare
- 6.2.5. Other End-user Industries
- 6.1. Market Analysis, Insights and Forecast - by Material Type
- 7. Europe Aluminum Aerosol Cans Industry Analysis, Insights and Forecast, 2020-2032
- 7.1. Market Analysis, Insights and Forecast - by Material Type
- 7.1.1. Steel
- 7.1.2. Aluminium
- 7.1.3. Other Material Type
- 7.2. Market Analysis, Insights and Forecast - by End-user Industry
- 7.2.1. Personal Care
- 7.2.2. Household Care
- 7.2.3. Automotive
- 7.2.4. Healthcare
- 7.2.5. Other End-user Industries
- 7.1. Market Analysis, Insights and Forecast - by Material Type
- 8. Asia Aluminum Aerosol Cans Industry Analysis, Insights and Forecast, 2020-2032
- 8.1. Market Analysis, Insights and Forecast - by Material Type
- 8.1.1. Steel
- 8.1.2. Aluminium
- 8.1.3. Other Material Type
- 8.2. Market Analysis, Insights and Forecast - by End-user Industry
- 8.2.1. Personal Care
- 8.2.2. Household Care
- 8.2.3. Automotive
- 8.2.4. Healthcare
- 8.2.5. Other End-user Industries
- 8.1. Market Analysis, Insights and Forecast - by Material Type
- 9. Australia and New Zealand Aluminum Aerosol Cans Industry Analysis, Insights and Forecast, 2020-2032
- 9.1. Market Analysis, Insights and Forecast - by Material Type
- 9.1.1. Steel
- 9.1.2. Aluminium
- 9.1.3. Other Material Type
- 9.2. Market Analysis, Insights and Forecast - by End-user Industry
- 9.2.1. Personal Care
- 9.2.2. Household Care
- 9.2.3. Automotive
- 9.2.4. Healthcare
- 9.2.5. Other End-user Industries
- 9.1. Market Analysis, Insights and Forecast - by Material Type
- 10. Latin America Aluminum Aerosol Cans Industry Analysis, Insights and Forecast, 2020-2032
- 10.1. Market Analysis, Insights and Forecast - by Material Type
- 10.1.1. Steel
- 10.1.2. Aluminium
- 10.1.3. Other Material Type
- 10.2. Market Analysis, Insights and Forecast - by End-user Industry
- 10.2.1. Personal Care
- 10.2.2. Household Care
- 10.2.3. Automotive
- 10.2.4. Healthcare
- 10.2.5. Other End-user Industries
- 10.1. Market Analysis, Insights and Forecast - by Material Type
- 11. Middle East and Africa Aluminum Aerosol Cans Industry Analysis, Insights and Forecast, 2020-2032
- 11.1. Market Analysis, Insights and Forecast - by Material Type
- 11.1.1. Steel
- 11.1.2. Aluminium
- 11.1.3. Other Material Type
- 11.2. Market Analysis, Insights and Forecast - by End-user Industry
- 11.2.1. Personal Care
- 11.2.2. Household Care
- 11.2.3. Automotive
- 11.2.4. Healthcare
- 11.2.5. Other End-user Industries
- 11.1. Market Analysis, Insights and Forecast - by Material Type
- 12. Competitive Analysis
- 12.1. Global Market Share Analysis 2025
- 12.2. Company Profiles
- 12.2.1 SGD SA (SGD Pharma
- 12.2.1.1. Overview
- 12.2.1.2. Products
- 12.2.1.3. SWOT Analysis
- 12.2.1.4. Recent Developments
- 12.2.1.5. Financials (Based on Availability)
- 12.2.2 Ardagh Metal Packaging SA
- 12.2.2.1. Overview
- 12.2.2.2. Products
- 12.2.2.3. SWOT Analysis
- 12.2.2.4. Recent Developments
- 12.2.2.5. Financials (Based on Availability)
- 12.2.3 Ball Corporation
- 12.2.3.1. Overview
- 12.2.3.2. Products
- 12.2.3.3. SWOT Analysis
- 12.2.3.4. Recent Developments
- 12.2.3.5. Financials (Based on Availability)
- 12.2.4 CCL Container (CCL Industries Inc )
- 12.2.4.1. Overview
- 12.2.4.2. Products
- 12.2.4.3. SWOT Analysis
- 12.2.4.4. Recent Developments
- 12.2.4.5. Financials (Based on Availability)
- 12.2.5 Crown Holdings Inc
- 12.2.5.1. Overview
- 12.2.5.2. Products
- 12.2.5.3. SWOT Analysis
- 12.2.5.4. Recent Developments
- 12.2.5.5. Financials (Based on Availability)
- 12.2.6 Trivium Packaging
- 12.2.6.1. Overview
- 12.2.6.2. Products
- 12.2.6.3. SWOT Analysis
- 12.2.6.4. Recent Developments
- 12.2.6.5. Financials (Based on Availability)
- 12.2.7 Graham Packaging Company
- 12.2.7.1. Overview
- 12.2.7.2. Products
- 12.2.7.3. SWOT Analysis
- 12.2.7.4. Recent Developments
- 12.2.7.5. Financials (Based on Availability)
- 12.2.8 Colep Packaging Portugal SA
- 12.2.8.1. Overview
- 12.2.8.2. Products
- 12.2.8.3. SWOT Analysis
- 12.2.8.4. Recent Developments
- 12.2.8.5. Financials (Based on Availability)
- 12.2.9 Mauser Packaging Solutions (Bway Corporation)
- 12.2.9.1. Overview
- 12.2.9.2. Products
- 12.2.9.3. SWOT Analysis
- 12.2.9.4. Recent Developments
- 12.2.9.5. Financials (Based on Availability)
- 12.2.10 CPMC Holdings Limited
- 12.2.10.1. Overview
- 12.2.10.2. Products
- 12.2.10.3. SWOT Analysis
- 12.2.10.4. Recent Developments
- 12.2.10.5. Financials (Based on Availability)
- 12.2.11 Toyo Seikan Co Ltd
- 12.2.11.1. Overview
- 12.2.11.2. Products
- 12.2.11.3. SWOT Analysis
- 12.2.11.4. Recent Developments
- 12.2.11.5. Financials (Based on Availability)
- 12.2.12 NAMPAK Ltd
- 12.2.12.1. Overview
- 12.2.12.2. Products
- 12.2.12.3. SWOT Analysis
- 12.2.12.4. Recent Developments
- 12.2.12.5. Financials (Based on Availability)
- 12.2.1 SGD SA (SGD Pharma
List of Figures
- Figure 1: Global Aluminum Aerosol Cans Industry Revenue Breakdown (billion, %) by Region 2025 & 2033
- Figure 2: Global Aluminum Aerosol Cans Industry Volume Breakdown (Billion, %) by Region 2025 & 2033
- Figure 3: North America Aluminum Aerosol Cans Industry Revenue (billion), by Material Type 2025 & 2033
- Figure 4: North America Aluminum Aerosol Cans Industry Volume (Billion), by Material Type 2025 & 2033
- Figure 5: North America Aluminum Aerosol Cans Industry Revenue Share (%), by Material Type 2025 & 2033
- Figure 6: North America Aluminum Aerosol Cans Industry Volume Share (%), by Material Type 2025 & 2033
- Figure 7: North America Aluminum Aerosol Cans Industry Revenue (billion), by End-user Industry 2025 & 2033
- Figure 8: North America Aluminum Aerosol Cans Industry Volume (Billion), by End-user Industry 2025 & 2033
- Figure 9: North America Aluminum Aerosol Cans Industry Revenue Share (%), by End-user Industry 2025 & 2033
- Figure 10: North America Aluminum Aerosol Cans Industry Volume Share (%), by End-user Industry 2025 & 2033
- Figure 11: North America Aluminum Aerosol Cans Industry Revenue (billion), by Country 2025 & 2033
- Figure 12: North America Aluminum Aerosol Cans Industry Volume (Billion), by Country 2025 & 2033
- Figure 13: North America Aluminum Aerosol Cans Industry Revenue Share (%), by Country 2025 & 2033
- Figure 14: North America Aluminum Aerosol Cans Industry Volume Share (%), by Country 2025 & 2033
- Figure 15: Europe Aluminum Aerosol Cans Industry Revenue (billion), by Material Type 2025 & 2033
- Figure 16: Europe Aluminum Aerosol Cans Industry Volume (Billion), by Material Type 2025 & 2033
- Figure 17: Europe Aluminum Aerosol Cans Industry Revenue Share (%), by Material Type 2025 & 2033
- Figure 18: Europe Aluminum Aerosol Cans Industry Volume Share (%), by Material Type 2025 & 2033
- Figure 19: Europe Aluminum Aerosol Cans Industry Revenue (billion), by End-user Industry 2025 & 2033
- Figure 20: Europe Aluminum Aerosol Cans Industry Volume (Billion), by End-user Industry 2025 & 2033
- Figure 21: Europe Aluminum Aerosol Cans Industry Revenue Share (%), by End-user Industry 2025 & 2033
- Figure 22: Europe Aluminum Aerosol Cans Industry Volume Share (%), by End-user Industry 2025 & 2033
- Figure 23: Europe Aluminum Aerosol Cans Industry Revenue (billion), by Country 2025 & 2033
- Figure 24: Europe Aluminum Aerosol Cans Industry Volume (Billion), by Country 2025 & 2033
- Figure 25: Europe Aluminum Aerosol Cans Industry Revenue Share (%), by Country 2025 & 2033
- Figure 26: Europe Aluminum Aerosol Cans Industry Volume Share (%), by Country 2025 & 2033
- Figure 27: Asia Aluminum Aerosol Cans Industry Revenue (billion), by Material Type 2025 & 2033
- Figure 28: Asia Aluminum Aerosol Cans Industry Volume (Billion), by Material Type 2025 & 2033
- Figure 29: Asia Aluminum Aerosol Cans Industry Revenue Share (%), by Material Type 2025 & 2033
- Figure 30: Asia Aluminum Aerosol Cans Industry Volume Share (%), by Material Type 2025 & 2033
- Figure 31: Asia Aluminum Aerosol Cans Industry Revenue (billion), by End-user Industry 2025 & 2033
- Figure 32: Asia Aluminum Aerosol Cans Industry Volume (Billion), by End-user Industry 2025 & 2033
- Figure 33: Asia Aluminum Aerosol Cans Industry Revenue Share (%), by End-user Industry 2025 & 2033
- Figure 34: Asia Aluminum Aerosol Cans Industry Volume Share (%), by End-user Industry 2025 & 2033
- Figure 35: Asia Aluminum Aerosol Cans Industry Revenue (billion), by Country 2025 & 2033
- Figure 36: Asia Aluminum Aerosol Cans Industry Volume (Billion), by Country 2025 & 2033
- Figure 37: Asia Aluminum Aerosol Cans Industry Revenue Share (%), by Country 2025 & 2033
- Figure 38: Asia Aluminum Aerosol Cans Industry Volume Share (%), by Country 2025 & 2033
- Figure 39: Australia and New Zealand Aluminum Aerosol Cans Industry Revenue (billion), by Material Type 2025 & 2033
- Figure 40: Australia and New Zealand Aluminum Aerosol Cans Industry Volume (Billion), by Material Type 2025 & 2033
- Figure 41: Australia and New Zealand Aluminum Aerosol Cans Industry Revenue Share (%), by Material Type 2025 & 2033
- Figure 42: Australia and New Zealand Aluminum Aerosol Cans Industry Volume Share (%), by Material Type 2025 & 2033
- Figure 43: Australia and New Zealand Aluminum Aerosol Cans Industry Revenue (billion), by End-user Industry 2025 & 2033
- Figure 44: Australia and New Zealand Aluminum Aerosol Cans Industry Volume (Billion), by End-user Industry 2025 & 2033
- Figure 45: Australia and New Zealand Aluminum Aerosol Cans Industry Revenue Share (%), by End-user Industry 2025 & 2033
- Figure 46: Australia and New Zealand Aluminum Aerosol Cans Industry Volume Share (%), by End-user Industry 2025 & 2033
- Figure 47: Australia and New Zealand Aluminum Aerosol Cans Industry Revenue (billion), by Country 2025 & 2033
- Figure 48: Australia and New Zealand Aluminum Aerosol Cans Industry Volume (Billion), by Country 2025 & 2033
- Figure 49: Australia and New Zealand Aluminum Aerosol Cans Industry Revenue Share (%), by Country 2025 & 2033
- Figure 50: Australia and New Zealand Aluminum Aerosol Cans Industry Volume Share (%), by Country 2025 & 2033
- Figure 51: Latin America Aluminum Aerosol Cans Industry Revenue (billion), by Material Type 2025 & 2033
- Figure 52: Latin America Aluminum Aerosol Cans Industry Volume (Billion), by Material Type 2025 & 2033
- Figure 53: Latin America Aluminum Aerosol Cans Industry Revenue Share (%), by Material Type 2025 & 2033
- Figure 54: Latin America Aluminum Aerosol Cans Industry Volume Share (%), by Material Type 2025 & 2033
- Figure 55: Latin America Aluminum Aerosol Cans Industry Revenue (billion), by End-user Industry 2025 & 2033
- Figure 56: Latin America Aluminum Aerosol Cans Industry Volume (Billion), by End-user Industry 2025 & 2033
- Figure 57: Latin America Aluminum Aerosol Cans Industry Revenue Share (%), by End-user Industry 2025 & 2033
- Figure 58: Latin America Aluminum Aerosol Cans Industry Volume Share (%), by End-user Industry 2025 & 2033
- Figure 59: Latin America Aluminum Aerosol Cans Industry Revenue (billion), by Country 2025 & 2033
- Figure 60: Latin America Aluminum Aerosol Cans Industry Volume (Billion), by Country 2025 & 2033
- Figure 61: Latin America Aluminum Aerosol Cans Industry Revenue Share (%), by Country 2025 & 2033
- Figure 62: Latin America Aluminum Aerosol Cans Industry Volume Share (%), by Country 2025 & 2033
- Figure 63: Middle East and Africa Aluminum Aerosol Cans Industry Revenue (billion), by Material Type 2025 & 2033
- Figure 64: Middle East and Africa Aluminum Aerosol Cans Industry Volume (Billion), by Material Type 2025 & 2033
- Figure 65: Middle East and Africa Aluminum Aerosol Cans Industry Revenue Share (%), by Material Type 2025 & 2033
- Figure 66: Middle East and Africa Aluminum Aerosol Cans Industry Volume Share (%), by Material Type 2025 & 2033
- Figure 67: Middle East and Africa Aluminum Aerosol Cans Industry Revenue (billion), by End-user Industry 2025 & 2033
- Figure 68: Middle East and Africa Aluminum Aerosol Cans Industry Volume (Billion), by End-user Industry 2025 & 2033
- Figure 69: Middle East and Africa Aluminum Aerosol Cans Industry Revenue Share (%), by End-user Industry 2025 & 2033
- Figure 70: Middle East and Africa Aluminum Aerosol Cans Industry Volume Share (%), by End-user Industry 2025 & 2033
- Figure 71: Middle East and Africa Aluminum Aerosol Cans Industry Revenue (billion), by Country 2025 & 2033
- Figure 72: Middle East and Africa Aluminum Aerosol Cans Industry Volume (Billion), by Country 2025 & 2033
- Figure 73: Middle East and Africa Aluminum Aerosol Cans Industry Revenue Share (%), by Country 2025 & 2033
- Figure 74: Middle East and Africa Aluminum Aerosol Cans Industry Volume Share (%), by Country 2025 & 2033
List of Tables
- Table 1: Global Aluminum Aerosol Cans Industry Revenue billion Forecast, by Material Type 2020 & 2033
- Table 2: Global Aluminum Aerosol Cans Industry Volume Billion Forecast, by Material Type 2020 & 2033
- Table 3: Global Aluminum Aerosol Cans Industry Revenue billion Forecast, by End-user Industry 2020 & 2033
- Table 4: Global Aluminum Aerosol Cans Industry Volume Billion Forecast, by End-user Industry 2020 & 2033
- Table 5: Global Aluminum Aerosol Cans Industry Revenue billion Forecast, by Region 2020 & 2033
- Table 6: Global Aluminum Aerosol Cans Industry Volume Billion Forecast, by Region 2020 & 2033
- Table 7: Global Aluminum Aerosol Cans Industry Revenue billion Forecast, by Material Type 2020 & 2033
- Table 8: Global Aluminum Aerosol Cans Industry Volume Billion Forecast, by Material Type 2020 & 2033
- Table 9: Global Aluminum Aerosol Cans Industry Revenue billion Forecast, by End-user Industry 2020 & 2033
- Table 10: Global Aluminum Aerosol Cans Industry Volume Billion Forecast, by End-user Industry 2020 & 2033
- Table 11: Global Aluminum Aerosol Cans Industry Revenue billion Forecast, by Country 2020 & 2033
- Table 12: Global Aluminum Aerosol Cans Industry Volume Billion Forecast, by Country 2020 & 2033
- Table 13: United States Aluminum Aerosol Cans Industry Revenue (billion) Forecast, by Application 2020 & 2033
- Table 14: United States Aluminum Aerosol Cans Industry Volume (Billion) Forecast, by Application 2020 & 2033
- Table 15: Canada Aluminum Aerosol Cans Industry Revenue (billion) Forecast, by Application 2020 & 2033
- Table 16: Canada Aluminum Aerosol Cans Industry Volume (Billion) Forecast, by Application 2020 & 2033
- Table 17: Global Aluminum Aerosol Cans Industry Revenue billion Forecast, by Material Type 2020 & 2033
- Table 18: Global Aluminum Aerosol Cans Industry Volume Billion Forecast, by Material Type 2020 & 2033
- Table 19: Global Aluminum Aerosol Cans Industry Revenue billion Forecast, by End-user Industry 2020 & 2033
- Table 20: Global Aluminum Aerosol Cans Industry Volume Billion Forecast, by End-user Industry 2020 & 2033
- Table 21: Global Aluminum Aerosol Cans Industry Revenue billion Forecast, by Country 2020 & 2033
- Table 22: Global Aluminum Aerosol Cans Industry Volume Billion Forecast, by Country 2020 & 2033
- Table 23: France Aluminum Aerosol Cans Industry Revenue (billion) Forecast, by Application 2020 & 2033
- Table 24: France Aluminum Aerosol Cans Industry Volume (Billion) Forecast, by Application 2020 & 2033
- Table 25: Germany Aluminum Aerosol Cans Industry Revenue (billion) Forecast, by Application 2020 & 2033
- Table 26: Germany Aluminum Aerosol Cans Industry Volume (Billion) Forecast, by Application 2020 & 2033
- Table 27: Italy Aluminum Aerosol Cans Industry Revenue (billion) Forecast, by Application 2020 & 2033
- Table 28: Italy Aluminum Aerosol Cans Industry Volume (Billion) Forecast, by Application 2020 & 2033
- Table 29: Spain Aluminum Aerosol Cans Industry Revenue (billion) Forecast, by Application 2020 & 2033
- Table 30: Spain Aluminum Aerosol Cans Industry Volume (Billion) Forecast, by Application 2020 & 2033
- Table 31: United Kingdom Aluminum Aerosol Cans Industry Revenue (billion) Forecast, by Application 2020 & 2033
- Table 32: United Kingdom Aluminum Aerosol Cans Industry Volume (Billion) Forecast, by Application 2020 & 2033
- Table 33: Global Aluminum Aerosol Cans Industry Revenue billion Forecast, by Material Type 2020 & 2033
- Table 34: Global Aluminum Aerosol Cans Industry Volume Billion Forecast, by Material Type 2020 & 2033
- Table 35: Global Aluminum Aerosol Cans Industry Revenue billion Forecast, by End-user Industry 2020 & 2033
- Table 36: Global Aluminum Aerosol Cans Industry Volume Billion Forecast, by End-user Industry 2020 & 2033
- Table 37: Global Aluminum Aerosol Cans Industry Revenue billion Forecast, by Country 2020 & 2033
- Table 38: Global Aluminum Aerosol Cans Industry Volume Billion Forecast, by Country 2020 & 2033
- Table 39: China Aluminum Aerosol Cans Industry Revenue (billion) Forecast, by Application 2020 & 2033
- Table 40: China Aluminum Aerosol Cans Industry Volume (Billion) Forecast, by Application 2020 & 2033
- Table 41: India Aluminum Aerosol Cans Industry Revenue (billion) Forecast, by Application 2020 & 2033
- Table 42: India Aluminum Aerosol Cans Industry Volume (Billion) Forecast, by Application 2020 & 2033
- Table 43: Japan Aluminum Aerosol Cans Industry Revenue (billion) Forecast, by Application 2020 & 2033
- Table 44: Japan Aluminum Aerosol Cans Industry Volume (Billion) Forecast, by Application 2020 & 2033
- Table 45: Global Aluminum Aerosol Cans Industry Revenue billion Forecast, by Material Type 2020 & 2033
- Table 46: Global Aluminum Aerosol Cans Industry Volume Billion Forecast, by Material Type 2020 & 2033
- Table 47: Global Aluminum Aerosol Cans Industry Revenue billion Forecast, by End-user Industry 2020 & 2033
- Table 48: Global Aluminum Aerosol Cans Industry Volume Billion Forecast, by End-user Industry 2020 & 2033
- Table 49: Global Aluminum Aerosol Cans Industry Revenue billion Forecast, by Country 2020 & 2033
- Table 50: Global Aluminum Aerosol Cans Industry Volume Billion Forecast, by Country 2020 & 2033
- Table 51: Global Aluminum Aerosol Cans Industry Revenue billion Forecast, by Material Type 2020 & 2033
- Table 52: Global Aluminum Aerosol Cans Industry Volume Billion Forecast, by Material Type 2020 & 2033
- Table 53: Global Aluminum Aerosol Cans Industry Revenue billion Forecast, by End-user Industry 2020 & 2033
- Table 54: Global Aluminum Aerosol Cans Industry Volume Billion Forecast, by End-user Industry 2020 & 2033
- Table 55: Global Aluminum Aerosol Cans Industry Revenue billion Forecast, by Country 2020 & 2033
- Table 56: Global Aluminum Aerosol Cans Industry Volume Billion Forecast, by Country 2020 & 2033
- Table 57: Brazil Aluminum Aerosol Cans Industry Revenue (billion) Forecast, by Application 2020 & 2033
- Table 58: Brazil Aluminum Aerosol Cans Industry Volume (Billion) Forecast, by Application 2020 & 2033
- Table 59: Argentina Aluminum Aerosol Cans Industry Revenue (billion) Forecast, by Application 2020 & 2033
- Table 60: Argentina Aluminum Aerosol Cans Industry Volume (Billion) Forecast, by Application 2020 & 2033
- Table 61: Mexico Aluminum Aerosol Cans Industry Revenue (billion) Forecast, by Application 2020 & 2033
- Table 62: Mexico Aluminum Aerosol Cans Industry Volume (Billion) Forecast, by Application 2020 & 2033
- Table 63: Global Aluminum Aerosol Cans Industry Revenue billion Forecast, by Material Type 2020 & 2033
- Table 64: Global Aluminum Aerosol Cans Industry Volume Billion Forecast, by Material Type 2020 & 2033
- Table 65: Global Aluminum Aerosol Cans Industry Revenue billion Forecast, by End-user Industry 2020 & 2033
- Table 66: Global Aluminum Aerosol Cans Industry Volume Billion Forecast, by End-user Industry 2020 & 2033
- Table 67: Global Aluminum Aerosol Cans Industry Revenue billion Forecast, by Country 2020 & 2033
- Table 68: Global Aluminum Aerosol Cans Industry Volume Billion Forecast, by Country 2020 & 2033
- Table 69: Saudi Arabia Aluminum Aerosol Cans Industry Revenue (billion) Forecast, by Application 2020 & 2033
- Table 70: Saudi Arabia Aluminum Aerosol Cans Industry Volume (Billion) Forecast, by Application 2020 & 2033
- Table 71: United Arab Emirates Aluminum Aerosol Cans Industry Revenue (billion) Forecast, by Application 2020 & 2033
- Table 72: United Arab Emirates Aluminum Aerosol Cans Industry Volume (Billion) Forecast, by Application 2020 & 2033
- Table 73: South Africa Aluminum Aerosol Cans Industry Revenue (billion) Forecast, by Application 2020 & 2033
- Table 74: South Africa Aluminum Aerosol Cans Industry Volume (Billion) Forecast, by Application 2020 & 2033
Frequently Asked Questions
1. What is the projected Compound Annual Growth Rate (CAGR) of the Aluminum Aerosol Cans Industry?
The projected CAGR is approximately 4.62%.
2. Which companies are prominent players in the Aluminum Aerosol Cans Industry?
Key companies in the market include SGD SA (SGD Pharma, Ardagh Metal Packaging SA, Ball Corporation, CCL Container (CCL Industries Inc ), Crown Holdings Inc, Trivium Packaging, Graham Packaging Company, Colep Packaging Portugal SA, Mauser Packaging Solutions (Bway Corporation), CPMC Holdings Limited, Toyo Seikan Co Ltd, NAMPAK Ltd.
3. What are the main segments of the Aluminum Aerosol Cans Industry?
The market segments include Material Type, End-user Industry.
4. Can you provide details about the market size?
The market size is estimated to be USD 7.72 billion as of 2022.
5. What are some drivers contributing to market growth?
Recyclability of Aerosol Cans; Growing Demand from the Personal Care and Cosmetics Industry.
6. What are the notable trends driving market growth?
The Automotive Industry to be the Fastest Growing End User.
7. Are there any restraints impacting market growth?
Stringent Regulations Regarding Waste Disposal.
8. Can you provide examples of recent developments in the market?
February 2024: Lindal Group, a prominent player in the global market for specialized valves, actuators, and spray caps utilized in aerosol products, became a founding partner in the United Kingdom Aerosol Recycling Initiative. This initiative, led by Alupro, aims to enhance awareness and adoption of aerosol recycling throughout the United Kingdom. With the overarching goal of achieving a recycling rate of 50% by 2030, the program unites major corporations and influencers spanning the entire aerosol supply chain. Together, they seek to impact national progress toward sustainable aerosol recycling practices.
9. What pricing options are available for accessing the report?
Pricing options include single-user, multi-user, and enterprise licenses priced at USD 4750, USD 5250, and USD 8750 respectively.
10. Is the market size provided in terms of value or volume?
The market size is provided in terms of value, measured in billion and volume, measured in Billion.
11. Are there any specific market keywords associated with the report?
Yes, the market keyword associated with the report is "Aluminum Aerosol Cans Industry," which aids in identifying and referencing the specific market segment covered.
12. How do I determine which pricing option suits my needs best?
The pricing options vary based on user requirements and access needs. Individual users may opt for single-user licenses, while businesses requiring broader access may choose multi-user or enterprise licenses for cost-effective access to the report.
13. Are there any additional resources or data provided in the Aluminum Aerosol Cans Industry report?
While the report offers comprehensive insights, it's advisable to review the specific contents or supplementary materials provided to ascertain if additional resources or data are available.
14. How can I stay updated on further developments or reports in the Aluminum Aerosol Cans Industry?
To stay informed about further developments, trends, and reports in the Aluminum Aerosol Cans Industry, consider subscribing to industry newsletters, following relevant companies and organizations, or regularly checking reputable industry news sources and publications.
Methodology
Step 1 - Identification of Relevant Samples Size from Population Database


Step 2 - Approaches for Defining Global Market Size (Value, Volume* & Price*)

Note*: In applicable scenarios
Step 3 - Data Sources
Primary Research
- Web Analytics
- Survey Reports
- Research Institute
- Latest Research Reports
- Opinion Leaders
Secondary Research
- Annual Reports
- White Paper
- Latest Press Release
- Industry Association
- Paid Database
- Investor Presentations

Step 4 - Data Triangulation
Involves using different sources of information in order to increase the validity of a study
These sources are likely to be stakeholders in a program - participants, other researchers, program staff, other community members, and so on.
Then we put all data in single framework & apply various statistical tools to find out the dynamic on the market.
During the analysis stage, feedback from the stakeholder groups would be compared to determine areas of agreement as well as areas of divergence